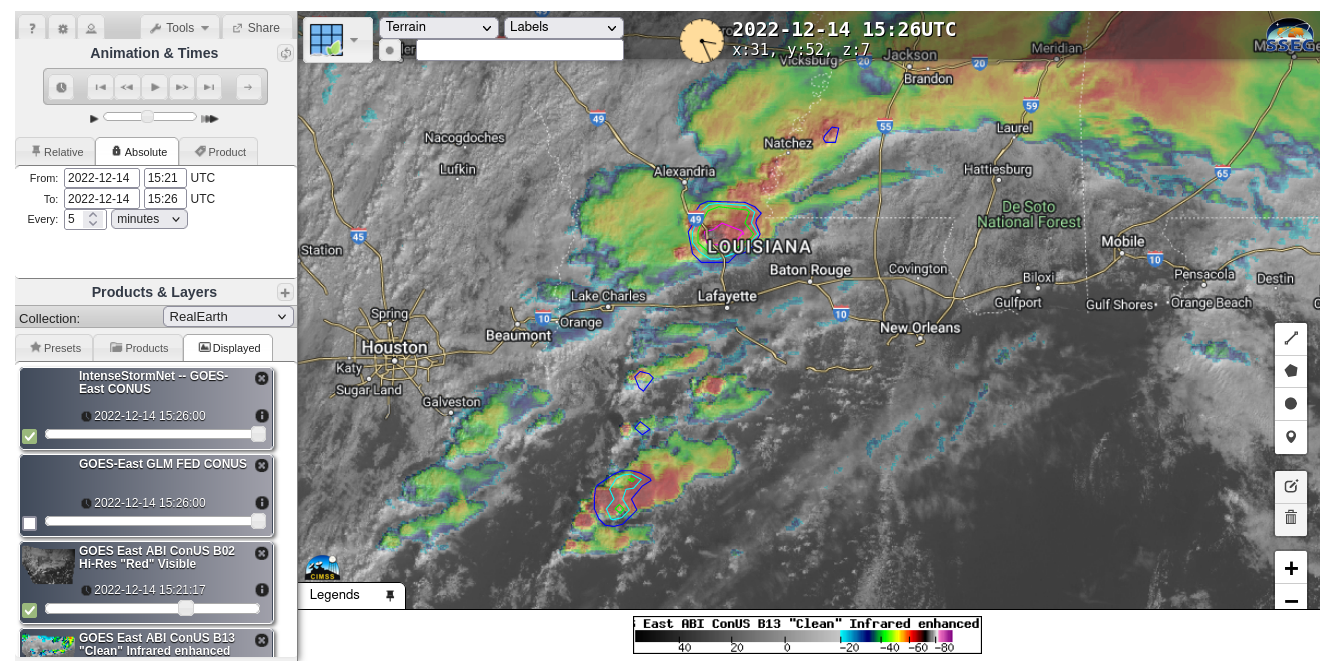
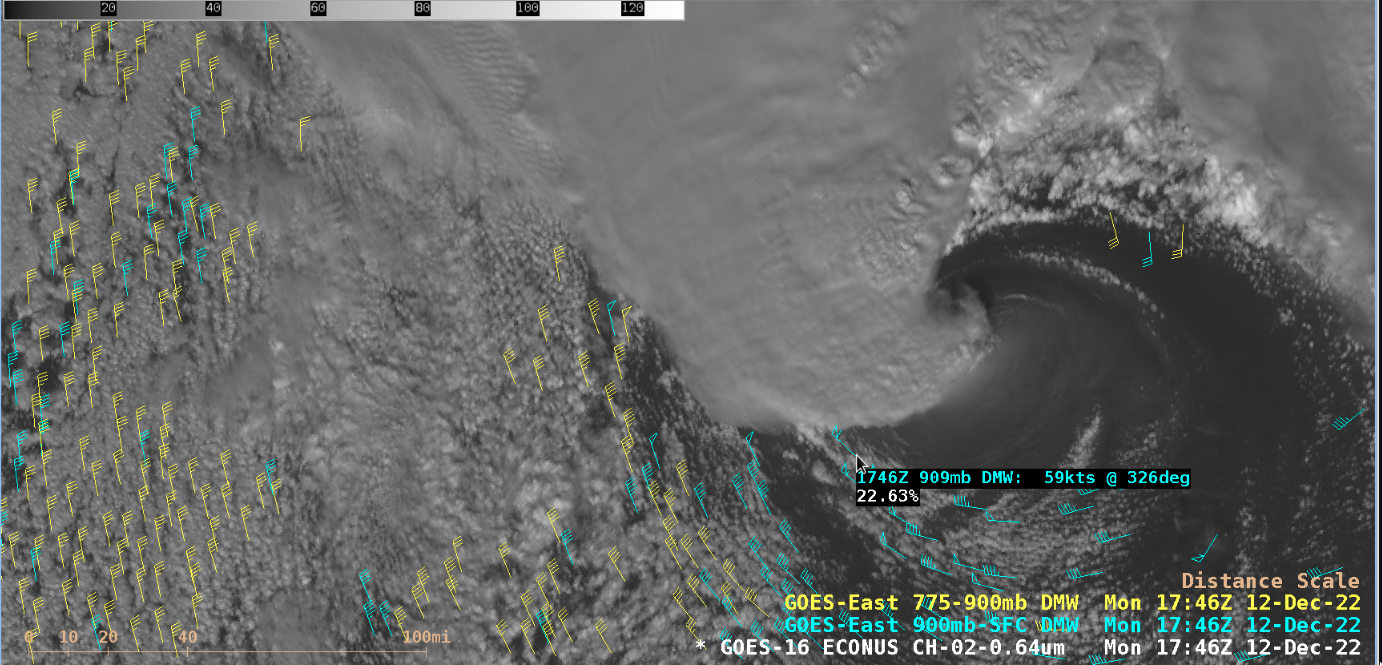
GOES-16 (GOES-East) “Red” Visible (0.64 µm) images (above) include plots of GOES-16 Derived Motion Winds (DMW) within the 775-900 hPa and the 900 hPa-Surface layers — which displayed a rapidly-intensifying area of low pressure (surface analyses) over the West Atlantic Ocean (south of Nova Scotia, Canada) on 12 December 2022. Note the area of haziness just... Read More

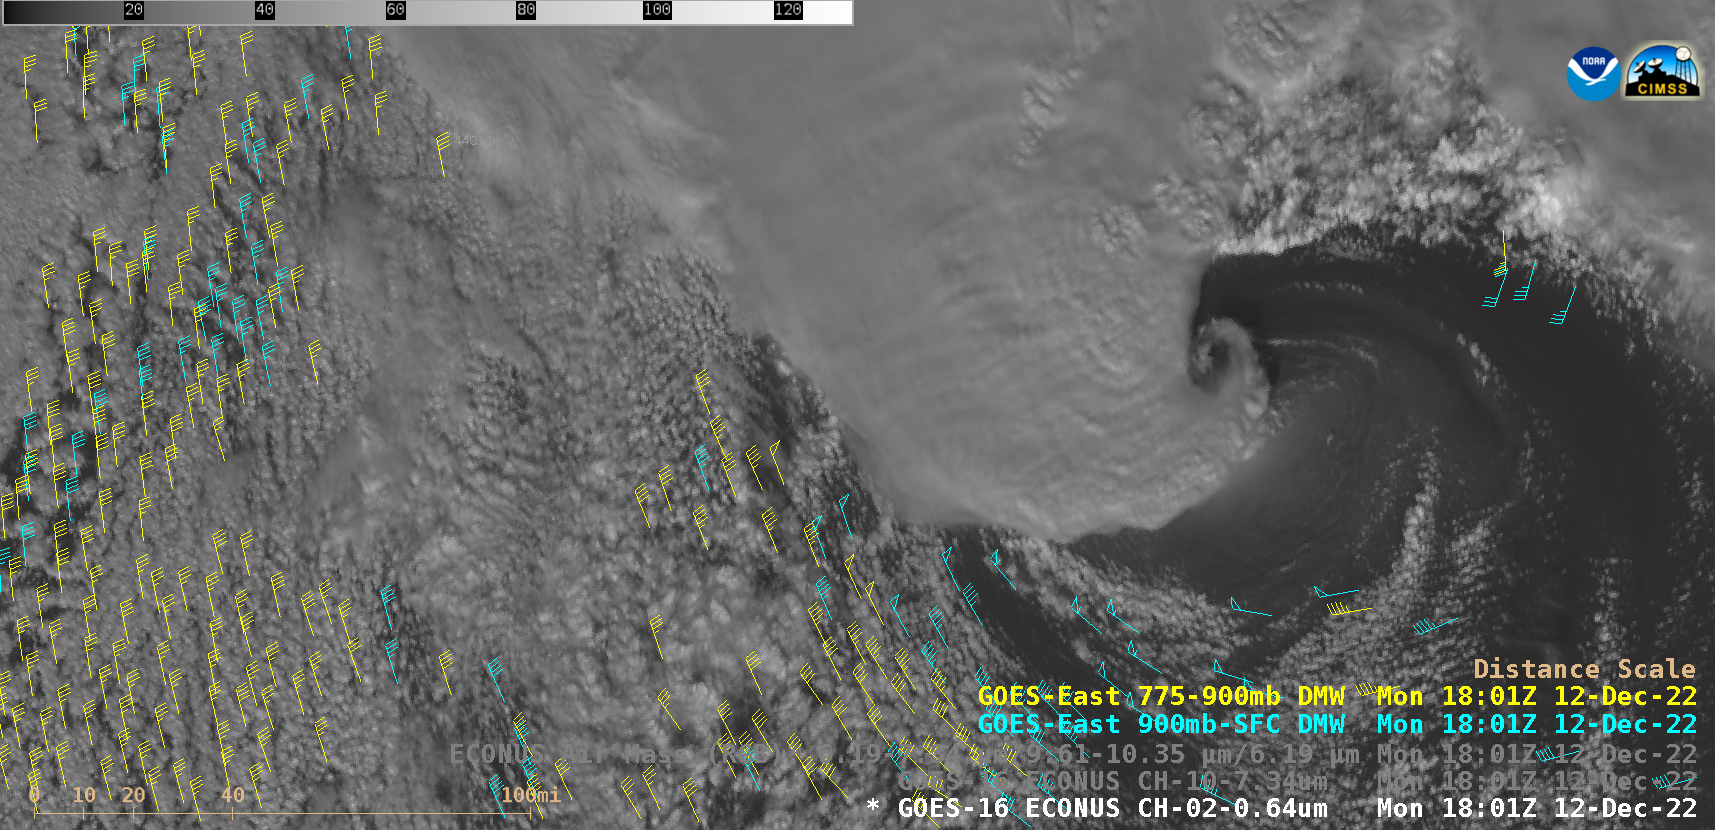
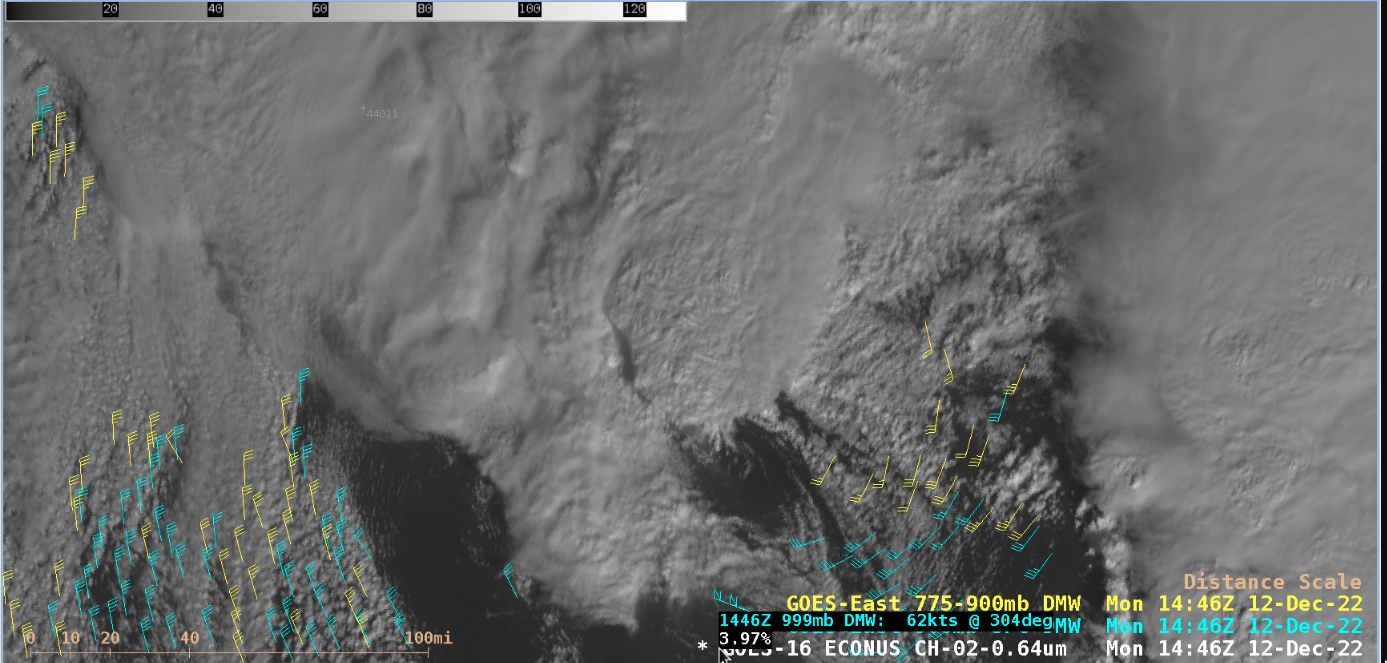
GOES-16 “Red” Visible (0.64 µm) images, with plots of GOES-16 Derived Motion Winds within the 775 – 900 hPa layer (yellow) and the 900 hPa – Surface layer (cyan) [click to play animated GIF | MP4]
GOES-16
(GOES-East) “Red” Visible (
0.64 µm) images
(above) include plots of GOES-16
Derived Motion Winds (DMW) within the 775-900 hPa and the 900 hPa-Surface layers — which displayed a rapidly-intensifying area of low pressure (
surface analyses) over the West Atlantic Ocean (south of Nova Scotia, Canada) on
12 December 2022. Note the area of haziness just east and southeast of the lobe of deep convection in the center of the satellite scene — this milky/hazy appearance was due to the enhanced diffuse reflection of light off very rough seas (likely accompanied by abundant sea spray) resulting from a burst of strong surface winds across that particular area. Several nearby DMW vectors within the 900 hPa-Surface layer exhibited speeds of 50 knots or higher, including
62 knots at 1446 UTC and
59 knots at 1746 UTC. In addition, GCOM-W1 AMSR2 surface winds (
source) in the vicinity of the diffuse reflection signature were around
60 knots at 1813 UTC.
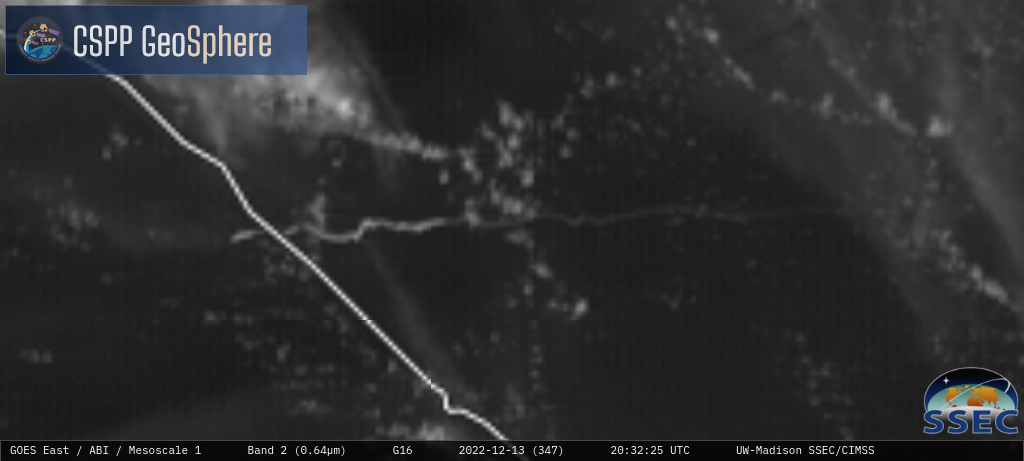
This region of enhanced diffuse reflection was further highlighted in GOES-16 True Color RGB images from the CSPP GeoSphere site (below).
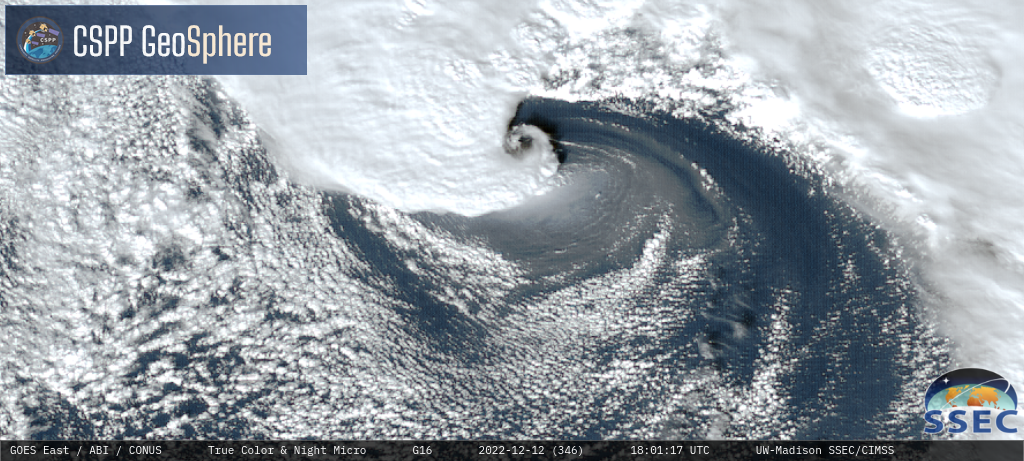
GOES-16 True Color RGB images [click to play MP4 animation]
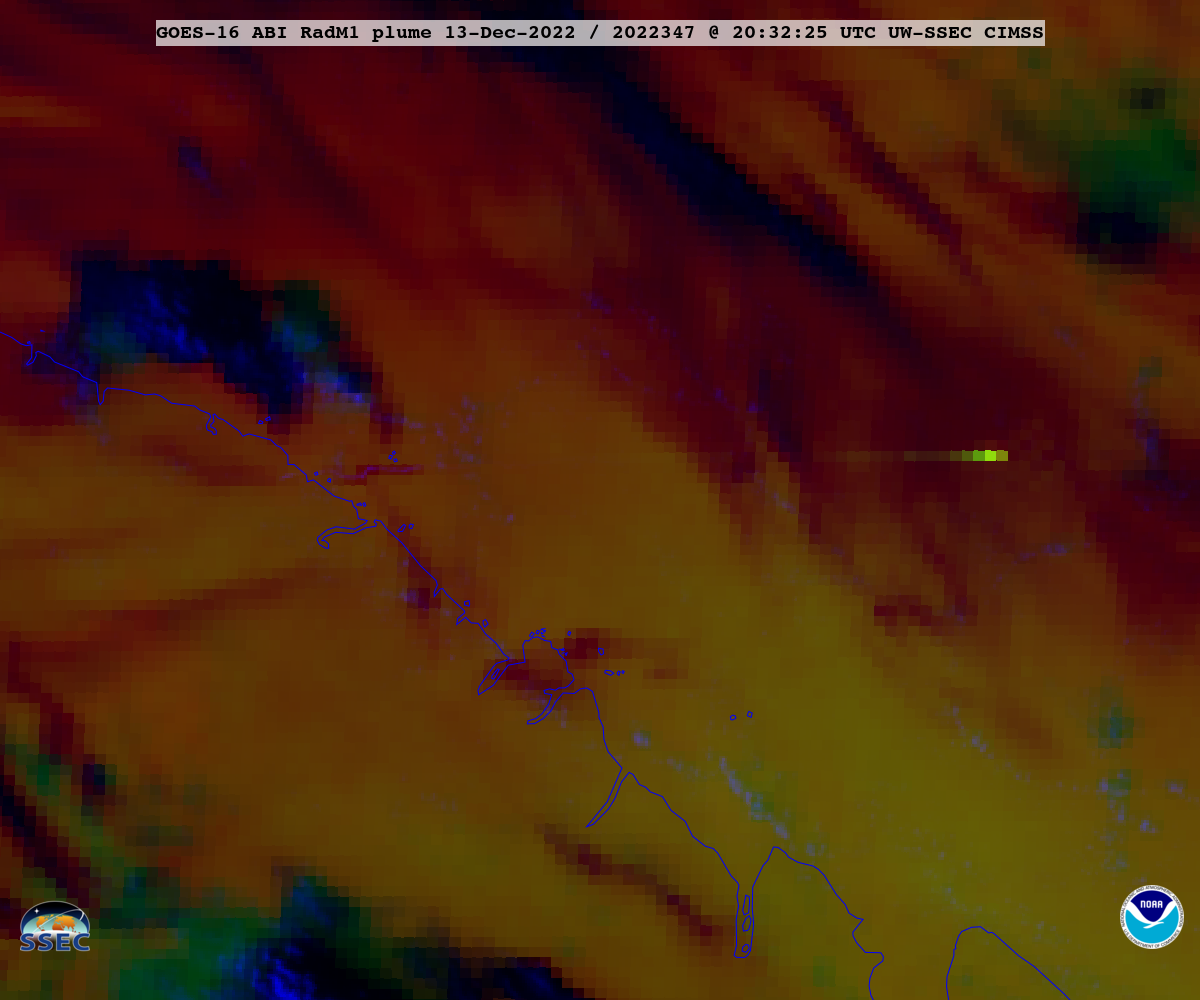
The corresponding GOES-16 Low-level Water Vapor (
7.3 µm) images
(below) showed an area of orange enhancement that likely represented rapidly-descending (and hence warming/drying, via adiabatic compression) air within the lower troposphere, which was rotating around the southeastern and eastern edge of the lobe of deep convection.
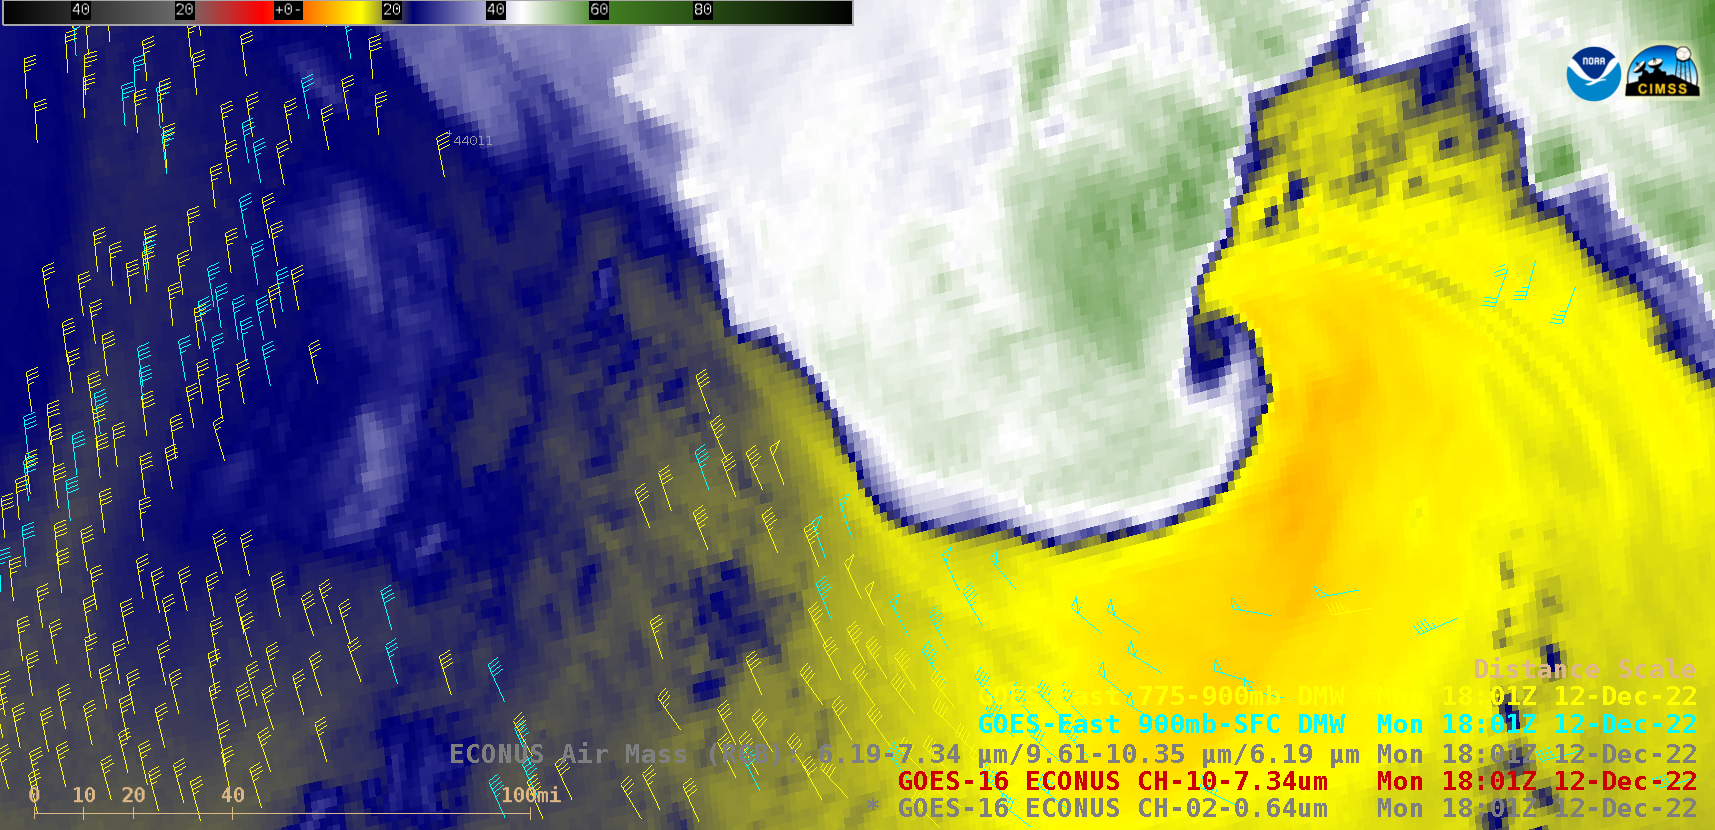
GOES-16 Low-level Water Vapor (7.3 µm) images [click to play animated GIF | MP4]
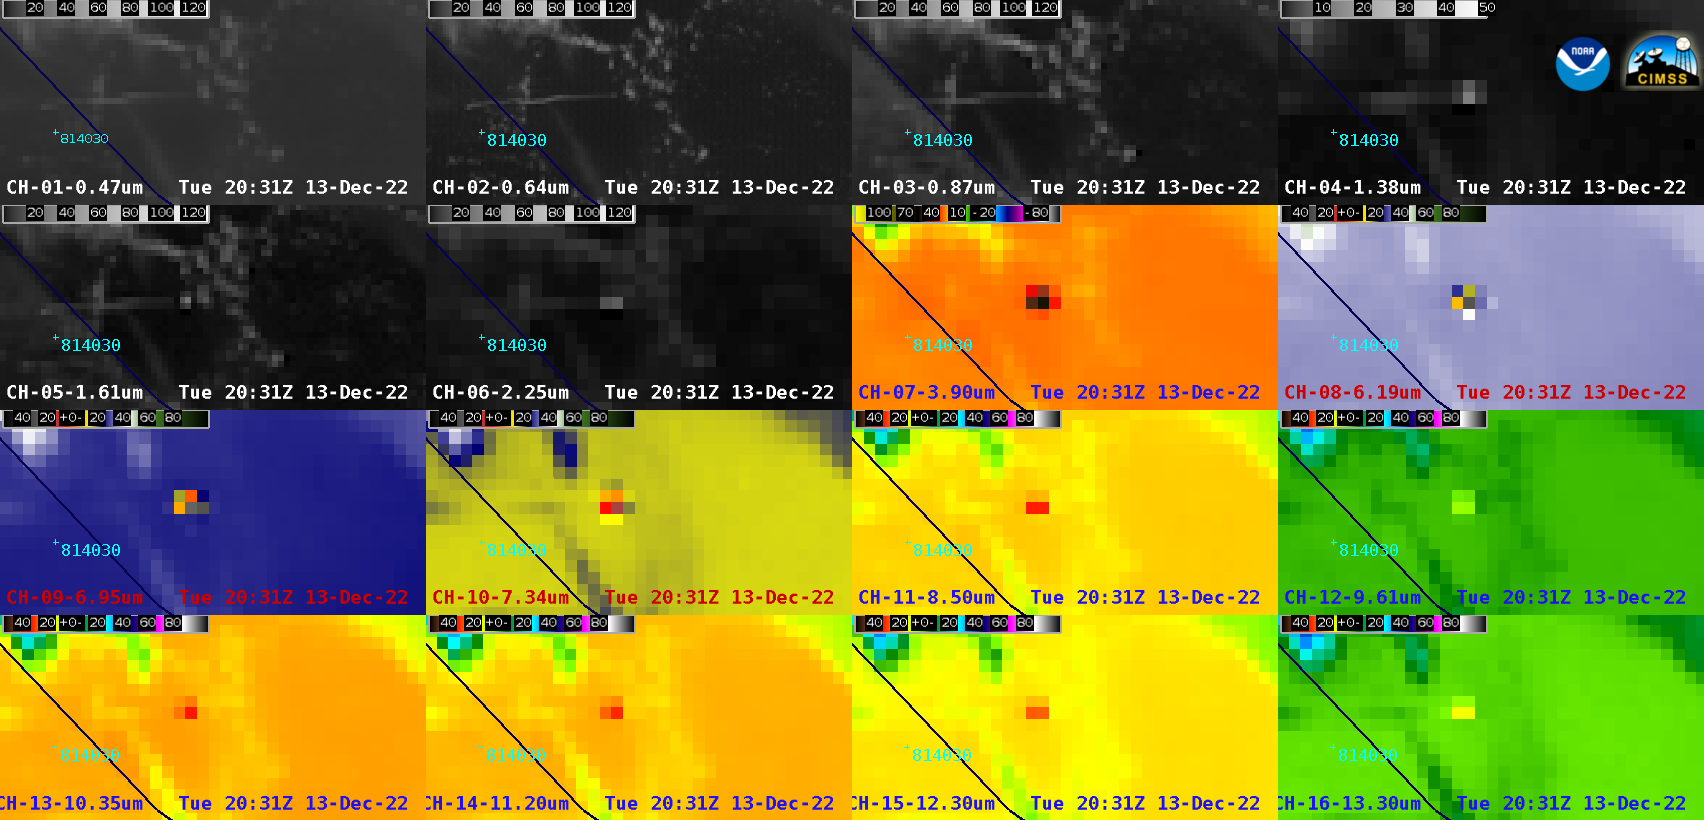
A sequence of Suomi-NPP VIIRS Visible (0.64 µm), Near-Infrared “Vegetation” (0.87 µm), Near-Infrared “Snow/Ice” (1.61 µm), Shortwave Infrared (3.74 µm), Infrared Window (11.45 µm), True Color RGB and False Color RGB images — along with the corresponding GOES-16 Derived Motion Winds near that time
(below) provided a more detailed view of the area of enhanced diffuse reflection. Also apparent at that time was the hook-like shape along the southeastern edge of the lobe of deep convection, somewhat resembling a “scorpion tail” that is frequently seen in cases of a
sting jet (
Monthly Weather Review |
Wikipedia).
Suomi-NPP VIIRS Visible (0.64 µm), Near-Infrared (0.87 µm), Near-Infrared (1.61 µm), Shortwave Infrared (3.74 µm), Infrared Window (11.45 µm), True Color RGB and False Color RGB images, along with GOES-16 Derived Motion Winds [click to enlarge]
The aforementioned satellite signatures in this case resemble those seen with another rapidly-intensifying low off the coast of North Carolina in
April 2019, which also featured a sting jet.
View only this post
Read Less
