This website works best with a newer web browser such as Chrome, Firefox, Safari or Microsoft
Edge. Internet Explorer is not supported by this website.
NOAA‘s GOES ABI has been monitoring the late year cold air outbreak over the contiguous US. Infrared ImageryDuring these extreme cold air outbreaks, it may seem like the infrared imagery “confuses” clouds and the cold ground, but this isn’t the case as the instrument just monitors the heat of the... Read More
NOAA‘s GOES ABI has been monitoring the late year cold air outbreak over the contiguous US.
Infrared Imagery
During these extreme cold air outbreaks, it may seem like the infrared imagery “confuses” clouds and the cold ground, but this isn’t the case as the instrument just monitors the heat of the radiating surface, be it a cold cloud top or cold land (or warmer sea surfaces). More likely, as the case below, a certain temperature threshold is used for the color enhancement, in this case colder than -20C. More imagery, including the CONUS sectors. A still image from 13 UTC on December 23, 2022.
GOES-16 ABI longwave infrared window band, with the coldest pixels color-coded. Several days (December 19-26, 2022) are shown. Click to play animation. GOES-16 ABI longwave infrared window band, with the coldest pixels color-coded. Several days are shown, with one hourly imagery. Click to play animation.
Land Surface Temperature
The Land Surface Temperature is one of the many derived products from the ABI. Both the Full Disk and CONUS sectors are included. Note how the cold air has come from central Canada.
GOES-16 CONUS Land Surface Temperature on December 22, 2022, click to play animation. GOES-16 Full Disk Land Surface Temperature on December 22, 2022, click to play animation.
Cloud Heights
Cloud heights are another derived quantity from the ABI radiances. Most algorithms are able to discern the cold ground from cold clouds.
GOES-16 ABI Clouds Heights for the CONUS sector on December 23, 2022, click to play animation.
It’s very hard to choose just one event from every month of the year, but the goal is to show the range of phenomena and locations that NOAA‘s GOES ABI routinely monitors, in this case during 2022. Most loops generated are from the University of Wisconsin-Madison CIMSS Satellite Blog, which... Read More
It’s very hard to choose just one event from every month of the year, but the goal is to show the range of phenomena and locations that NOAA‘s GOES ABI routinely monitors, in this case during 2022. Most loops generated are from the University of Wisconsin-Madison CIMSS Satellite Blog, which is linked from the top of the entries. Imagery from GOES-16, -17 and -18 is showcased, along with the sectors it scans: Full Disk (10-min intervals), Contiguous US (5-min intervals) and mesoscale sectors (30-sec to 1-min intervals).
GOES-17 “Red” Visible (0.64 µm, left) and “Clean” Infrared Window (10.35 µm, right) images [click to play animation]GOES-17 Mid-level Water Vapor (6.9 µm) Time Difference images [click to play animation]
GOES-16 ABI RGB Composite (Day Cloud Phase Distinction), shows bands of snow showers/squalls rotating through northern Minnesota and northwestern Wisconsin [click to play animation]
The greenish colors show clear, snow-covered ground, the purplish colors the low-clouds (snow squalls), while the orange colors denote high clouds. A direct link to the above mp4 video.
GOES-16 True Color RGB images [click to play animation]GOES-16 “Red” Visible (0.64 µm, top left), Shortwave Infrared (3.9 µm, top right), Fire Power (lower left) and Fire Temperature (bottom right), [click to play animation]
A direct link to the loop showing the smoke plume in Texas with GOES-16 imagery every minute; as well as the 4-panel AWIPS display that included derived fire products.
GOES-16 True Color RGB images [click to play animation]
GOES-16 (GOES-East) True Color RGB images revealed dense smoke plumes moving southeastward from wildfires in New Mexico, while blowing dust plunged southward from Colorado/Kansas (along and behind a cold front). The mp4 animation.
A true color composite image, along with all 16 spectral bands of the preliminary, non-operational GOES-18 ABI on May 5, 2022. [click to play animation]
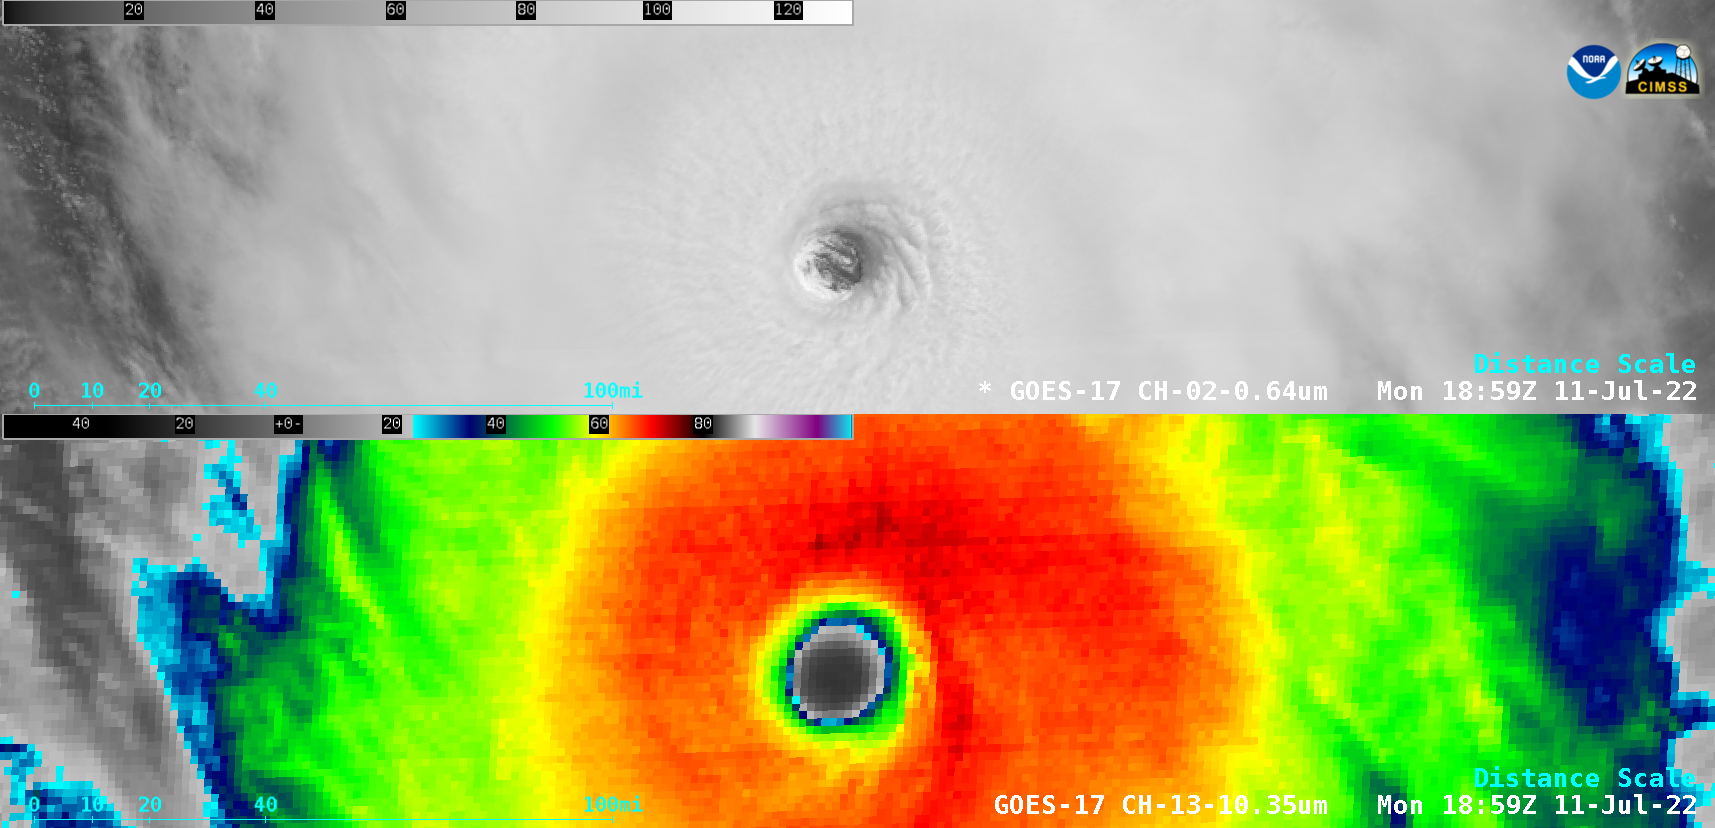
GOES-17 “Red” Visible (0.64 µm, top) and “Clean” Infrared Window (10.35 µm, lower) images [click to play animation]
1-minute Mesoscale Domain Sector GOES-17 (GOES-West) “Red” Visible (0.64 µm) and “Clean” Infrared Window (10.35 µm) images showed the evolution of the eye of Hurricane Darby as it moved westward across the East Pacific Ocean on 11 July 2022. Mesovortices were evident within the eye.
GOES-16 IFR (Instrument Flight Rules) Probability (top panel) and GOES-16 Night Microphysics RGB (lower panel), both with surface observations of ceilings and visibilities, click for animation.
Infrared GOES-16 ABI of Hurricane Ian in 2022 (left) and GOES-12 of Hurricane Charley in 2004 (right). [click to play animation]
The mp4 loop from above demonstrating the great advances in monitoring hurricanes between 2004 and 2022, comparing GOES-16 (on the left) and GOES-12 (on the right). A 16 panel of Hurricane Ian from the ABI showing the range of scales that the ABI monitors in a given image.
GOES-16 “Red” Visible (0.64 µm) and Day Cloud Phase Distinction RGB images [click to play animation]
1-minute Mesoscale Domain Sector GOES-16 (GOES-East) “Red” Visible (0.64 µm) and Day Cloud Phase Distinction RGB images showed the compact exposed low-level circulation of Tropical Invest 94L as it moved northward away from Bermuda. Satellites are key in monitoring hurricane formations.
GOES-17 Clean Window Infrared (10.3 µm) imagery and quantitative estimates of Ash/Dust Probability, click to play animation16-Panel showing all GOES-18 bands over Hawai’i, click to play animation.
A mp4 loop of the Ash/Dust Probability, as well as the 16 ABI spectral bands. Note there are 2 visible, 4 near-infrared and 10 infrared bands. Satellites are critical for monitoring volcanic ash that can pose a hazard to aviation safety.
Thanks to all who make the satellite imagery possible, the ingest and software to display the imagery (including, but not limited to McIDAS-X, geo2grid, geosphere, Real Earth and AWIPS) and all who generated CIMSS Satellite Blog entries, especially Scott Bachmeier and Scott Lindstrom. Special thanks to Mat Gunshor and Jim Nelson of UW/CIMSS.
11 UTC loops from the Summer to Winter Solstices. These posted GOES ABI Full Disk imagery are only showing a small number of the pixels, for a fuller resolution image at one time (20-March-2022).
GOES-16 ABI true color images at 14 UTC each day from the 2022 Spring to Winter Solstices.
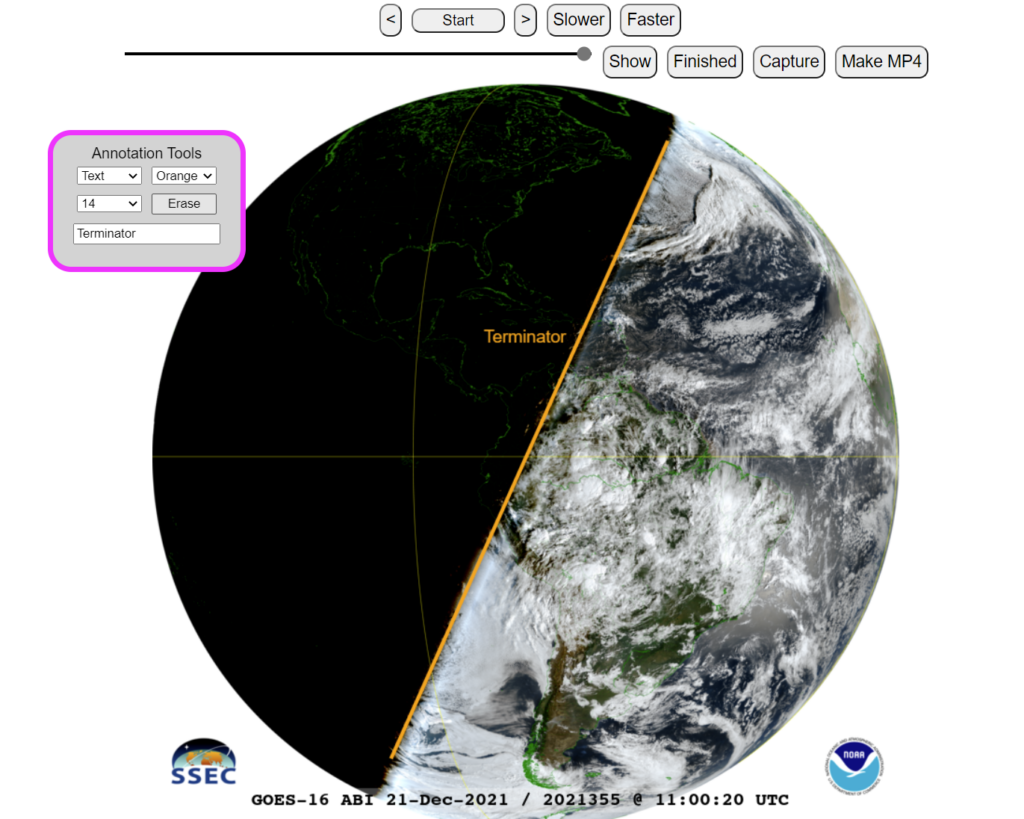
The interactive web page that allows one to annotate images, such as drawing lines. (Click on the image to go to the webapp.) An annotated image, with text and a line. Example from 2021. (Click on the image to go to the webapp.)
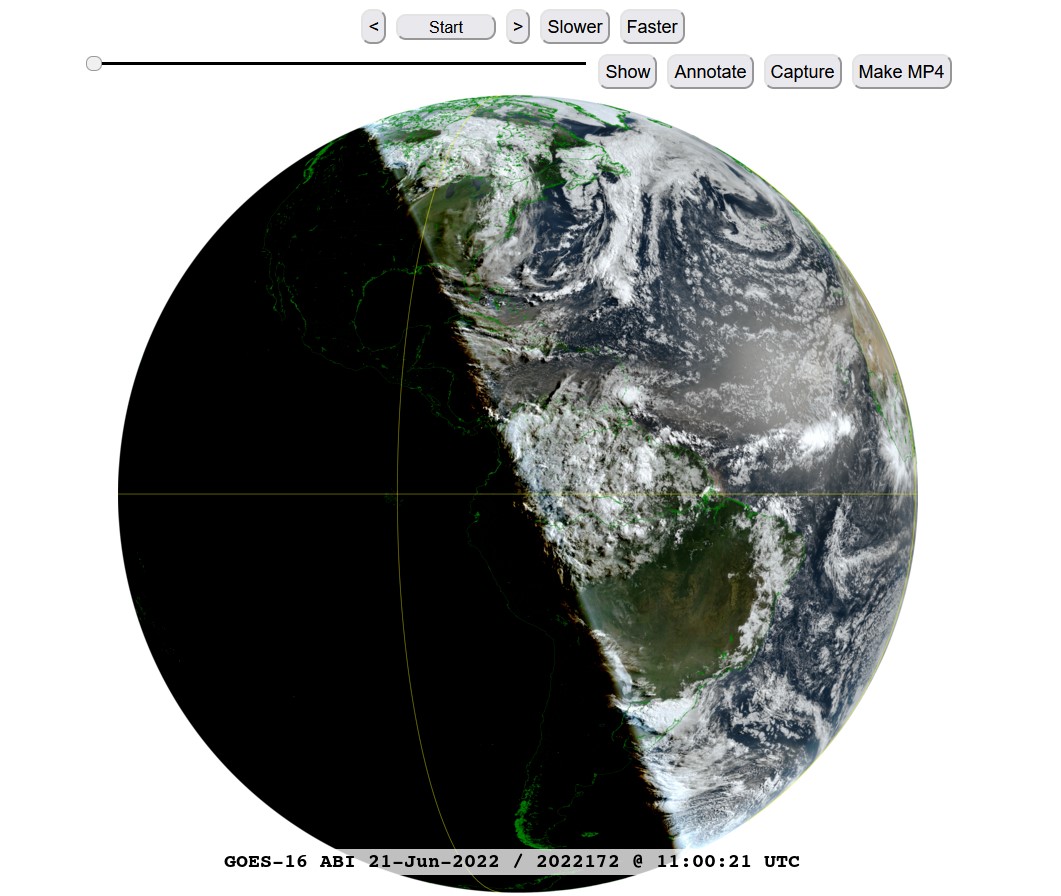
An interactive web page with almost a years (2022) worth of GOES ABI Full Disk visible images at 11 UTC. The beginning date is the (northern hemisphere) summer solstice in 2022 and the end date is the winter solstice in 2022. A user can play the animation, as well as annotate the images. For example, draw lines along the terminator for different times of the year. One example might be to compare a solstice to an equinox. Can you estimate the day of the summery equinox? H/T Tom Whittaker, SSEC, for the webapp, as well as those below.
Compare two images
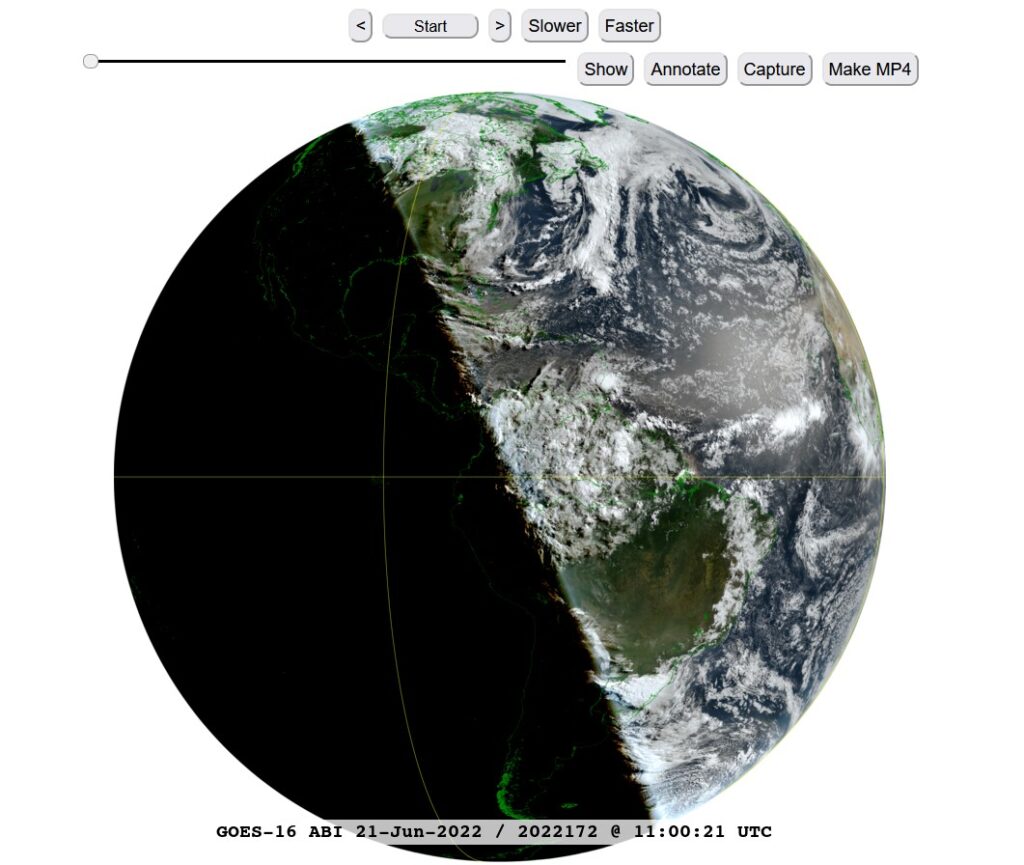
Drag the vertical bar to display a Northern Hemisphere (NH) GOES-16 11 UTC image at the Summer or Winter Solstices.
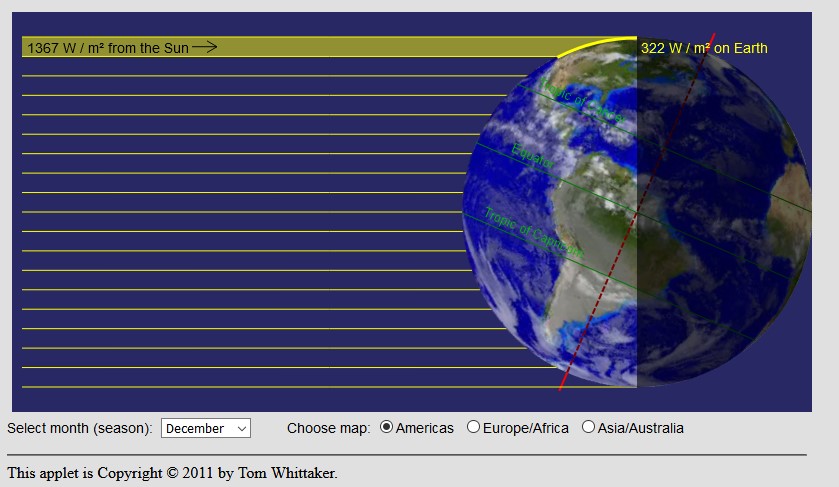
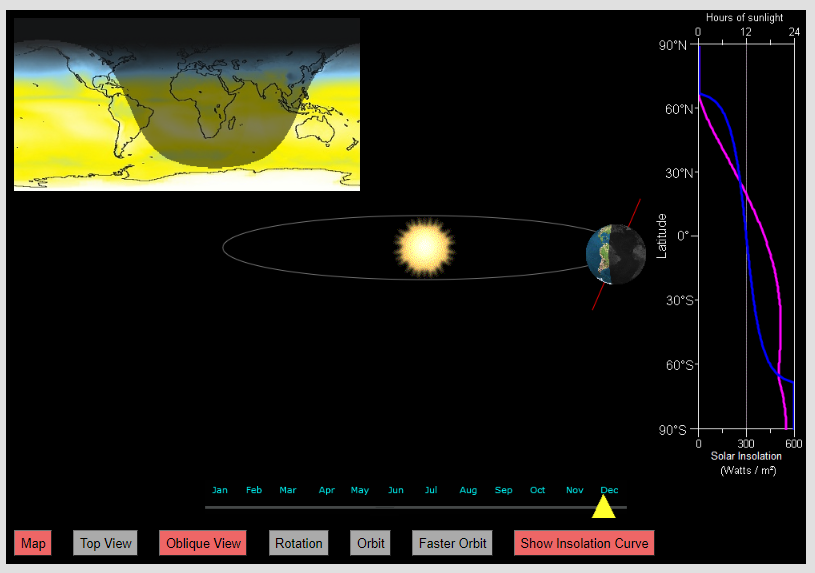
Screen shot of the webapp where one can explore the effect of the angle of incidence on sun’s energy. (Click on the image to go to the webapp.)Explore the changing seasons on Earth by relating the orbit, rotation and solar insolation with this webapp by T. Whittaker. (Click on the image to go to the webapp.)
H/T
These images were made using NOAA data with geo2grid software, from UW-Madison, SSEC. T. Whittaker is thanked for the webapps.
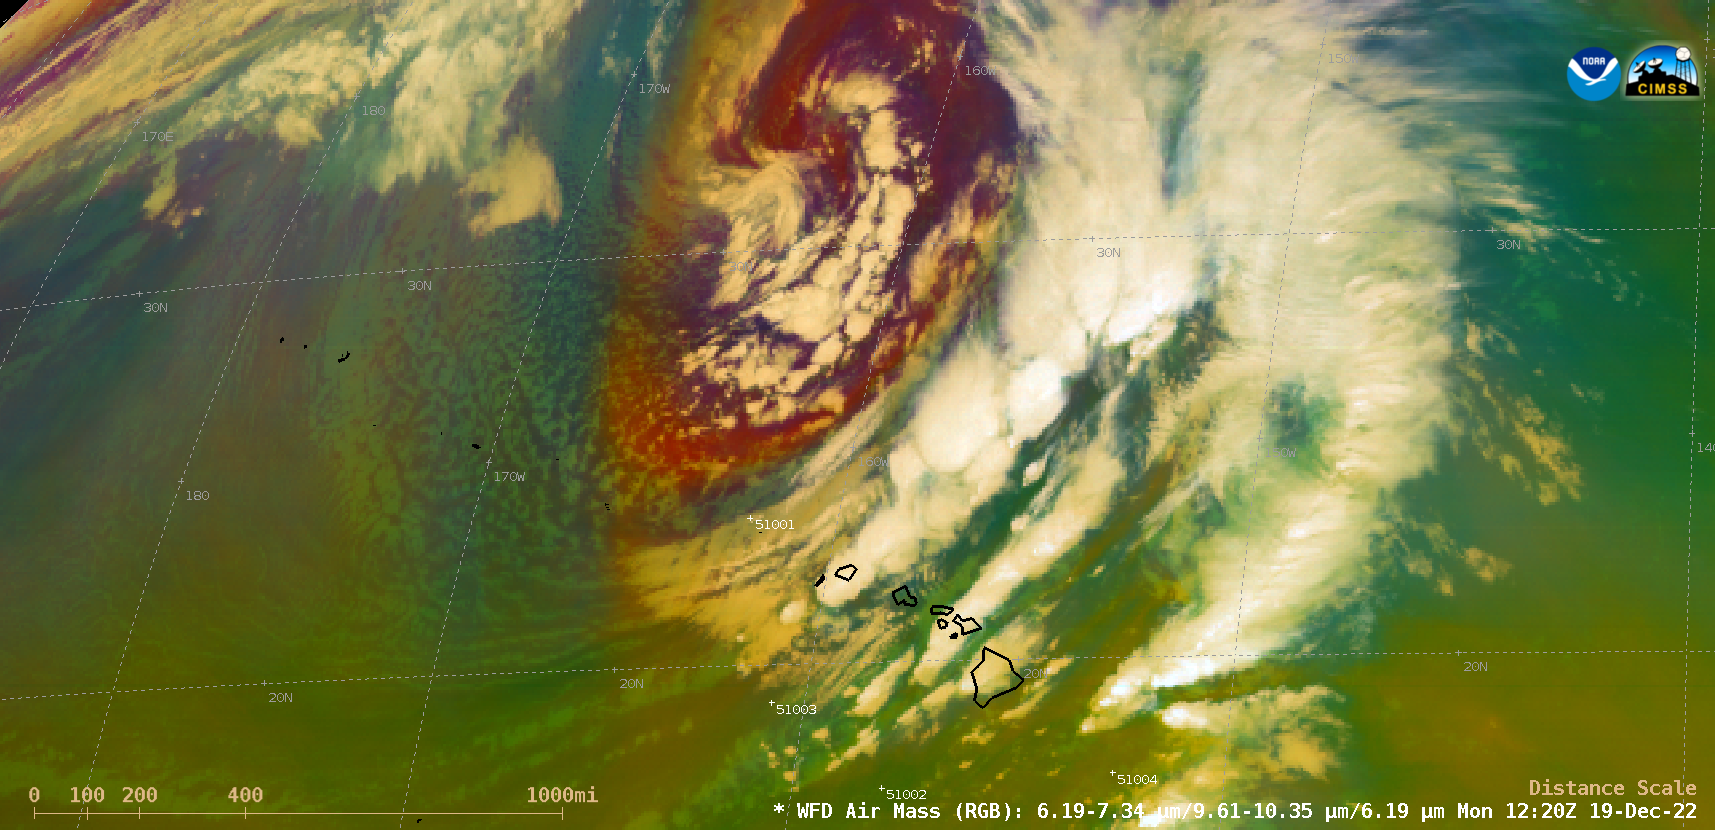
An anomalousy deep extratropical storm or “Kona Storm” north of Hawai`i (surface analyses) brought strong winds and heavy rainfall to much of the island chain during the 18-20 December 2022 period. GOES-17 (GOES-West) Air Mass RGB images (above) showed the core of the storm (darker shades of orange-red) as well as widespread thunderstorms along and ahead of the... Read More
GOES-17 Air Mass RGB images [click to play MP4 animation]
An anomalousy deep extratropical storm or “Kona Storm” north of Hawai`i (surface analyses) brought strong winds and heavy rainfall to much of the island chain during the 18-20 December 2022 period. GOES-17 (GOES-West)Air Mass RGB images (above) showed the core of the storm (darker shades of orange-red) as well as widespread thunderstorms along and ahead of the storm’s strong cold front.
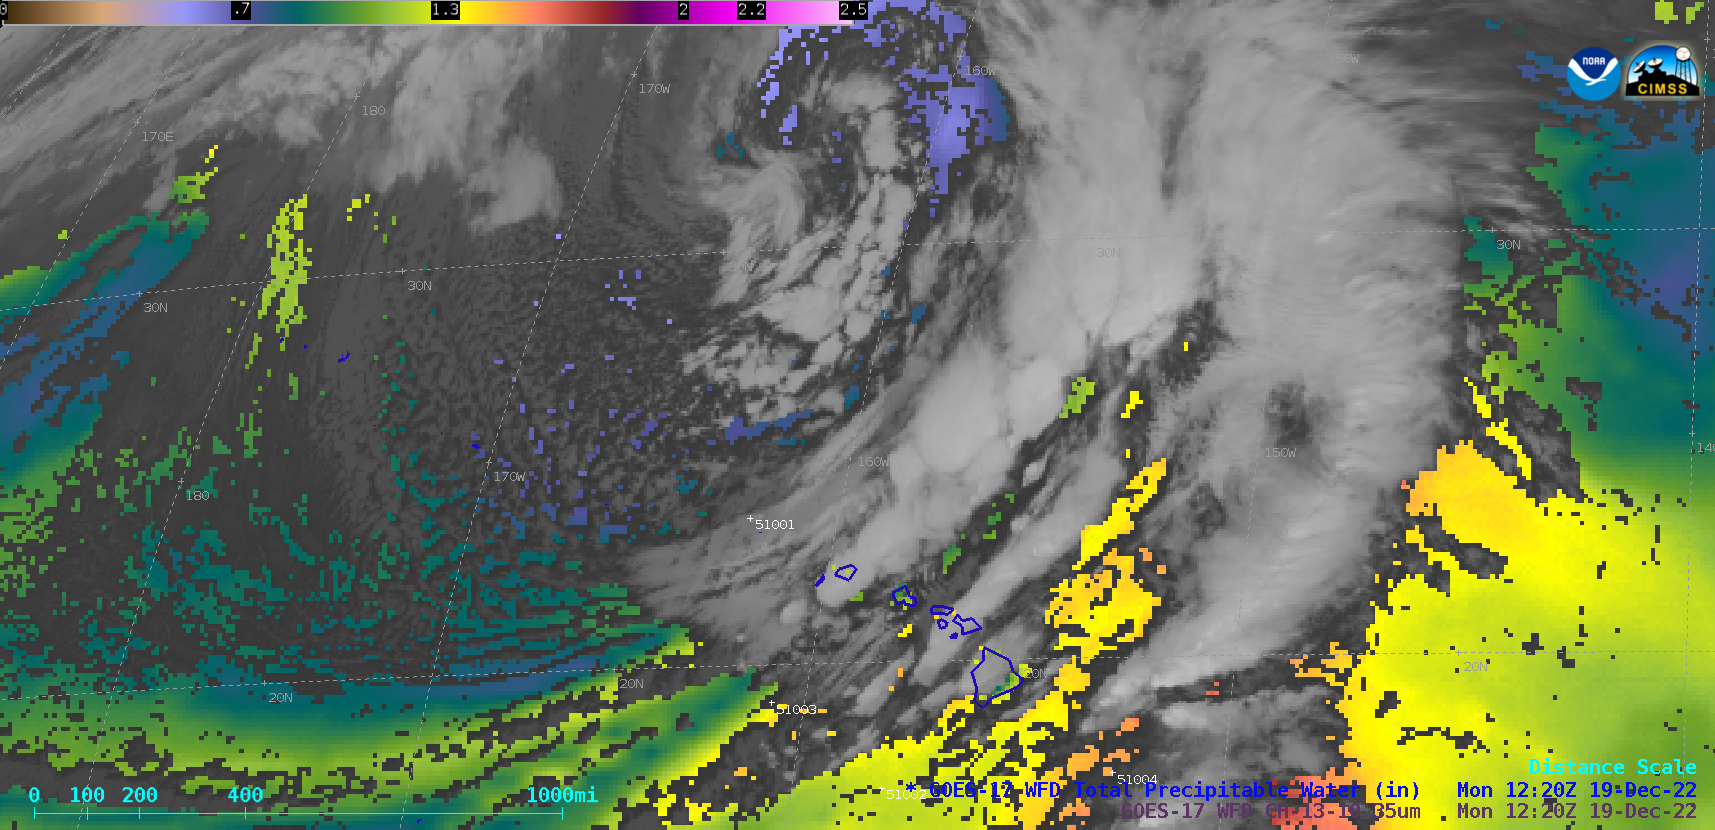
GOES-17 Total Precipitable Water and “Clean” Infrared Window (10.3 µm) images (below) depicted the tropical moisture that was drawn northward across the islands, providing fuel for development of the thunderstorms.
GOES-17 Total Precipitable Water and “Clean” Infrared Window (10.3 µm) images [click to play MP4 animation]
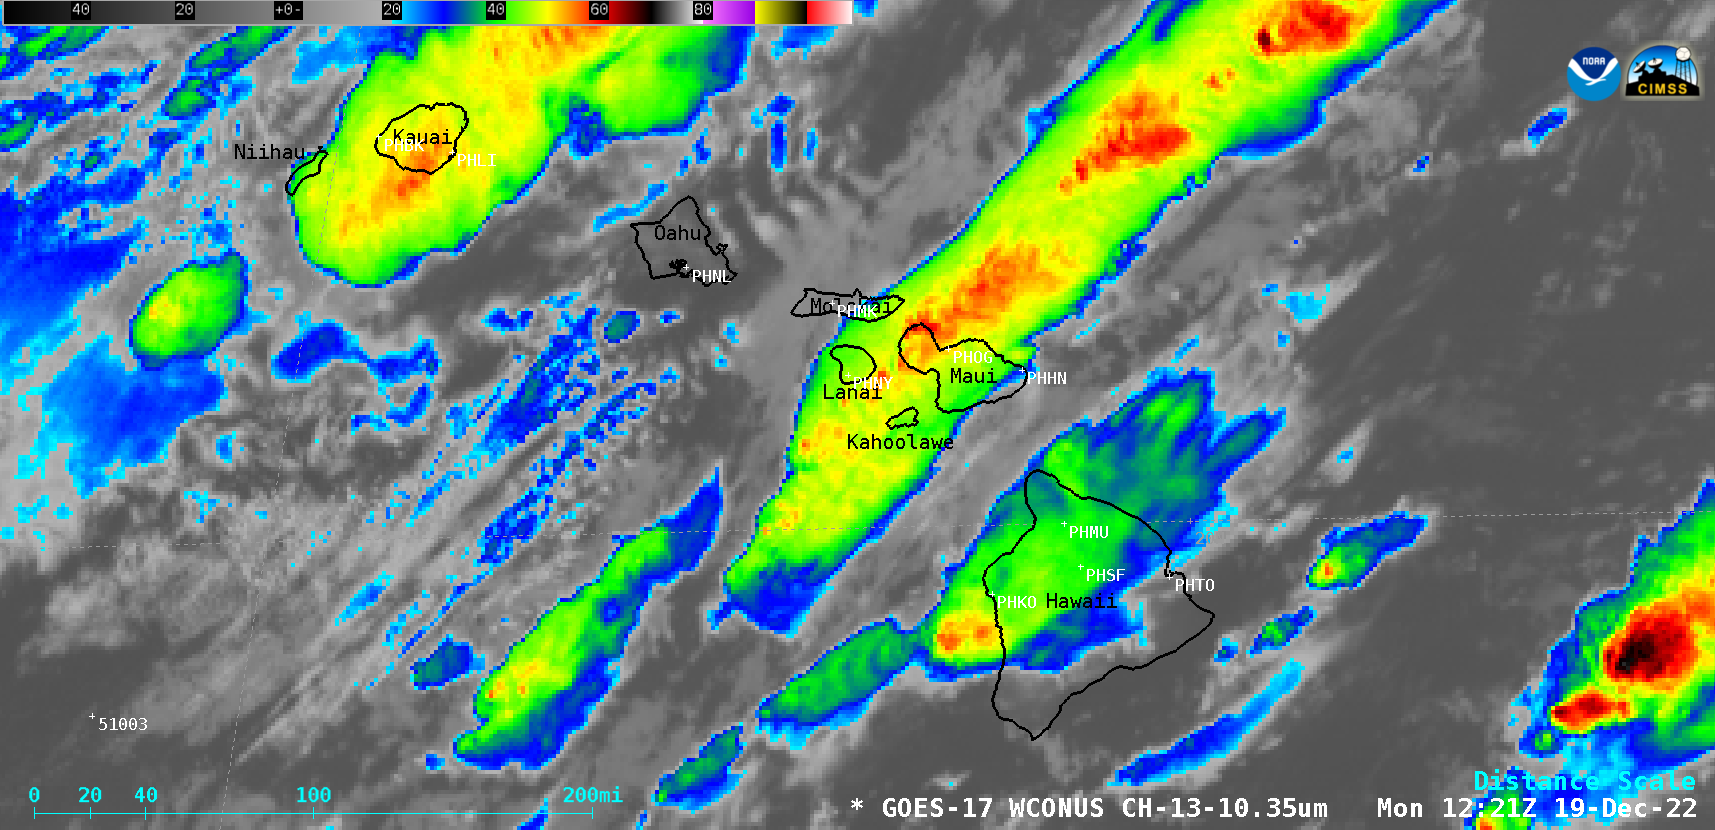
A closer view using GOES-17 Infrared images (below) showed the cold cloud-top infrared brightness temperatures associated with the thunderstorm activity — some of which was responsible for an aircraft encounter with severe turbulence.
GOES-17 “Clean” Infrared Window (10.3 µm) mages [click to play MP4 animation]
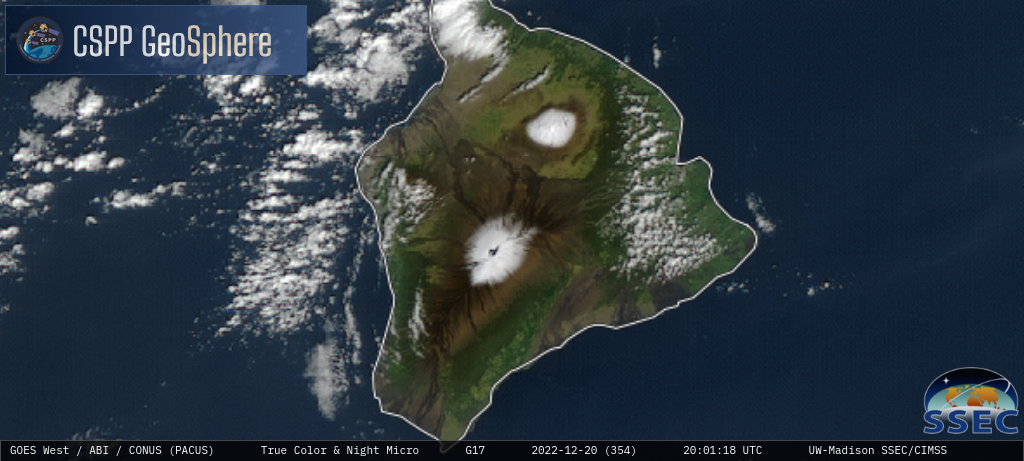
On 20 December, a sequence of GOES-17 True Color RGB and Shortwave Infrared (3.9 µm) images from the CSPP GeoSphere site (below) showed fresh snow cover on the higher elevations of Mauna Kea and Mauna Loa. Note the lack of snow cover at the summit of the recent Mauna Loa eruption — this was caused by warm sub-surface lava from that eruption, which melted the snow.
GOES-17 True Color RGB and Shortwave Infrared (3.9 µm) images [click to play MP4 animation]
A toggle between GOES-17 “Red” Visible (0.64 µm) and Shortwave Infrared (3.9 µm) images at 2251 UTC (below) provided a closer view of the thermal signature at the Mauna Loa summit.
GOES-17 “Red” Visible (0.64 µm) and Shortwave Infrared (3.9 µm) images [click to enlarge]

