
GOES-16 “Clean” Infrared Window (10.3 µm) images, with time-matched SPC Storm Reports plotted in white [click to play animated GIF | MP4]
View only this post Read Less
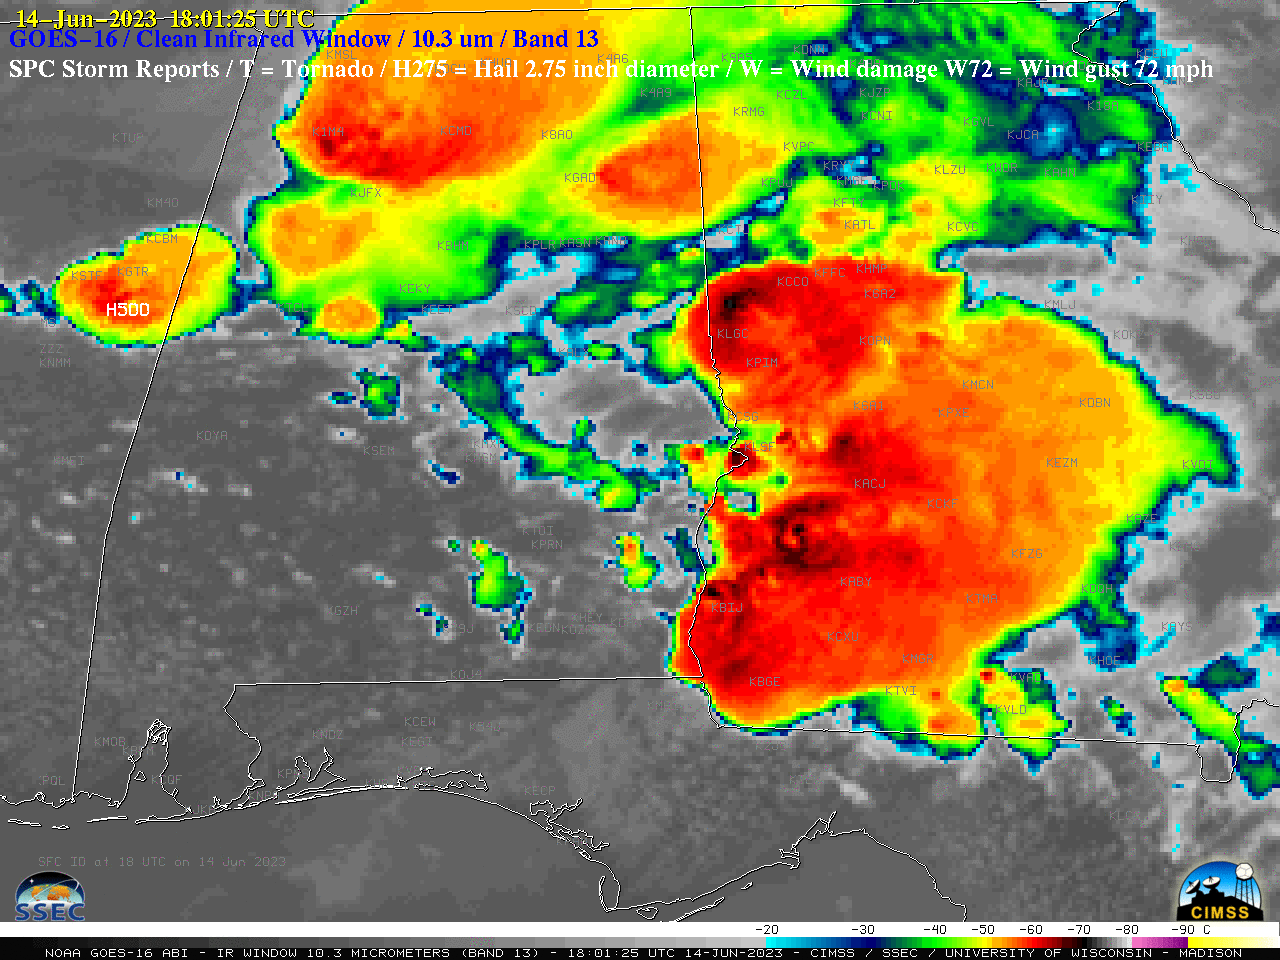
1-minute Mesoscale Domain Sector GOES-16 (GOES-East) “Clean” Infrared Window (10.3 µm) images with time-matched (+/- 3 minutes) plots of SPC Storm Reports (above) showed thunderstorms that produced several tornadoes, hail as large as 5.00 inches in diameter, and damaging winds to 82 mph across parts of Mississippi, Alabama, Georgia and Florida on 14 June 2023. Pulses of overshooting tops exhibited infrared brightness temperatures... Read More
GOES-16 “Clean” Infrared Window (10.3 µm) images, with time-matched SPC Storm Reports plotted in white [click to play animated GIF | MP4]
View only this post Read Less
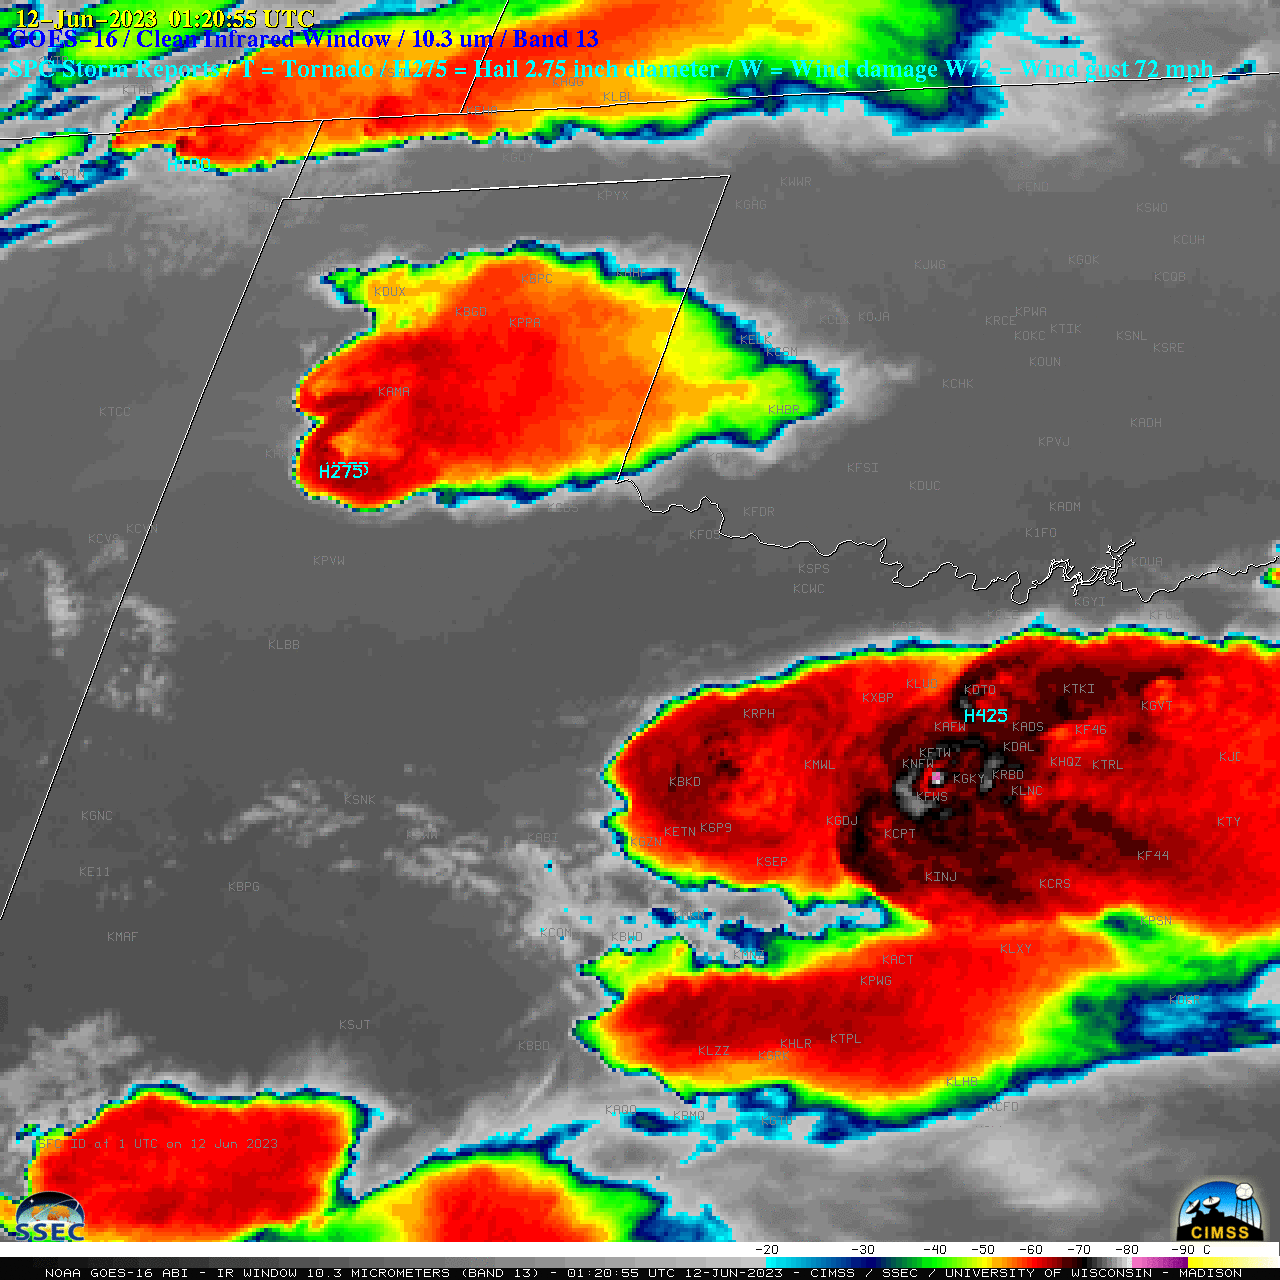
1-minute Mesoscale Domain Sector GOES-16 (GOES-East) “Clean” Infrared Window (10.3 µm) images with time-matched (+/- 3 minutes) plots of SPC Storm Reports (above) showed thunderstorms that produced hail as large as 4.50 inches in diameter, damaging winds to 71 mph and a tornado across parts of New Mexico, Texas and Oklahoma from the late afternoon into the subsequent... Read More

GOES-16 “Clean” Infrared Window (10.3 µm) images, with time-matched SPC Storm Reports plotted in cyan [click to play animated GIF | MP4]
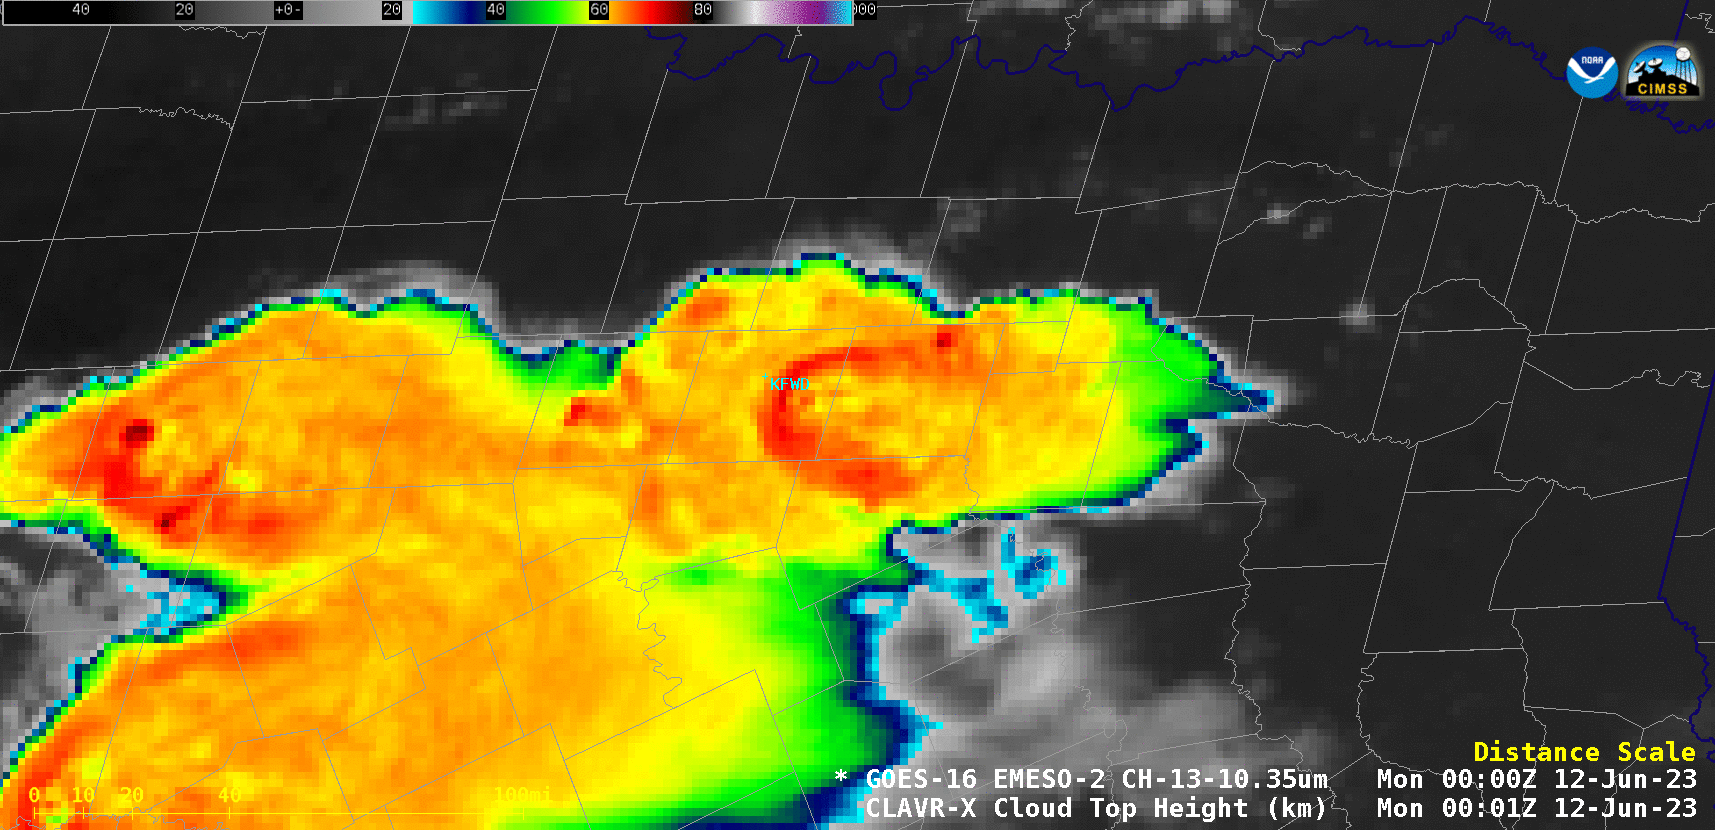
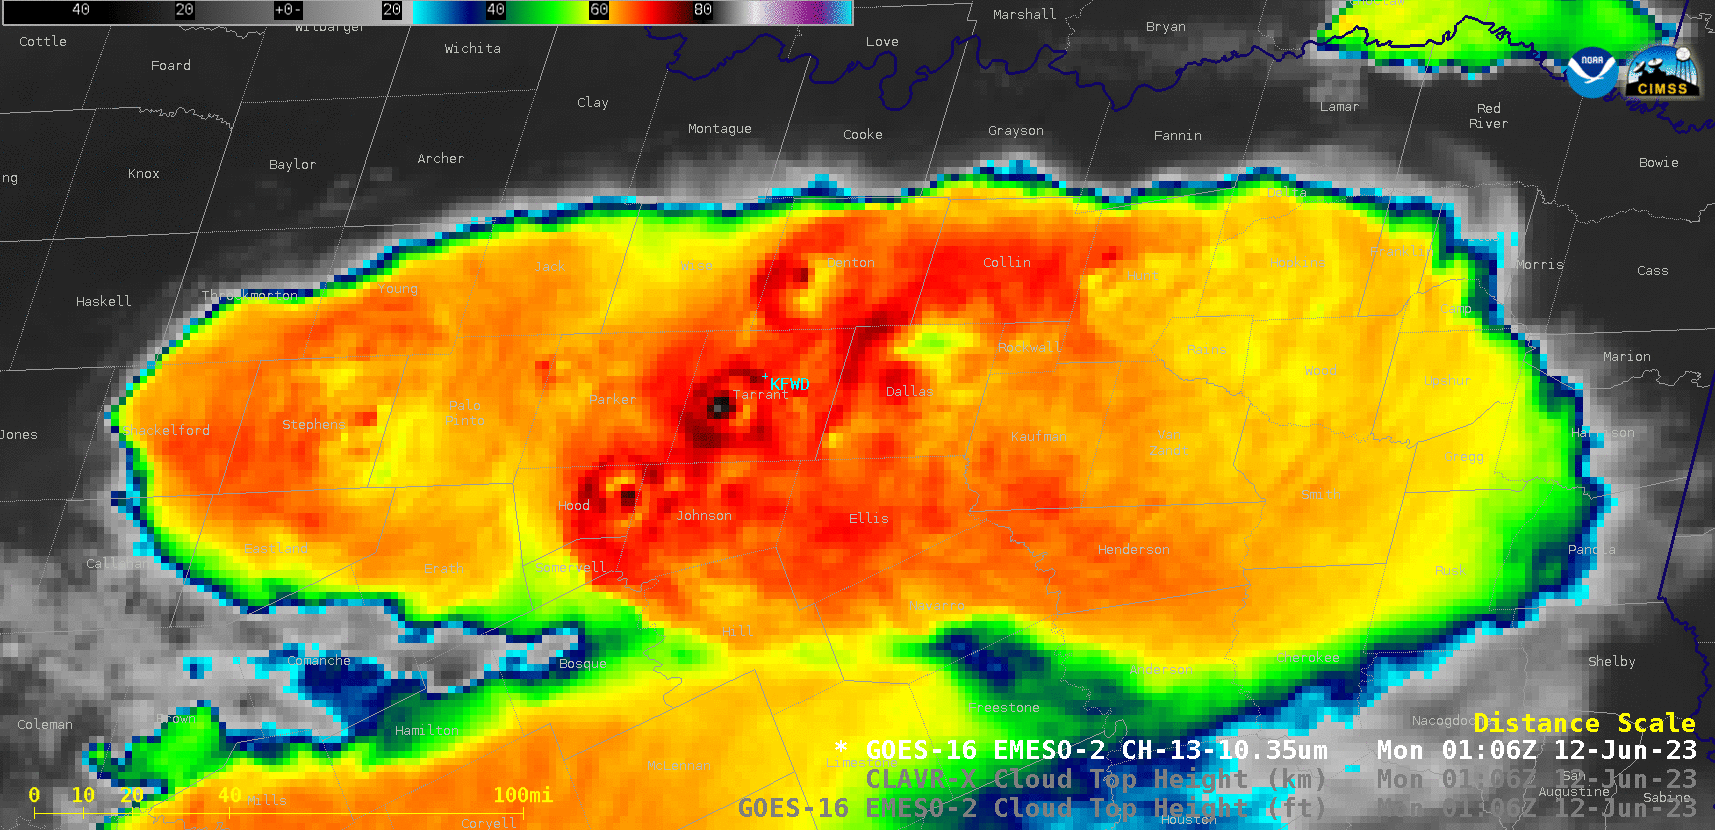
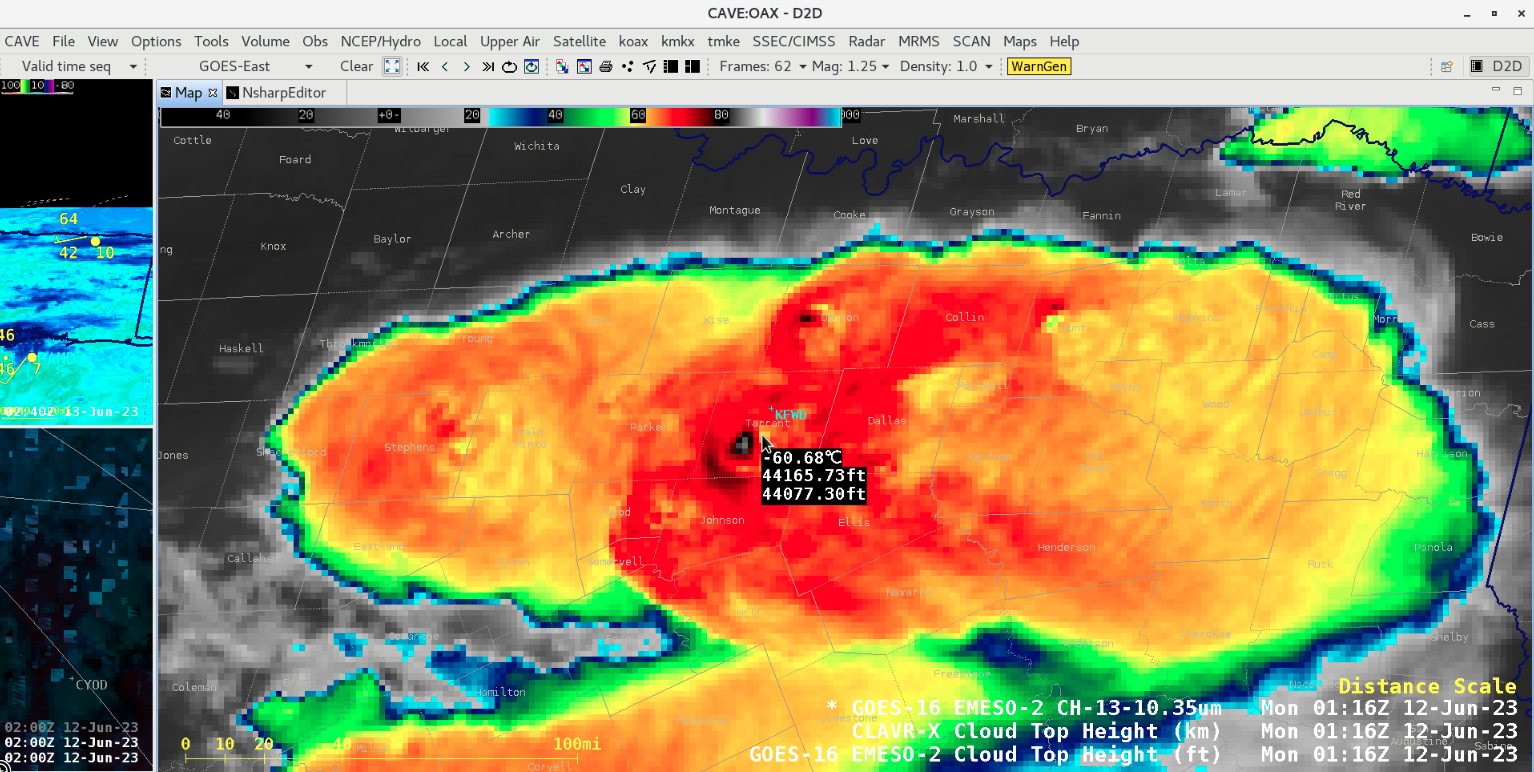
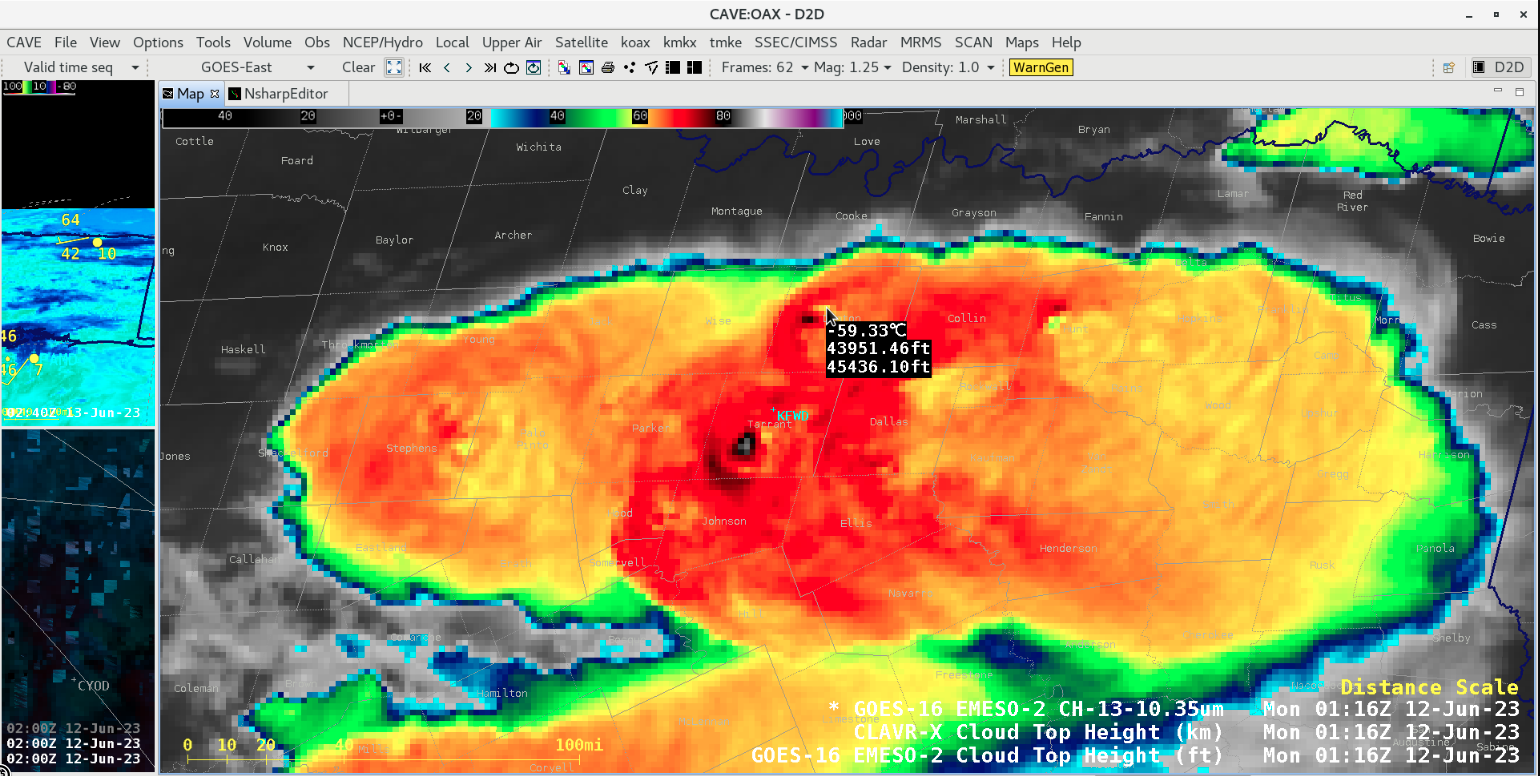
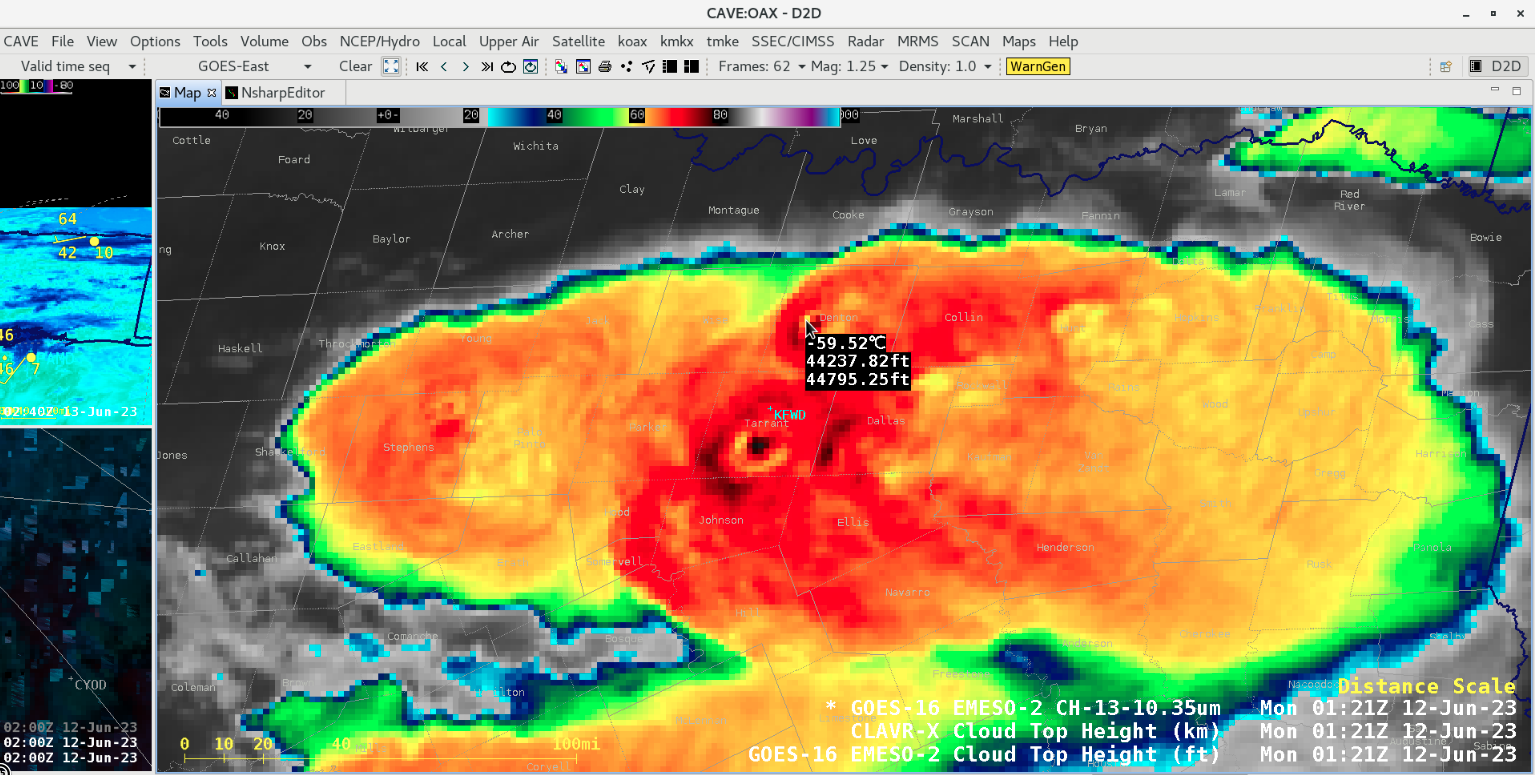
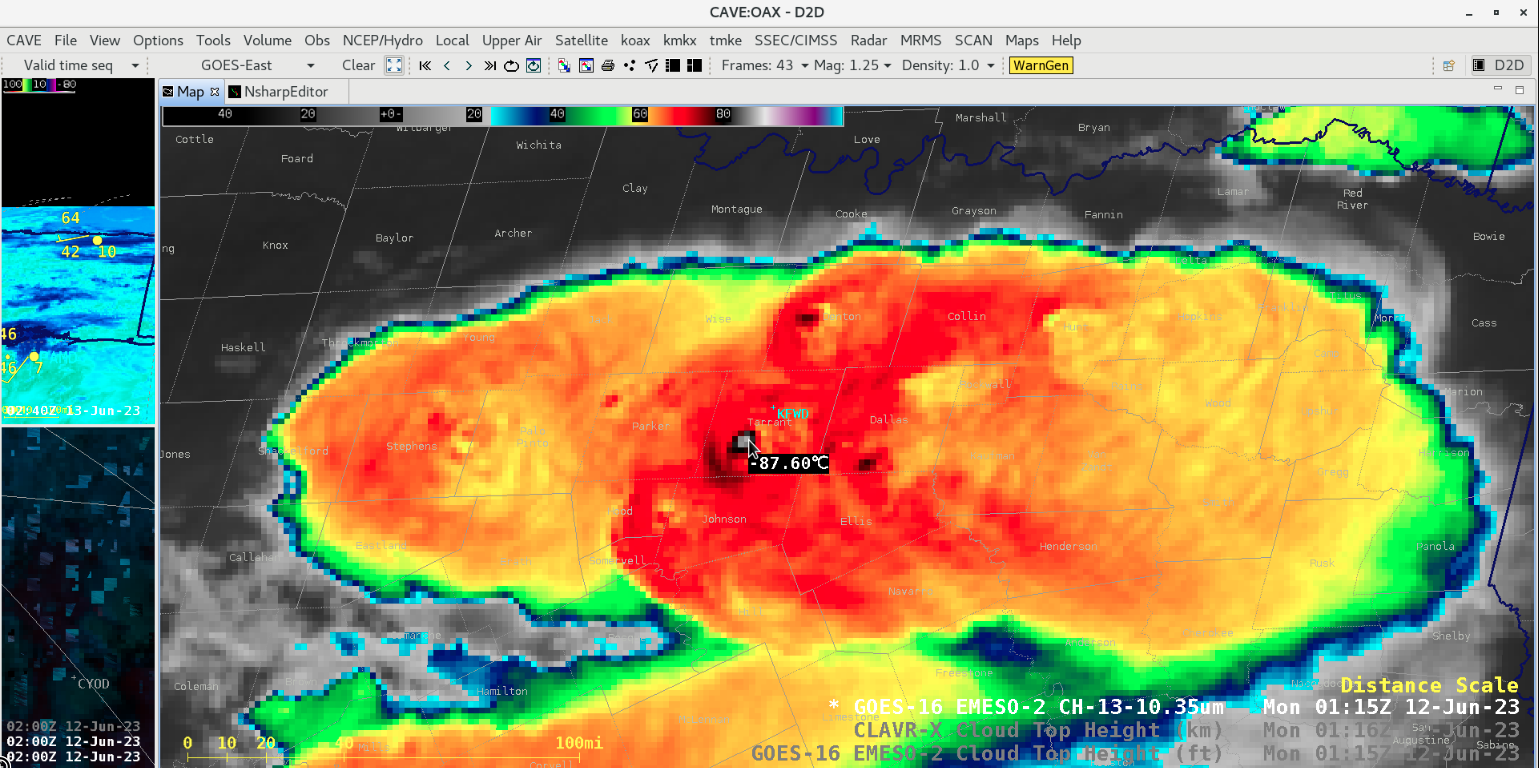
In a closer look at 1-minute GOES-16 Infrared images over the Dallas-Fort Worth, Texas area (rawinsonde site KFWD) from 0000-0200 UTC on 12 June (below), several overshooting top pulses became surrounded by brief “warm trench” signatures — a likely indication of compensating subsidence around the periphery of these vigorous updrafts as they rapidly ascended past the local equilibrium level and/or tropopause. The coldest overshooting top exhibited an infrared brightness temperature of -87.6ºC at 0115 UTC.
GOES-16 “Clean” Infrared Window (10.3 µm) images [click to play animated GIF | MP4]
GOES-16 “Clean” Infrared Window (10.3 µm), CLAVR-x Cloud Top Height and Operational Cloud Top Height at 0106 UTC [click to enlarge]
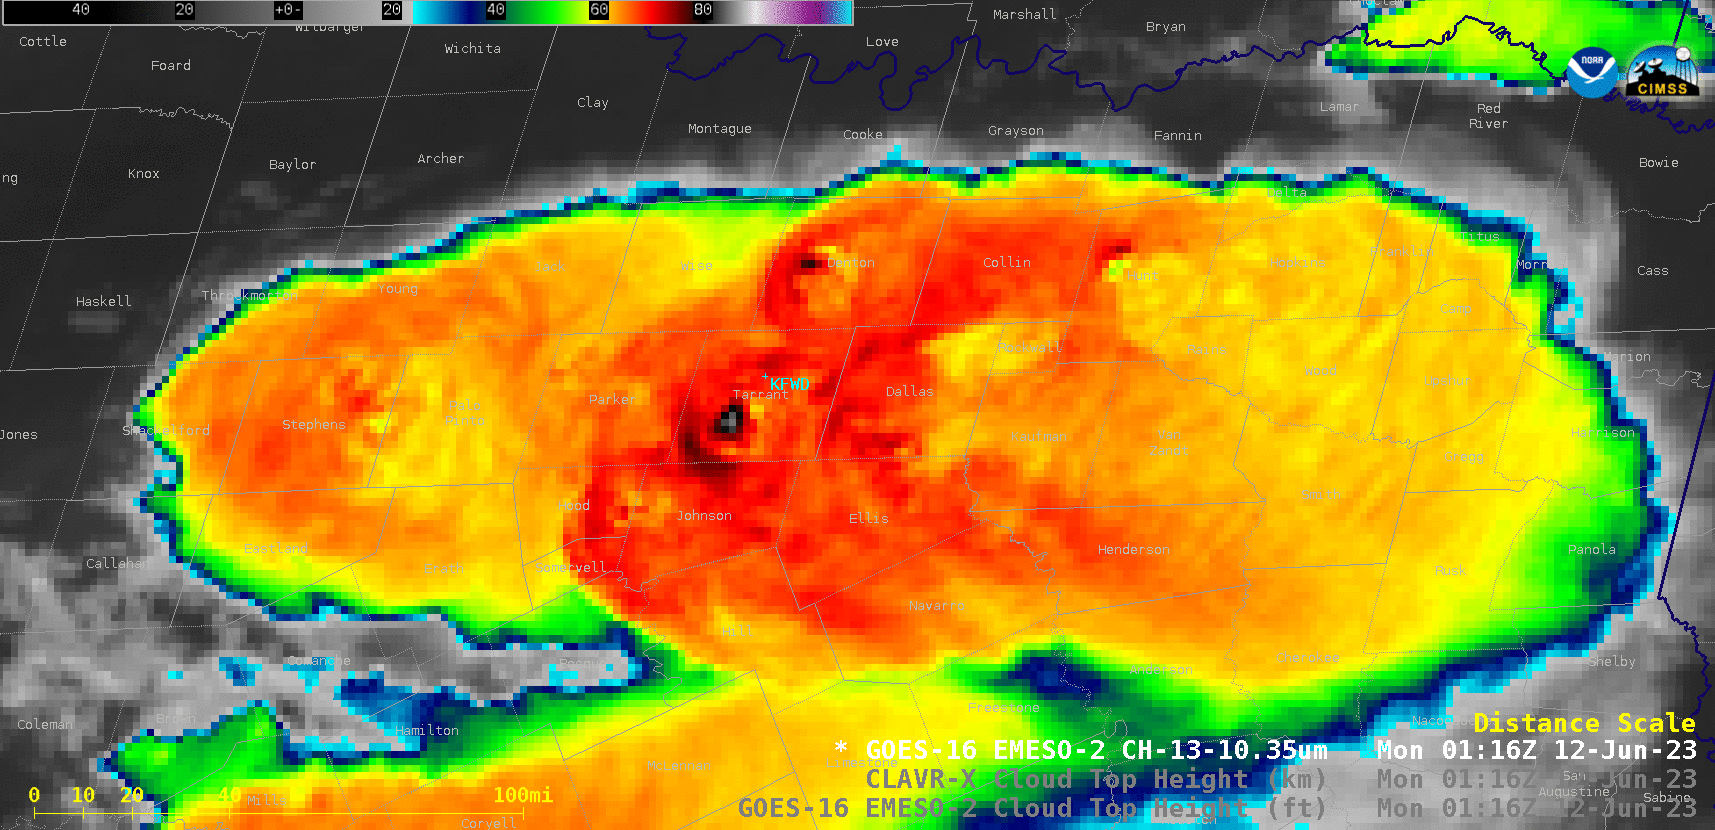
GOES-16 “Clean” Infrared Window (10.3 µm), CLAVR-x Cloud Top Height and Operational Cloud Top Height at 0116 UTC [click to enlarge]_
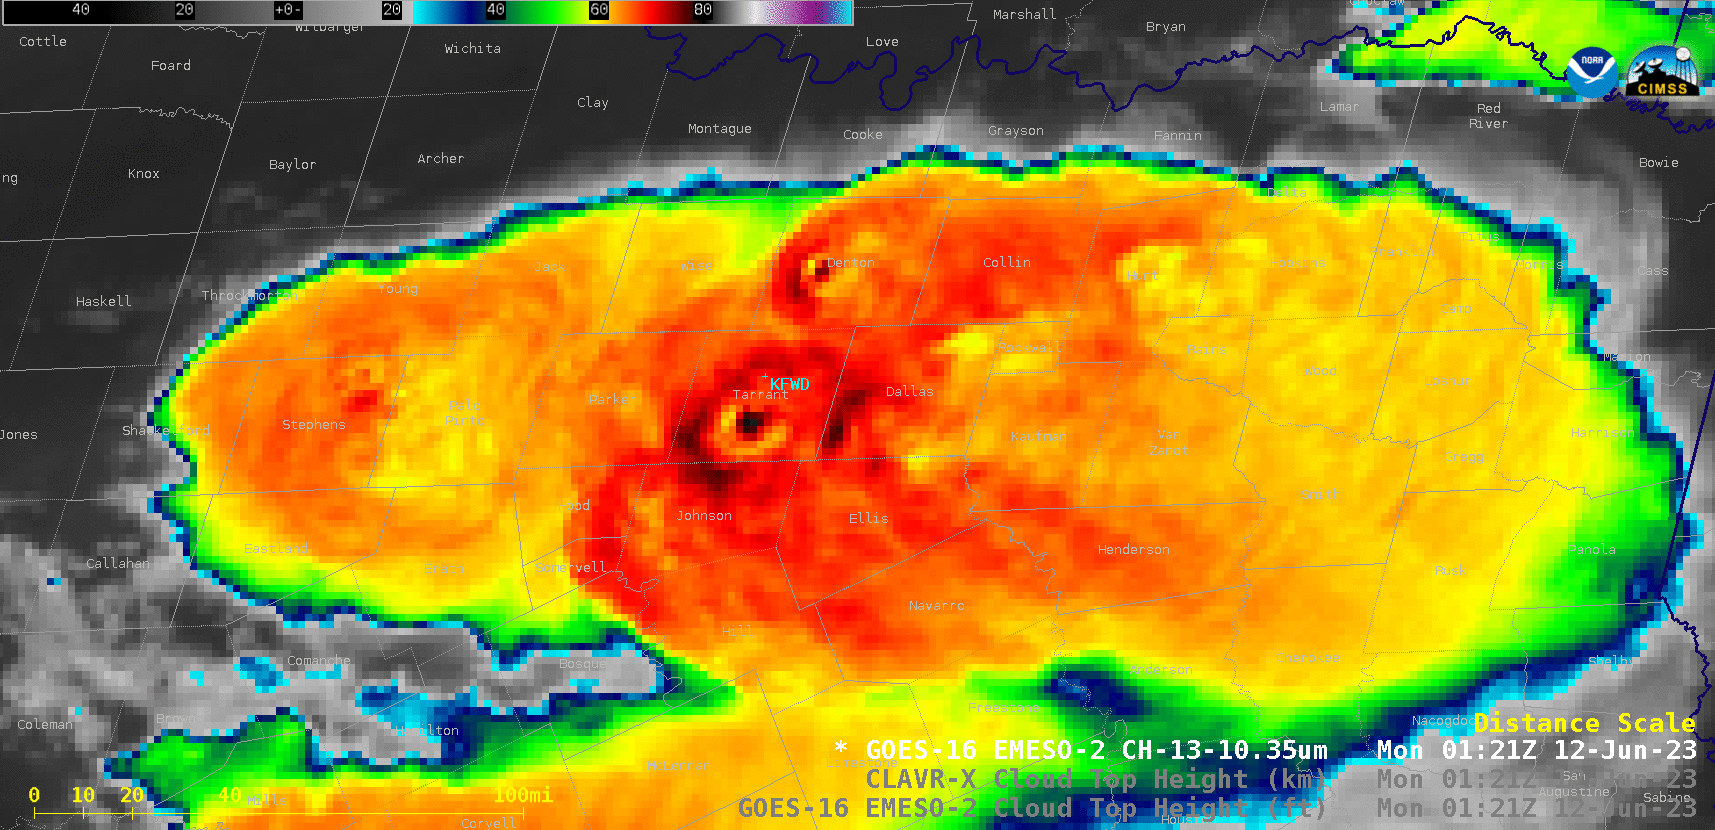
GOES-16 “Clean” Infrared Window (10.3 µm), CLAVR-x Cloud Top Height and Operational Cloud Top Height at 0121 UTC [click to enlarge]
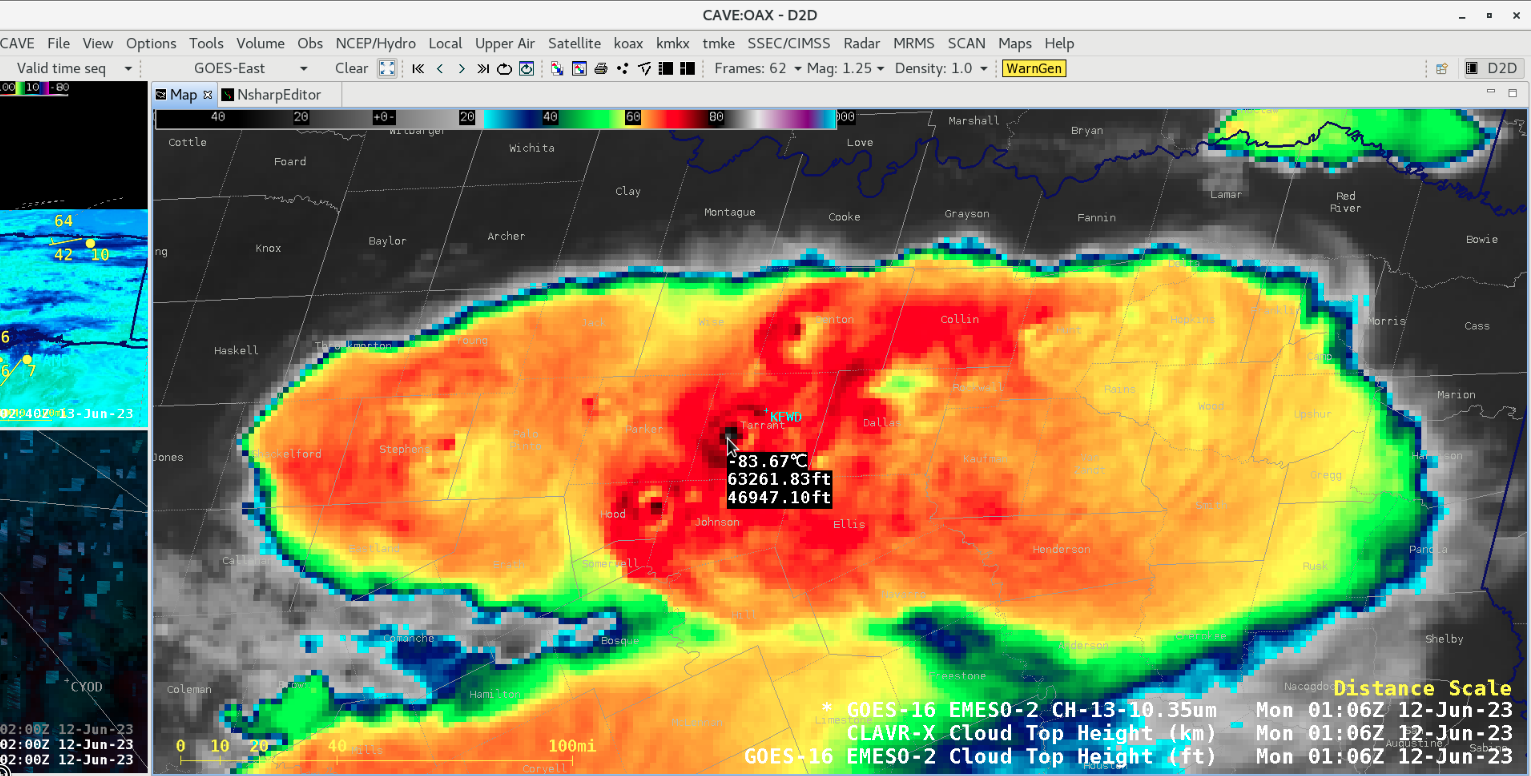
Cursor-sampled values of GOES-16 Infrared (10.3 µm) brightness temperature, CLAVR-x Cloud Top Height and Operational Cloud Top Height for an overshooting top over Tarrant County at 0106 UTC [click to enlarge]

Cursor-sampled values of GOES-16 Infrared (10.3 µm) brightness temperature, CLAVR-x Cloud Top Height and Operational Cloud Top Height for an overshooting top over Tarrant County at 0116 UTC [click to enlarge]
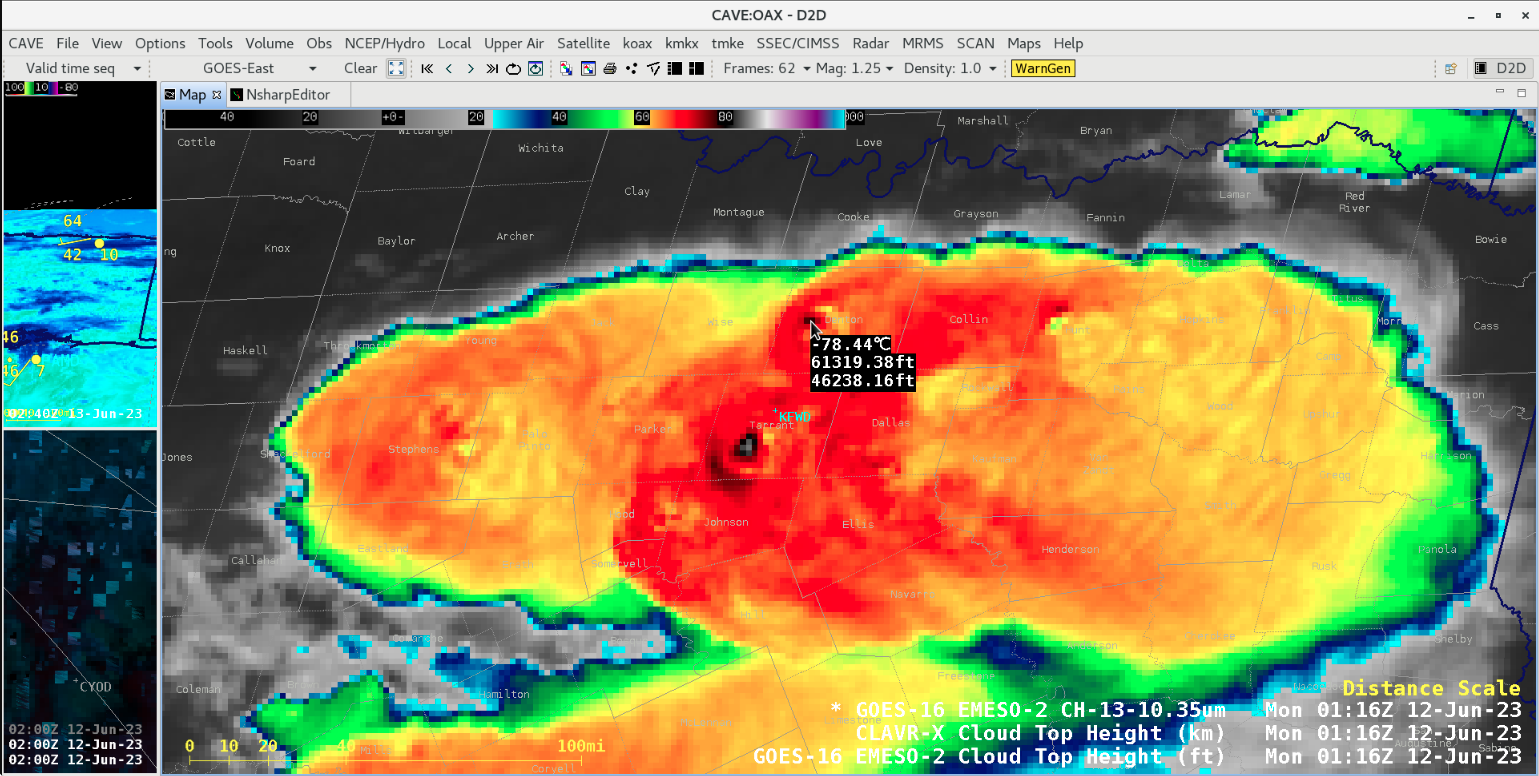
Cursor-sampled values of GOES-16 Infrared (10.3 µm) brightness temperature, CLAVR-x Cloud Top Height and Operational Cloud Top Height for an overshooting top over Denton County at 0116 UTC [click to enlarge]
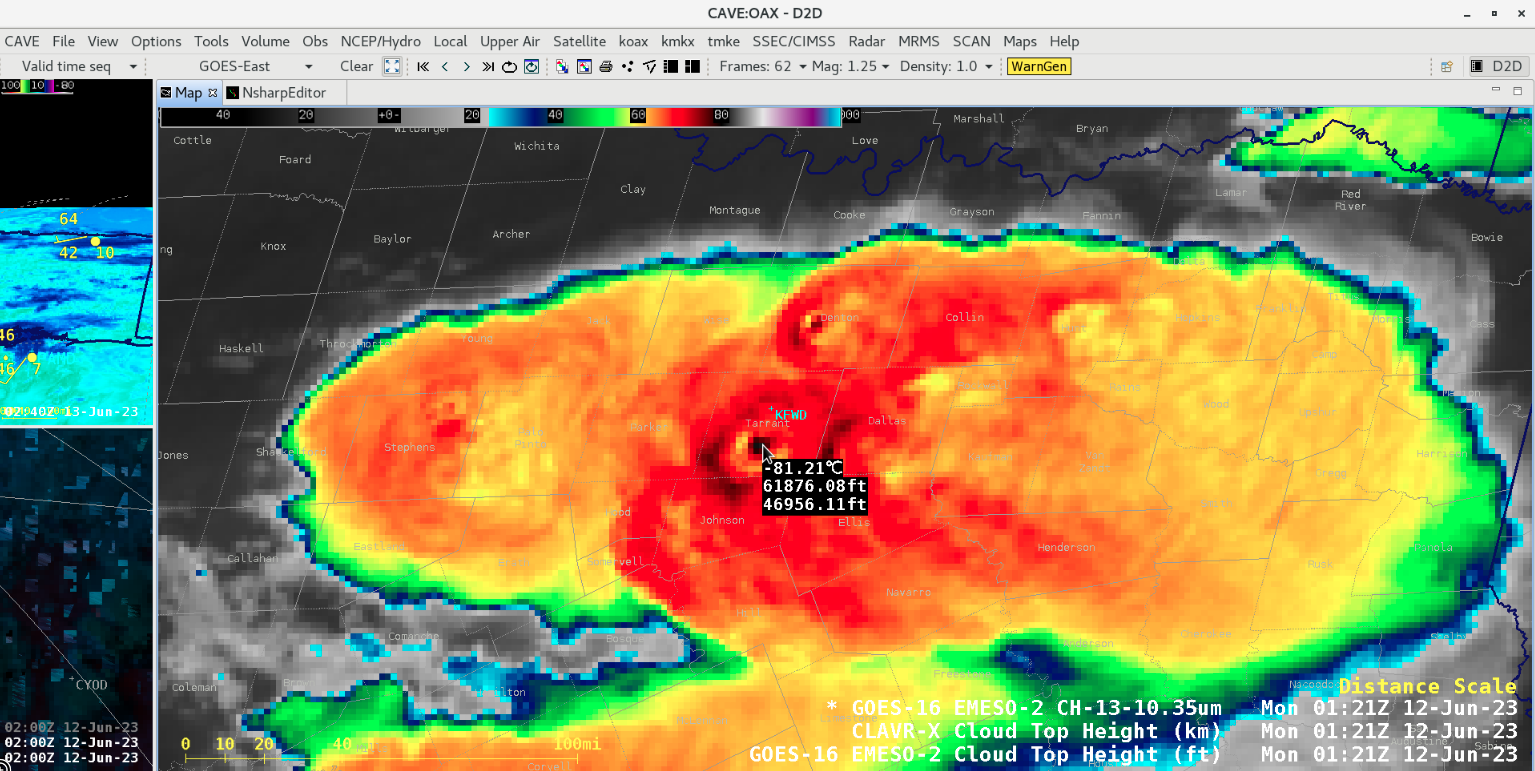
Cursor-sampled values of GOES-16 Infrared (10.3 µm) brightness temperature, CLAVR-x Cloud Top Height and Operational Cloud Top Height for an overshooting top over Tarrant County at 0121 UTC [click to enlarge]

Cursor-sampled values of GOES-16 Infrared (10.3 µm) brightness temperature, CLAVR-x Cloud Top Height and Operational Cloud Top Height for a warm trench feature over Tarrant County at 0106 UTC [click to enlarge]
Cursor-sampled values of GOES-16 Infrared (10.3 µm) brightness temperature, CLAVR-x Cloud Top Height and Operational Cloud Top Height for a warm trench feature over Tarrant County at 0116 UTC [click to enlarge]
Cursor-sampled values of GOES-16 Infrared (10.3 µm) brightness temperature, CLAVR-x Cloud Top Height and Operational Cloud Top Height for a warm trench feature over Denton County at 0116 UTC [click to enlarge]

Cursor-sampled values of GOES-16 Infrared (10.3 µm) brightness temperature, CLAVR-x Cloud Top Height and Operational Cloud Top Height for a warm trench feature over Tarrant County at 0121 UTC [click to enlarge]
Cursor-sampled values of GOES-16 Infrared (10.3 µm) brightness temperature, CLAVR-x Cloud Top Height and Operational Cloud Top Height for a warm trench feature over Denton County at 0121 UTC [click to enlarge]
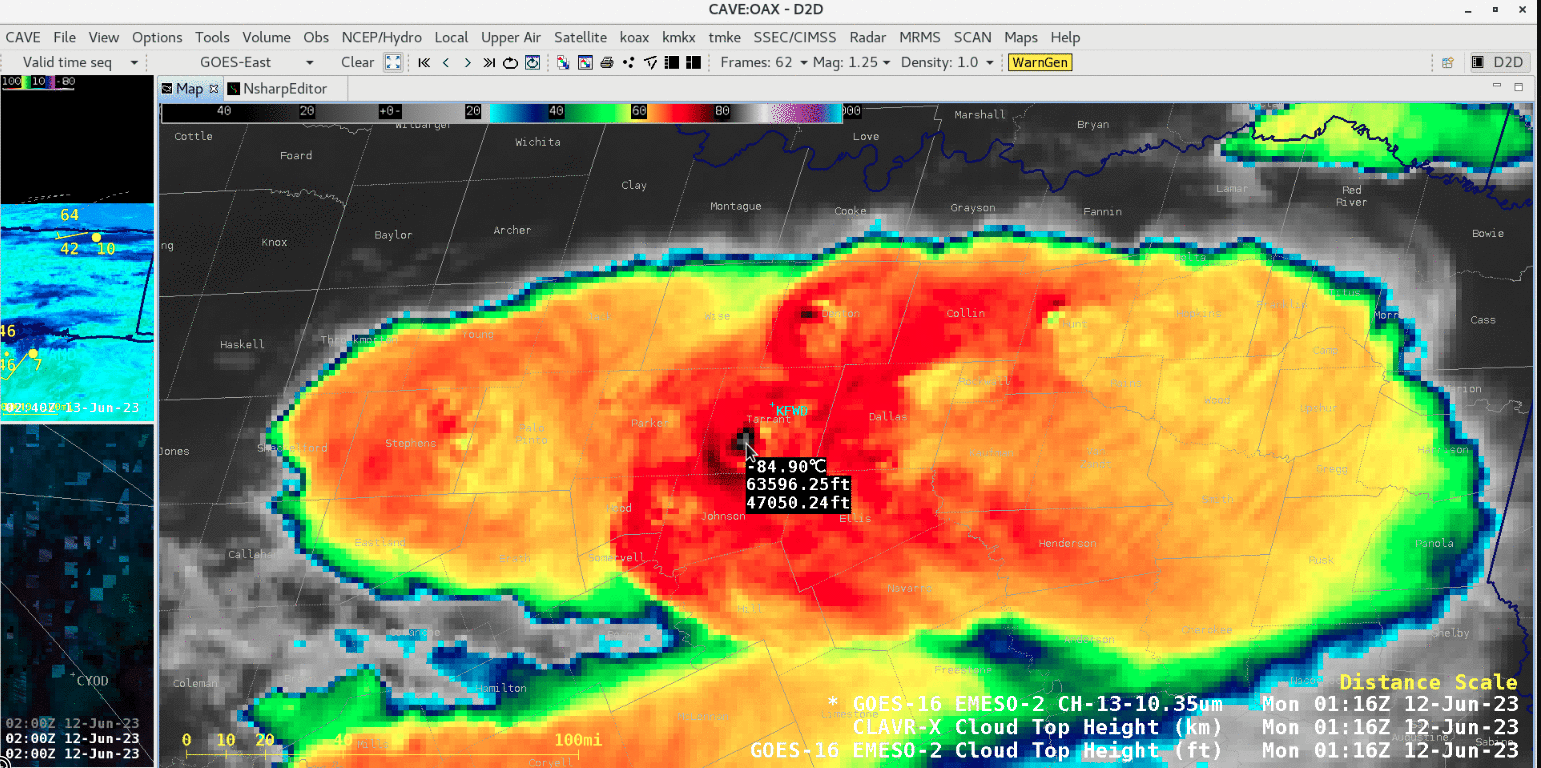
Cursor-sampled values of Cloud Top Height for the storm over Tarrant County at 0116 UTC [click to enlarge]
View only this post Read Less
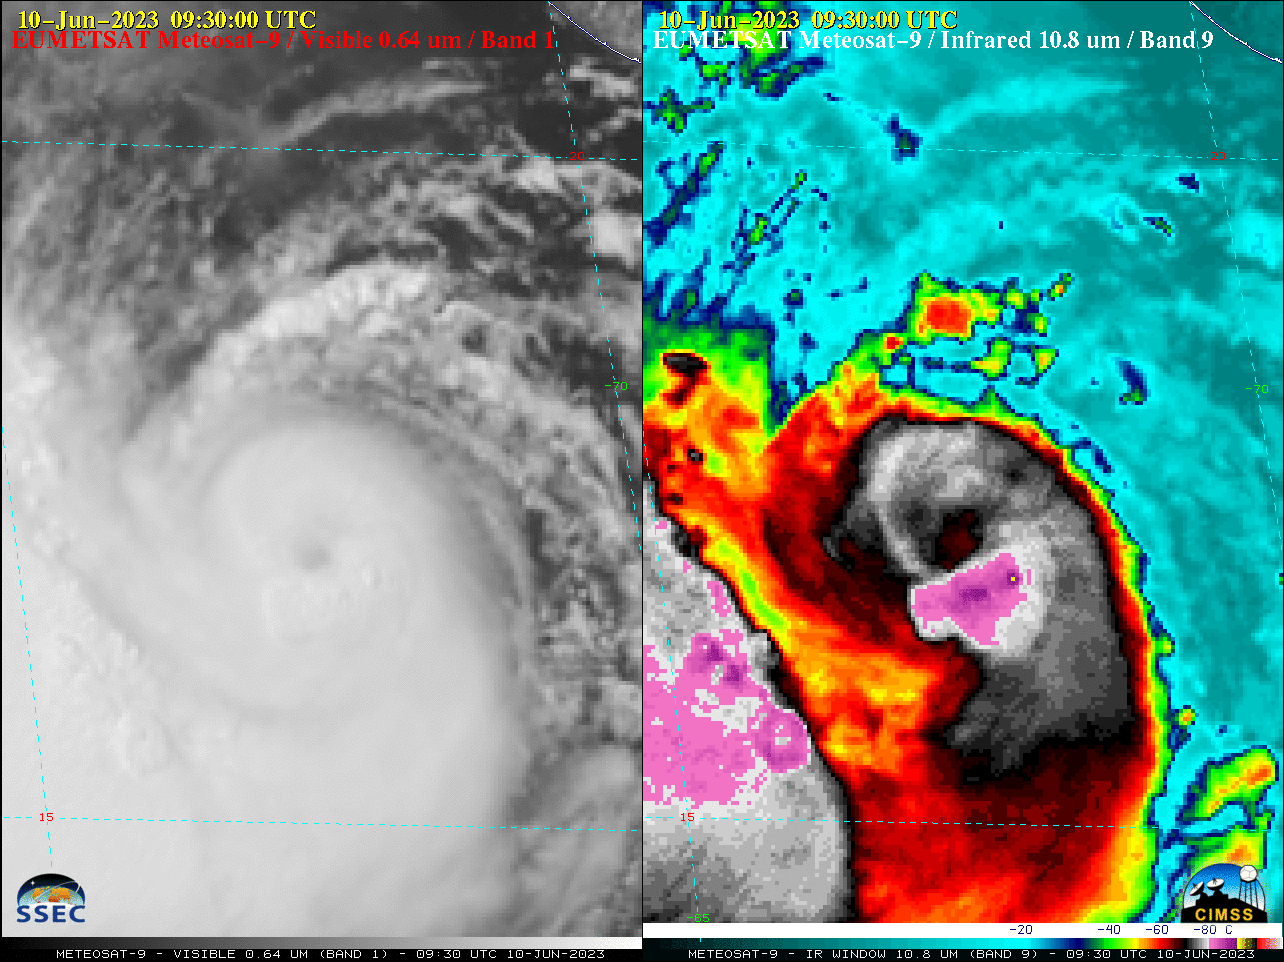
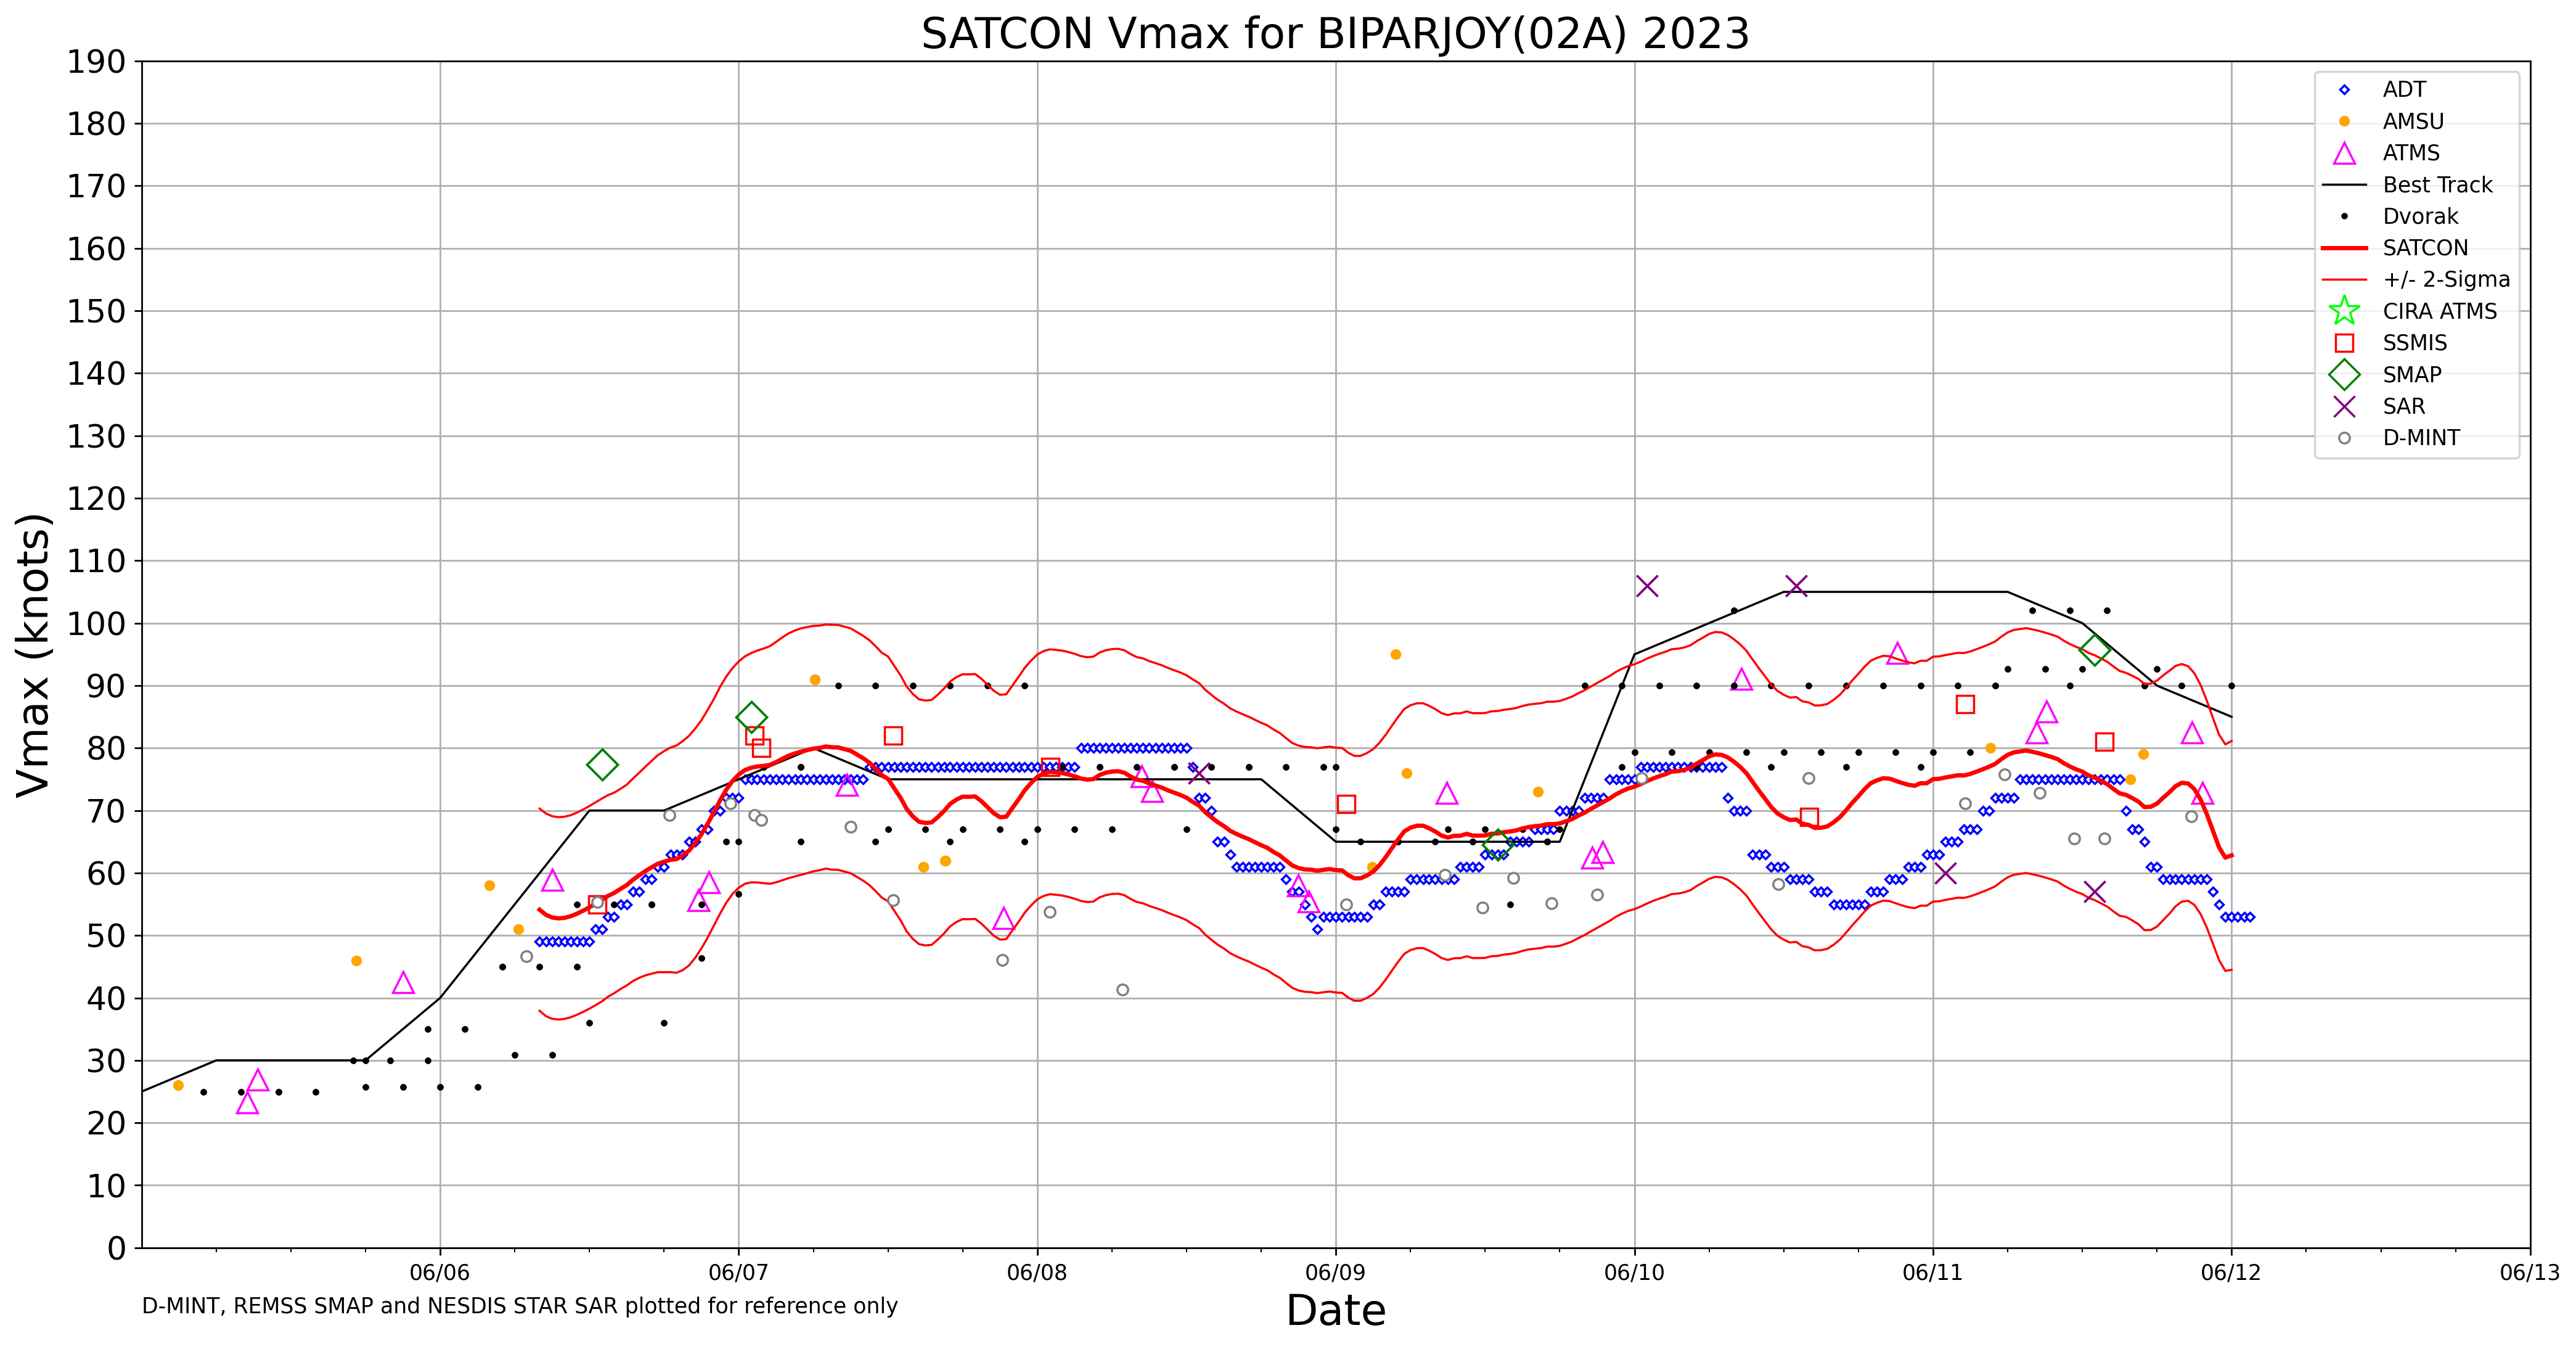
Cyclone Biparjoy in the Arabian Sea began a period of rapid intensification late in the day on 09 June 2023, reaching Category 3 intensity by 12 UTC on 10 June (SATCON) — EUMETSAT Meteosat-9 Visible (0.64 µm) and Infrared Window (10.8 µm) images (above) showed Biparjoy during the 0100-1330 UTC... Read More
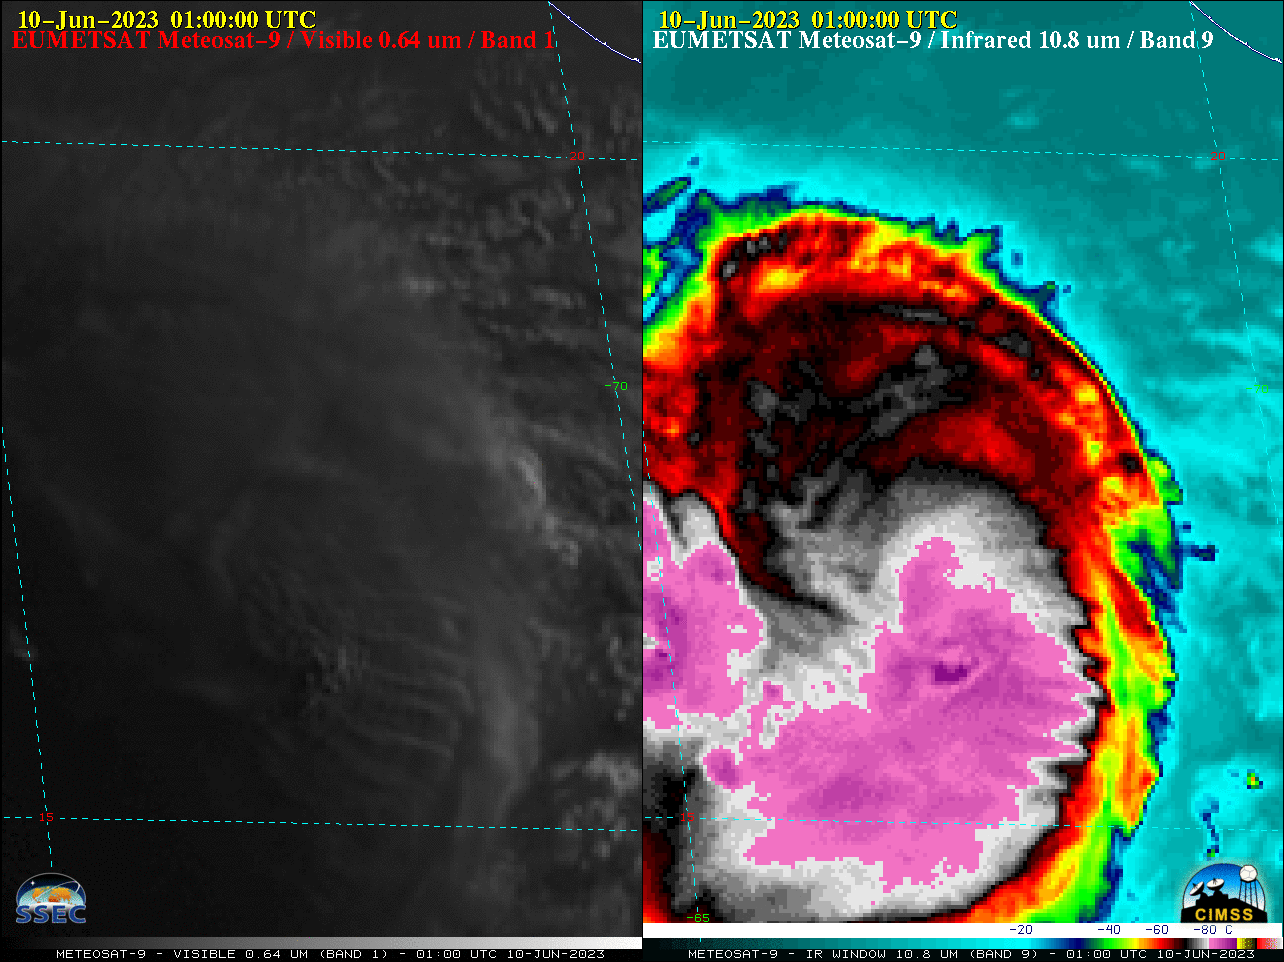
EUMETSAT Meteosat-9 Visible (0.64 µm, left) and Infrared Window (10.8 µm, right) images, 0100-1330 UTC on 10 June [click to play animated GIF | MP4]
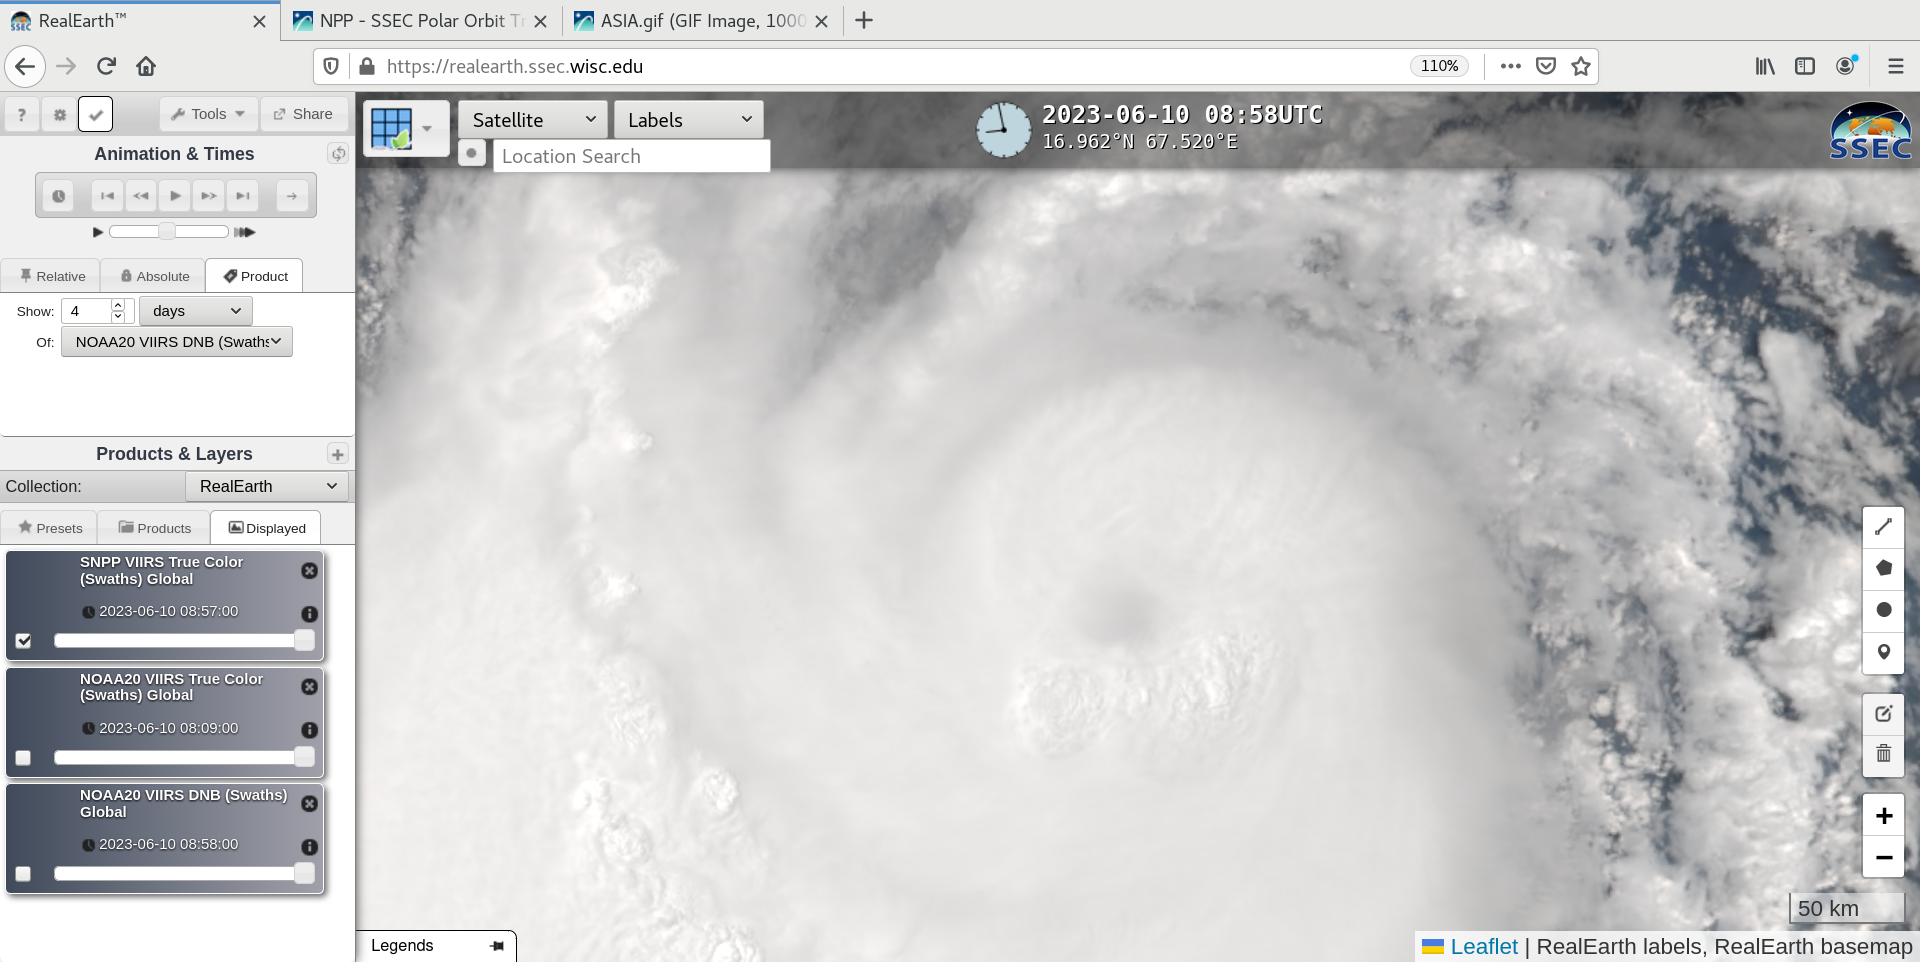
Suomi-NPP VIIRS True Color RGB image, valid at 0747 UTC on 10 June [click to enlarge]
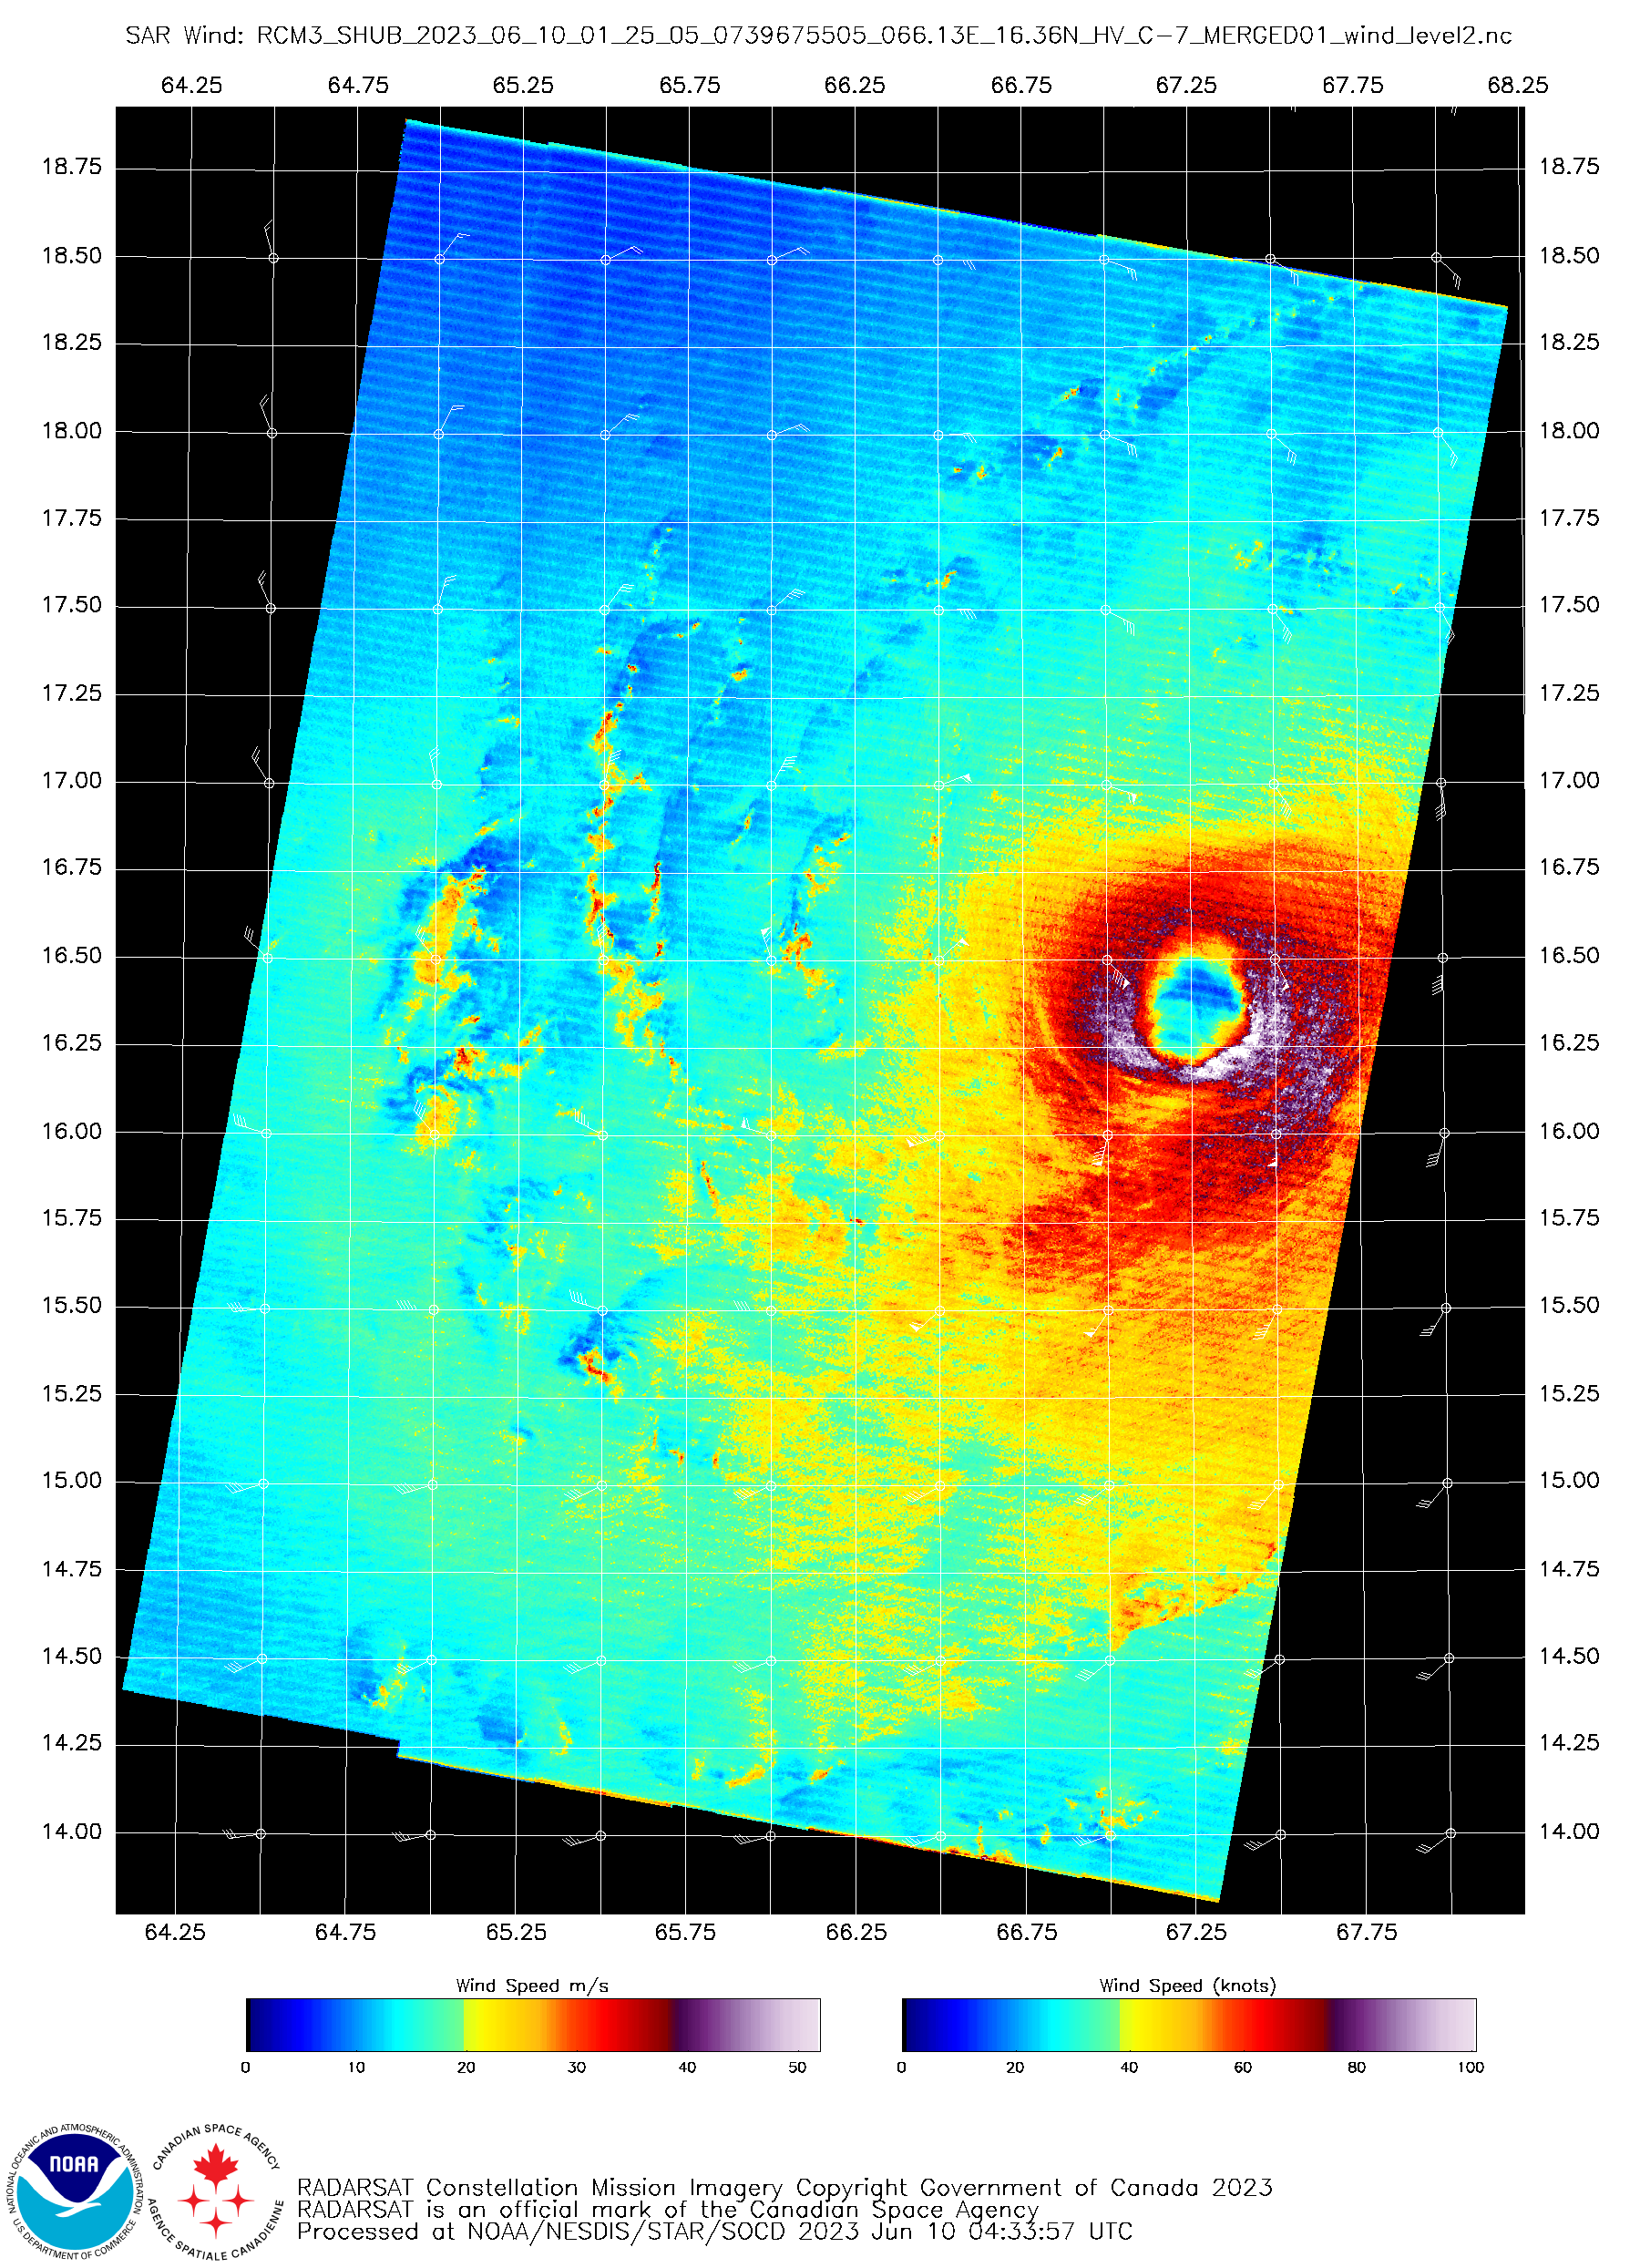
RCM-3 Synthetic Aperture Radar image at 0125 UTC on 10 June [click to enlarge]
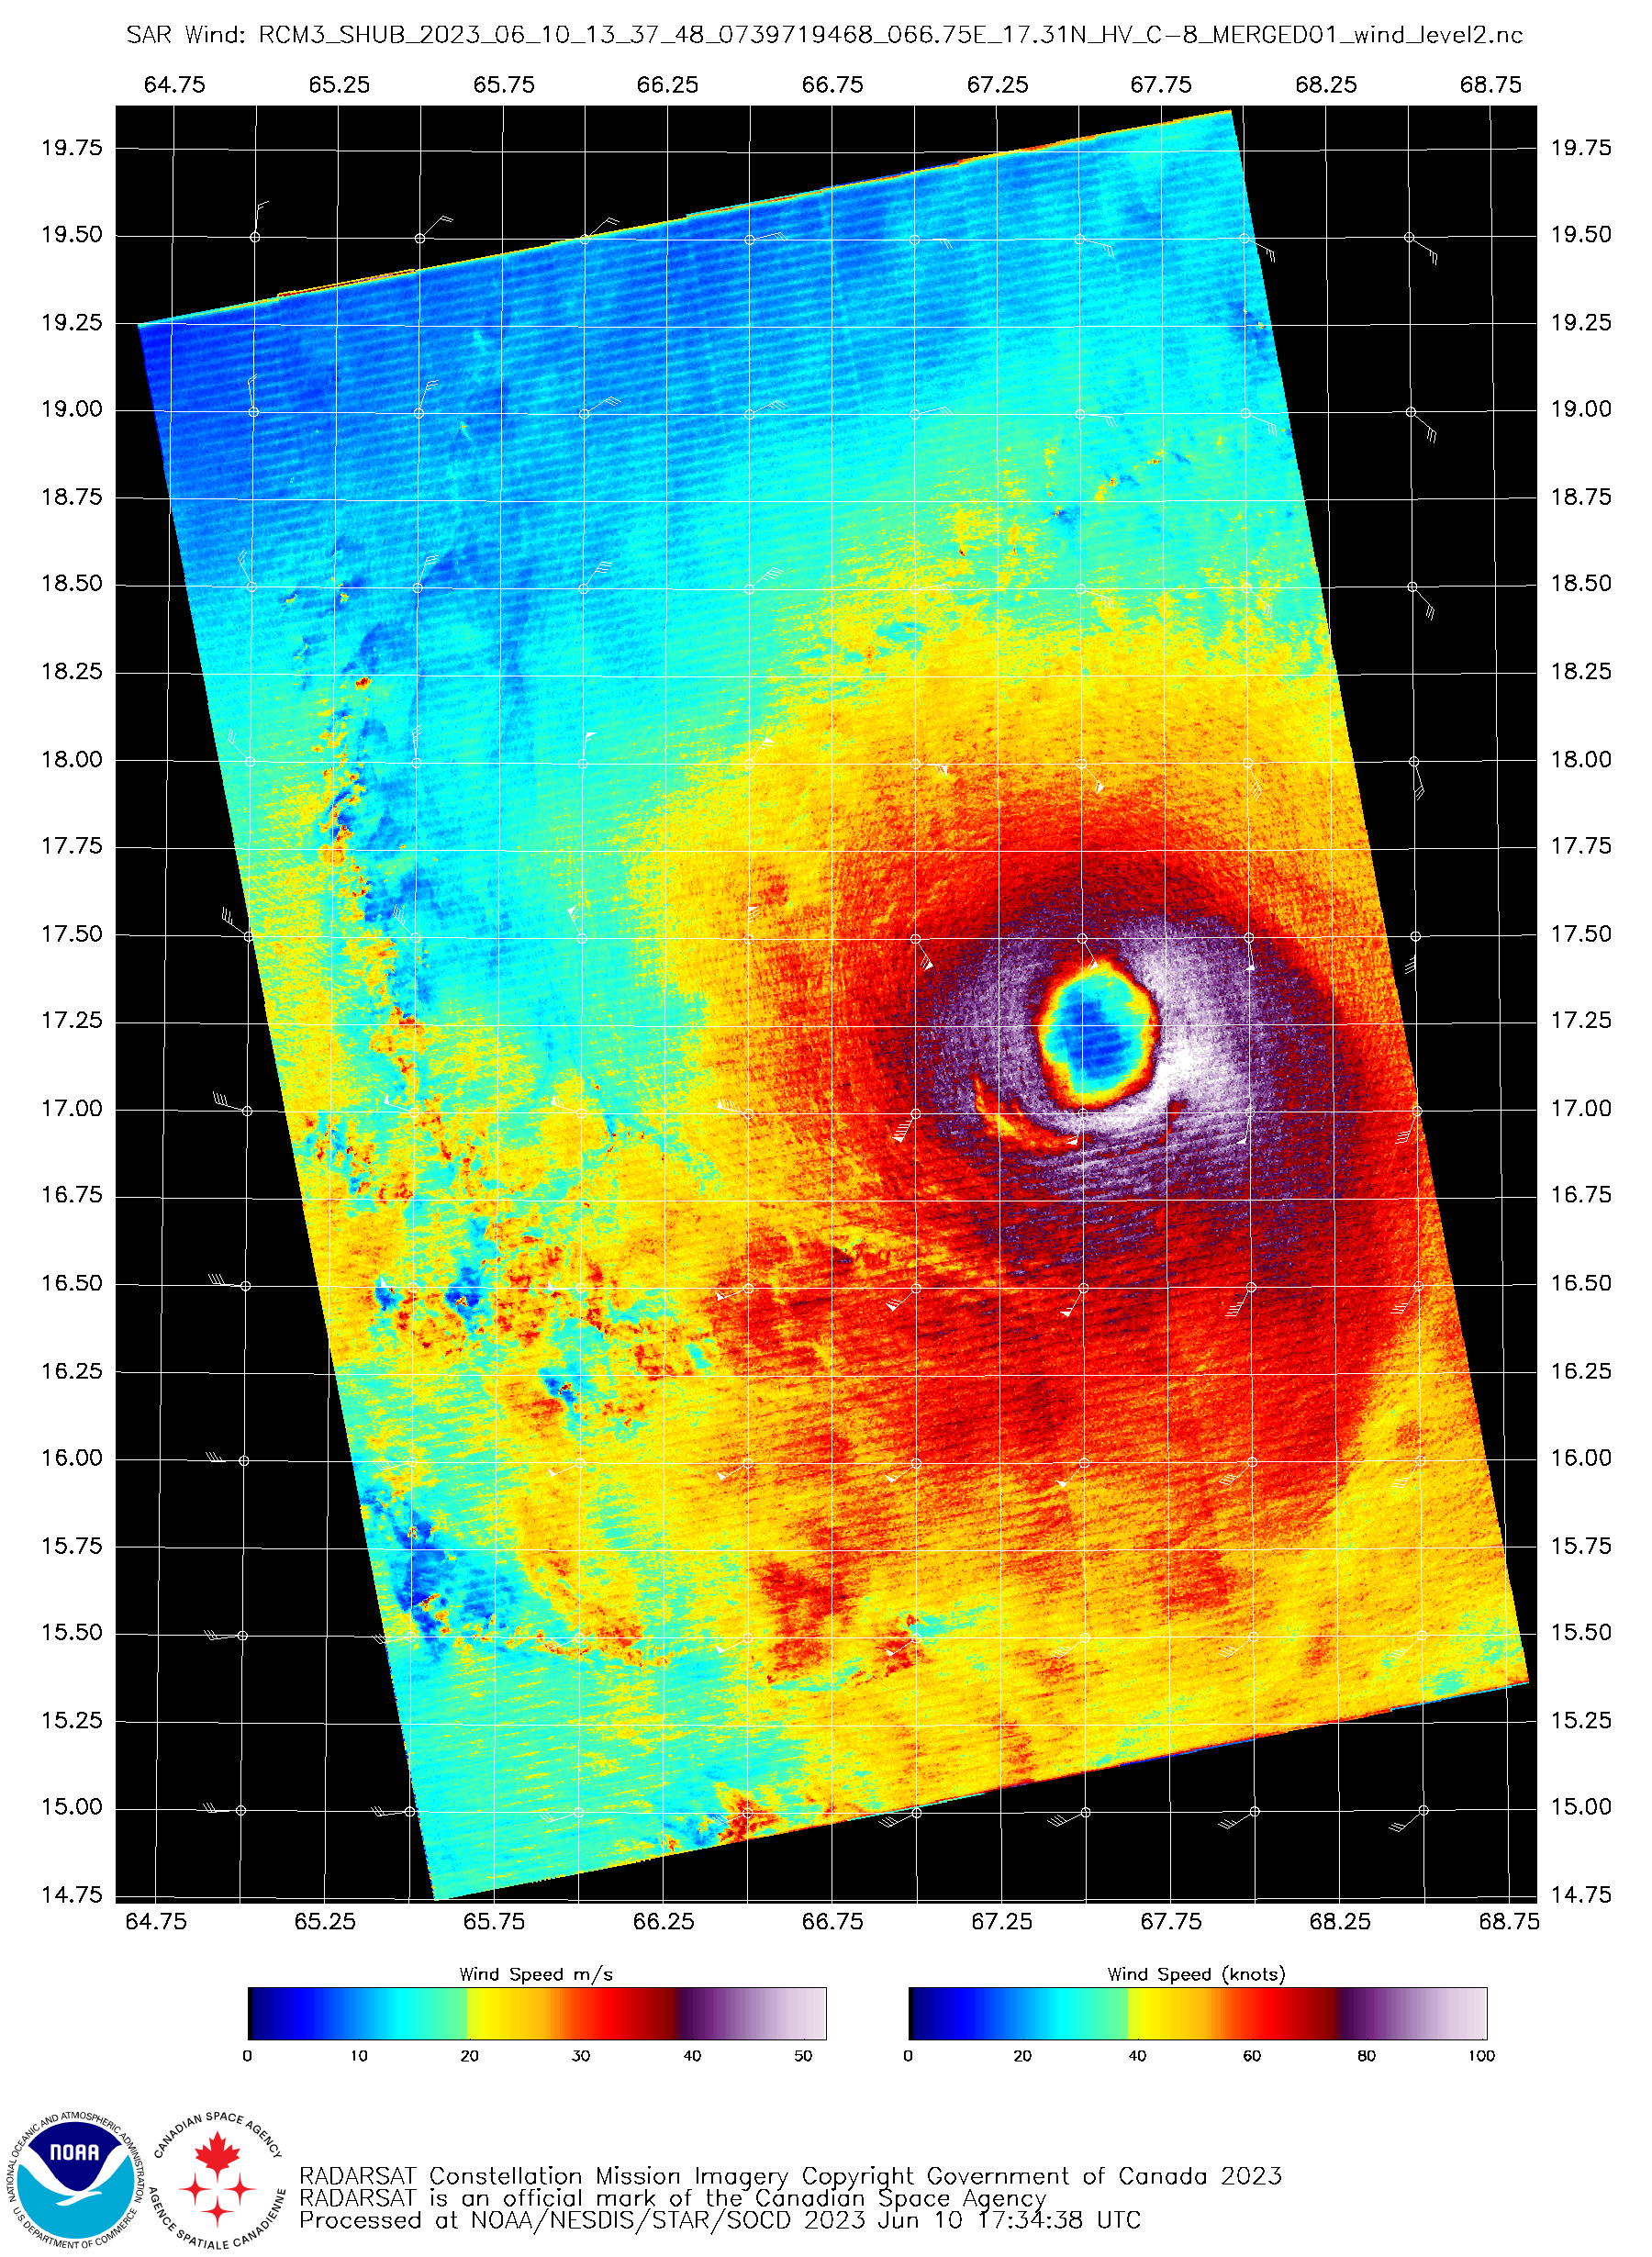
RCM-3 Synthetic Aperture Radar image at 1337 UTC on 10 June [click to enlarge]
View only this post Read Less
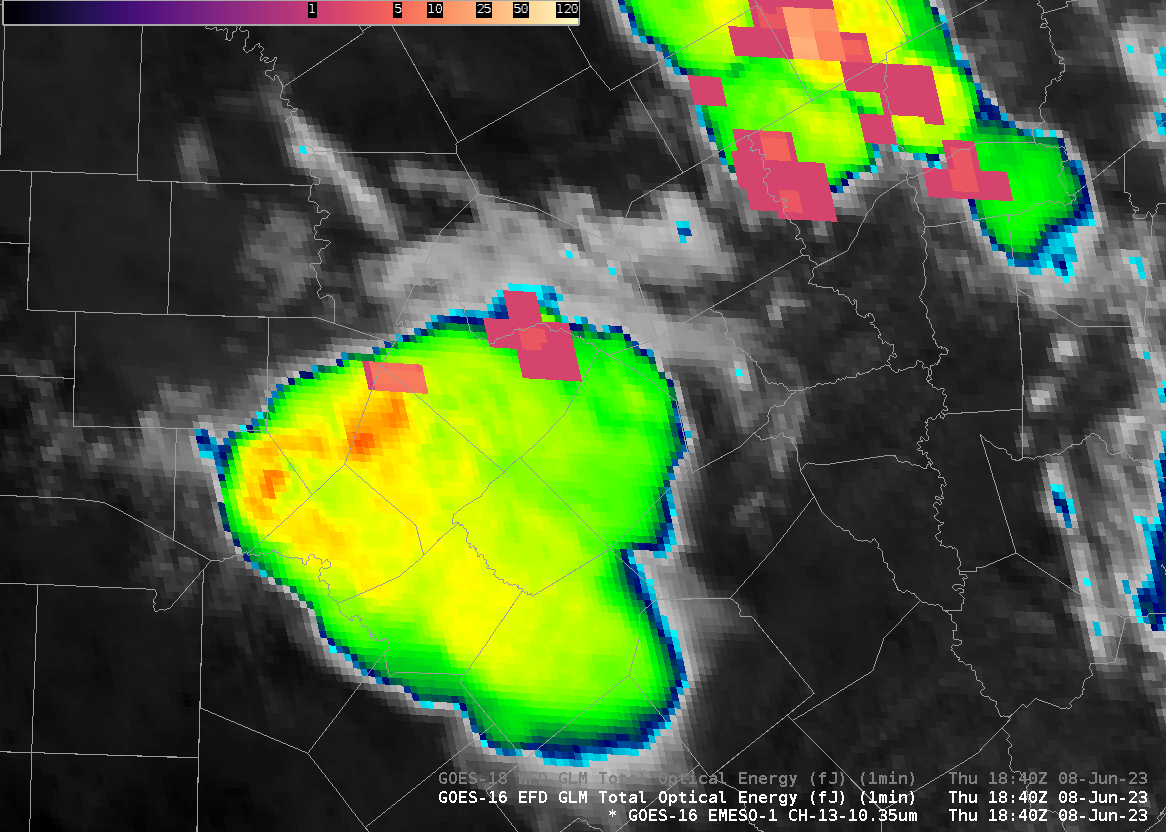
The animation above shows a strong convective system between Austin and San Antonio moving southeastward on 8 June 2023 . SPC storm reports note that this complex dropped hail in Bulverde (in Comal County, 13 miles northeast of San Antonio) around 1900 UTC, and in various locations in Bexar County (of which... Read More
The animation above shows a strong convective system between Austin and San Antonio moving southeastward on 8 June 2023 . SPC storm reports note that this complex dropped hail in Bulverde (in Comal County, 13 miles northeast of San Antonio) around 1900 UTC, and in various locations in Bexar County (of which San Antonio is the county seat) between 1900 and 1930 UTC). Why are GLM observations of Flash Extent Density sparse in this severe storm with obvious overshooting tops and a warm trench?
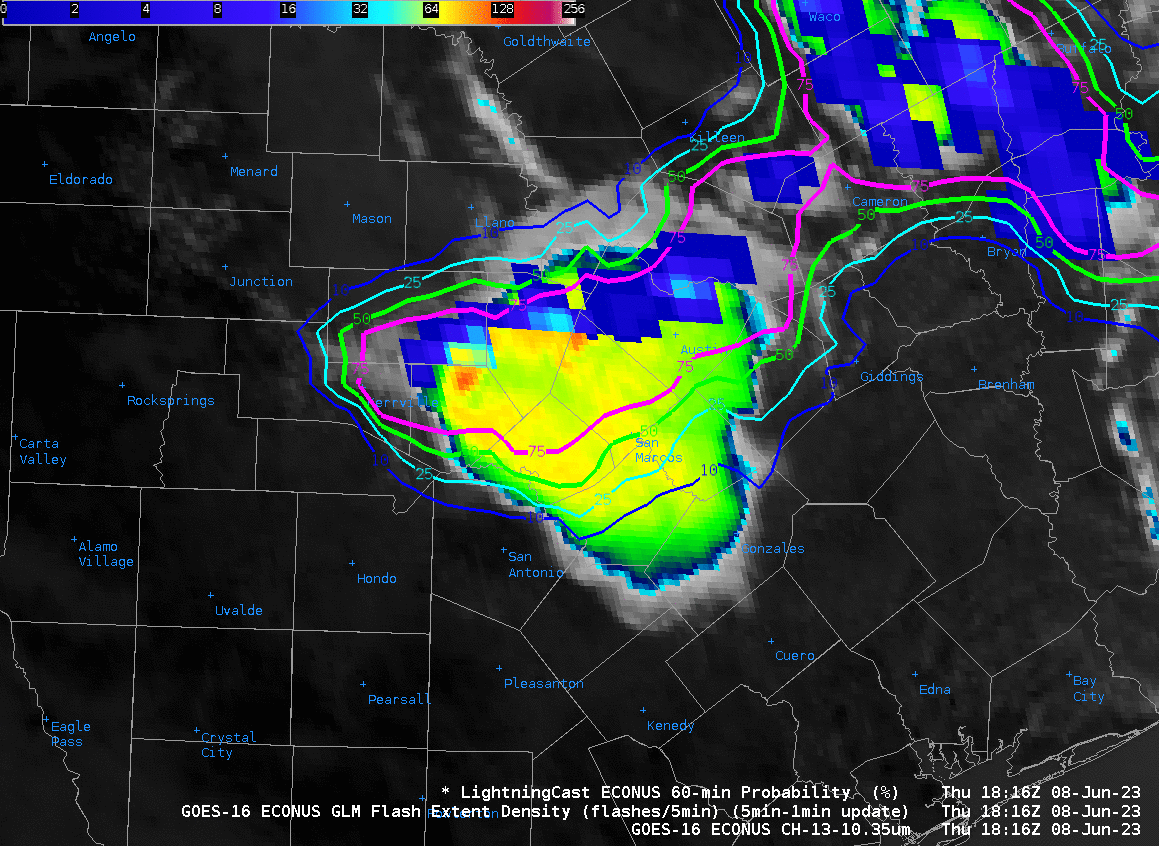
GLM observations are clustered on the trailing edge of the system at the beginning of the animation. It’s likely that optical detection of lightning flashes is being inhibited by the thickness of the cloud (and suspended hydrometeors) in this case. GLM observations of Total Optical Energy (in this case with a 1-minute sampling) at 1840 UTC, below, from GOES-16 shows very little activity in this convective complex. Compare that to GOES-18 observations of the GLM TOE at the same time, at bottom (click here for a toggle)!
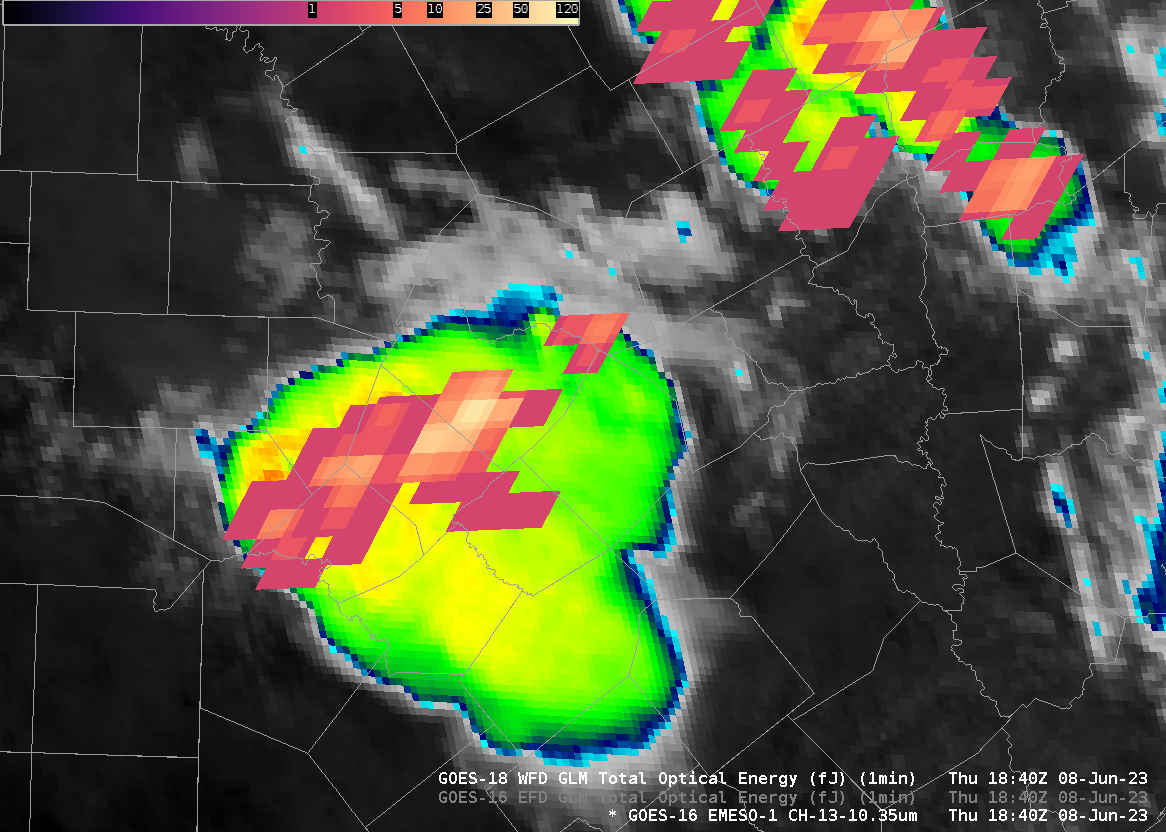
When using the GLM, remember that it is detecting an optical signal of lightning. Consider what might lie between the lightning emissions and the satellite. For this case, absorption by thick cloud, rain and perhaps suspended hail was preventing the optical signal from reaching GOES-16 (over the Equator at 75.2o W, to the east of the storm). GOES-West (over the Equator at 137o W) had a view of the lightning from the west that was less affected by the thick cloud and whatever was inside it.
Thanks to John Cintineo, CIMSS, and Kevin Thiel, SPC for alerting me to this event during the Hazardous Weather Testbed. Blog posts created by NWS forecasters that discuss HWT demonstration products can be found here.
Added, 11 July 2023: GLM Engineers have determined that the GOES-16 GLM did detect flashes during this event in the region where GOES-18 also detected flashes. However, a blooming filter in the GLM processing screened out the signal (erroneously). The blooming filter activates when the BGMSB (background most significant bits) that is related to background brightness increases too quickly. That can happen during explosive development.
View only this post Read Less
