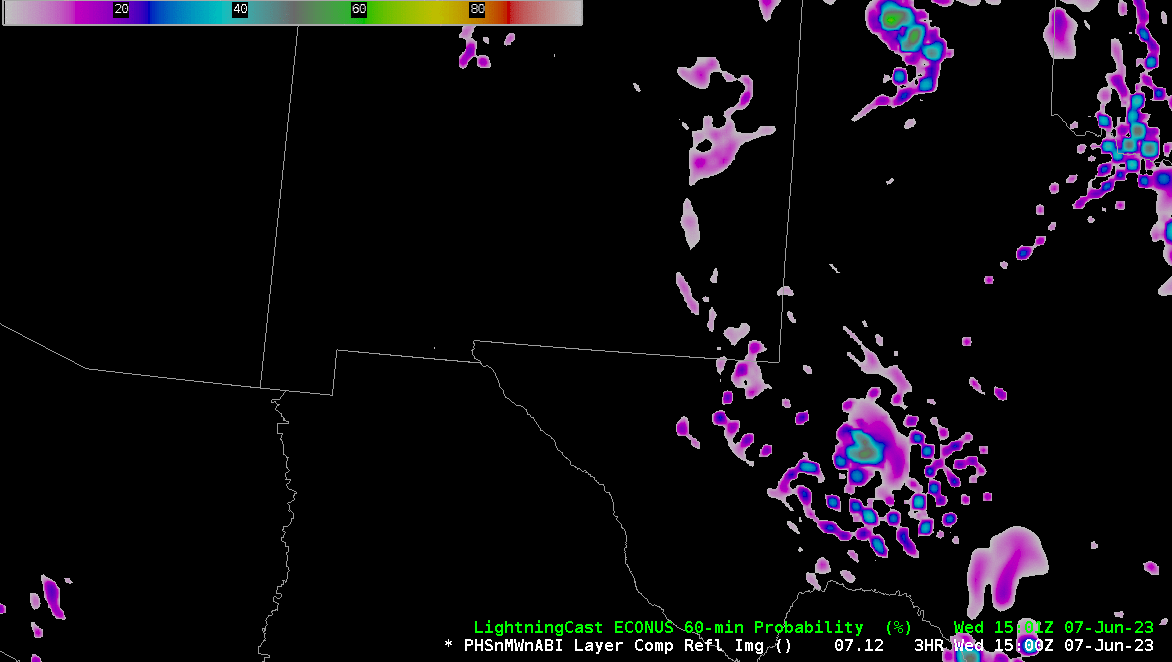
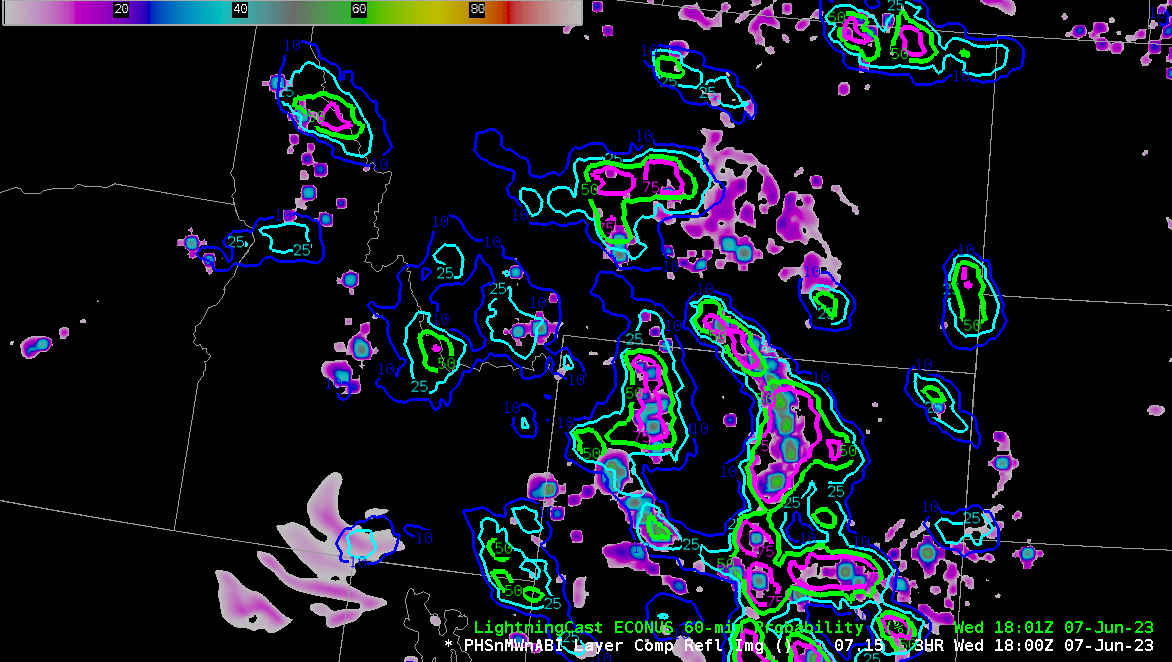
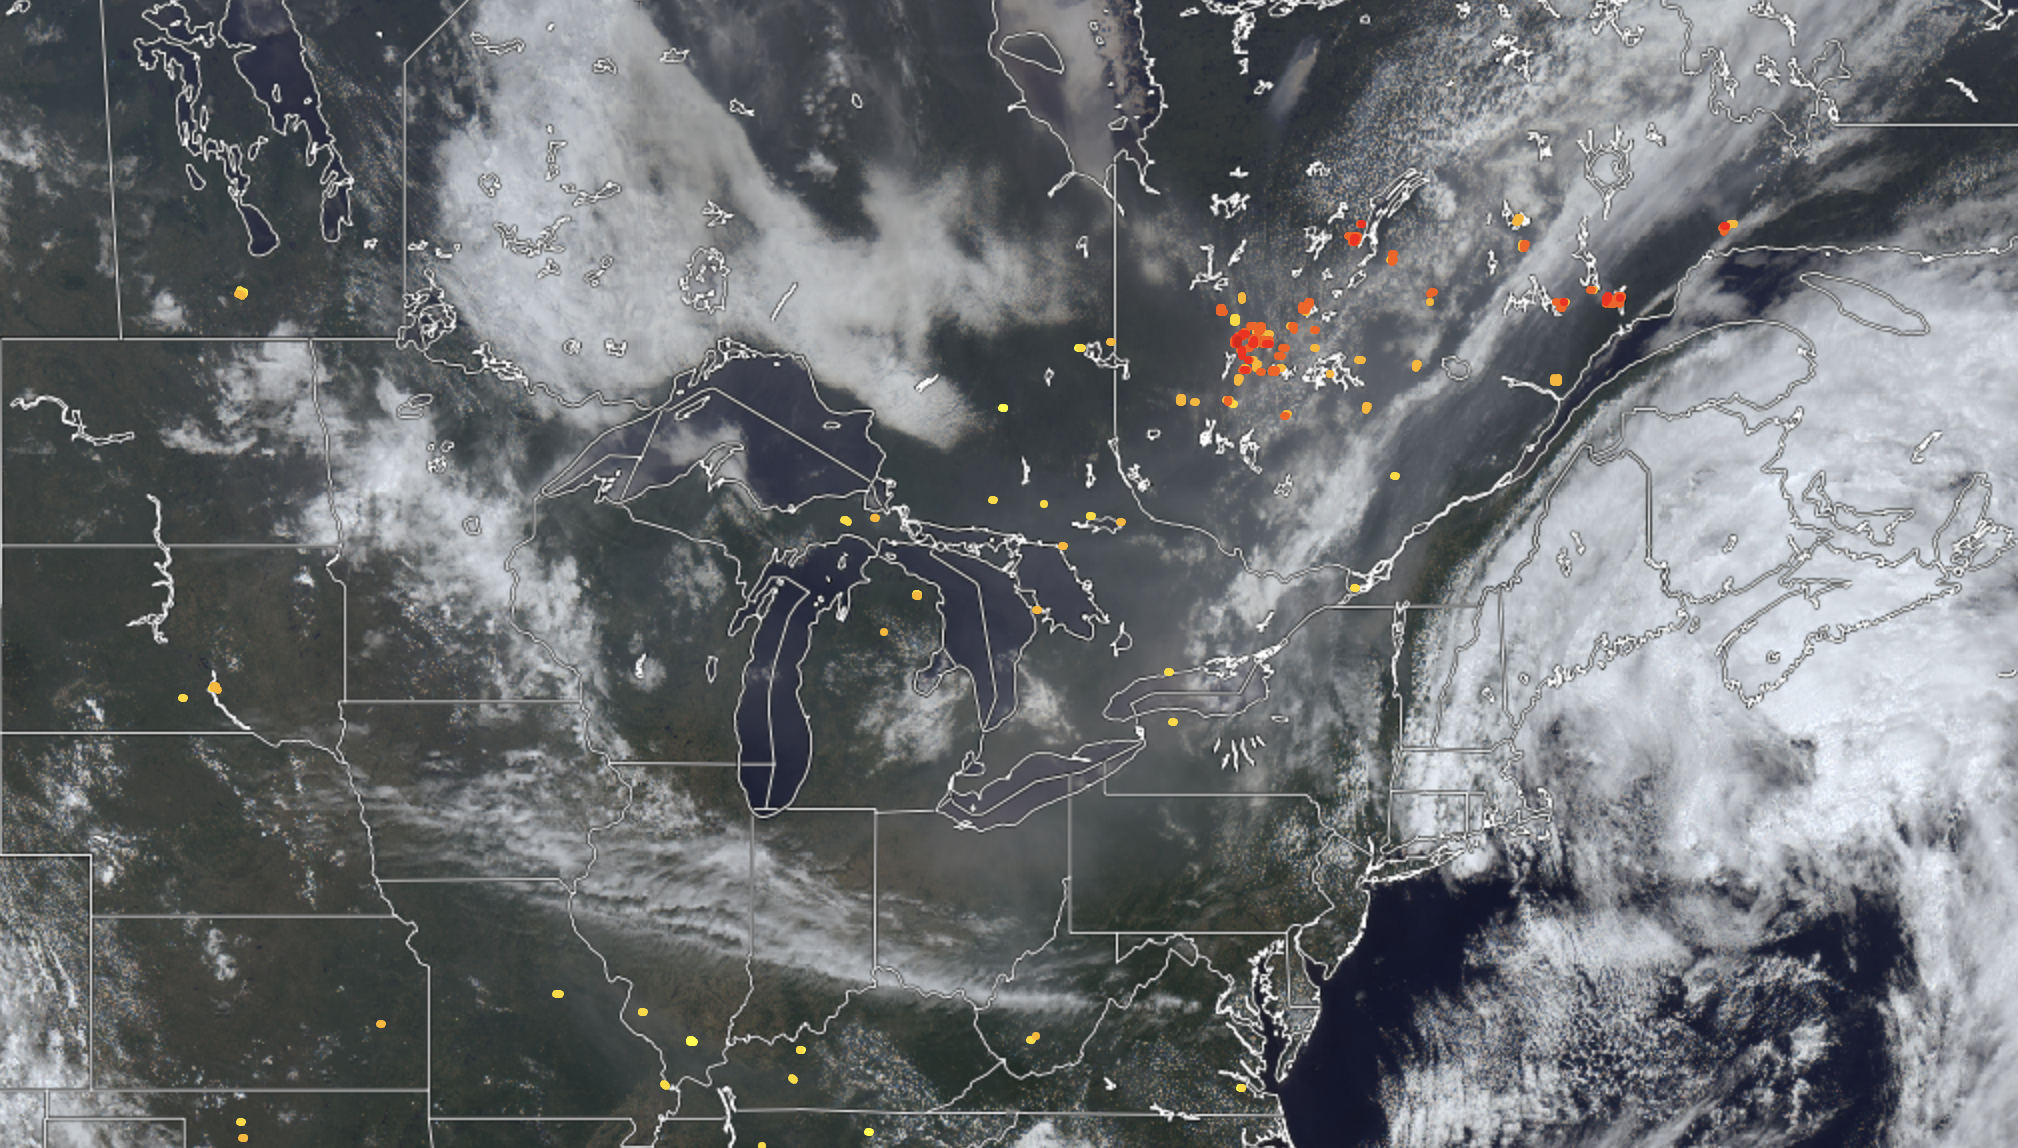
NOAA’s Hazardous Weather Testbed is an annual evaluation (by National Weather Service forecasters) of experimental satellite-based products that provide useful information during convective weather events. One of the demonstration products this year is a model with initial conditions that have assimilated fused polar hyperspectral soundings from NOAA-20/NOAA-21 and MetOp satellites. The animations above and below compare the simulated Composite Reflectivity (at hourly intervals from the 1500 UTC model run) with observed LightningCast probabilities (used here as a proxy for convection). In both cases, the Composite Reflectivity grossly captures the evolution and development of convection.
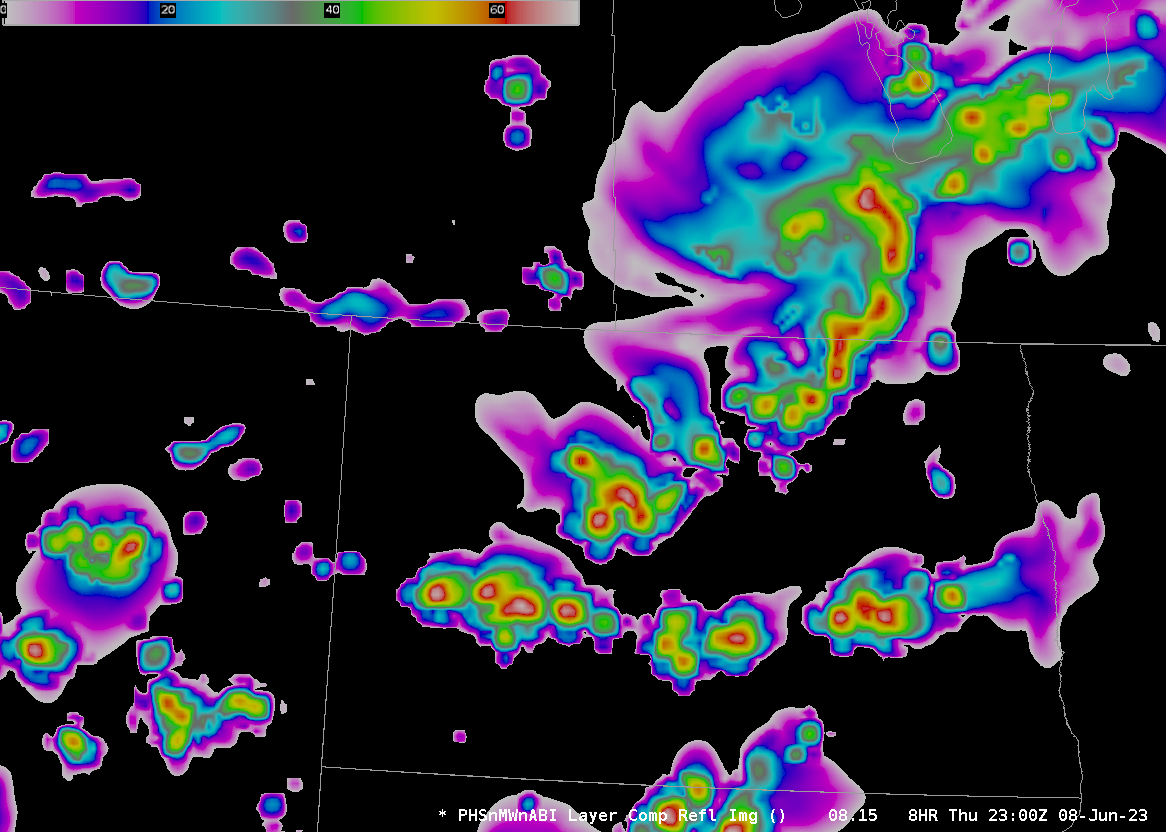
The image above shows a 7-h forecast of Composite Reflectivity over North Dakota, valid at 2300 UTC on 8 June 2023 (Note: your blogger mistakenly saved this one instead of the 6-h forecast at 2200 UTC, but the two were similar). Convection is predicted for an east-west line across the southern part of the state, with convective complexes stretching north and east of the western terminus of the line. Additional convection appears in western Montana, and over northern South Dakota. How does that compare to the observations shown below? The east-west line of observed convection is a bit farther south than predicted. The convective complexes stretching northeastward from the western terminus of that east-west line are a bit farther east than predicted. There is less convection in South Dakota than predicted. (The convection in Montana is not displayed in this particular radar sector, but it’s inferred by the satellite imagery! Overall, the predicted and observed convection match to some extent.
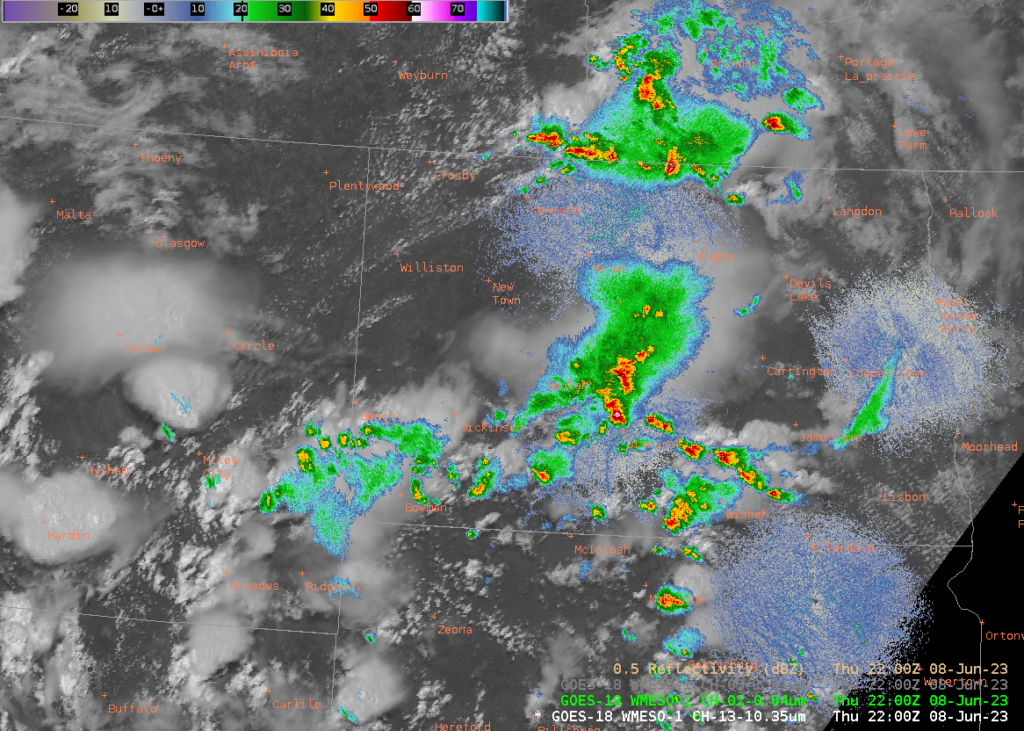
The slider below compares a 6-h forecast valid at 1100 UTC on 9 June with the infrared imagery. The PHS model accurately captured the development of the southward-propagating Mesoscale Convective System over southeast South Dakota.
PHSnMWnABI model output are available at this link.
View only this post Read Less


