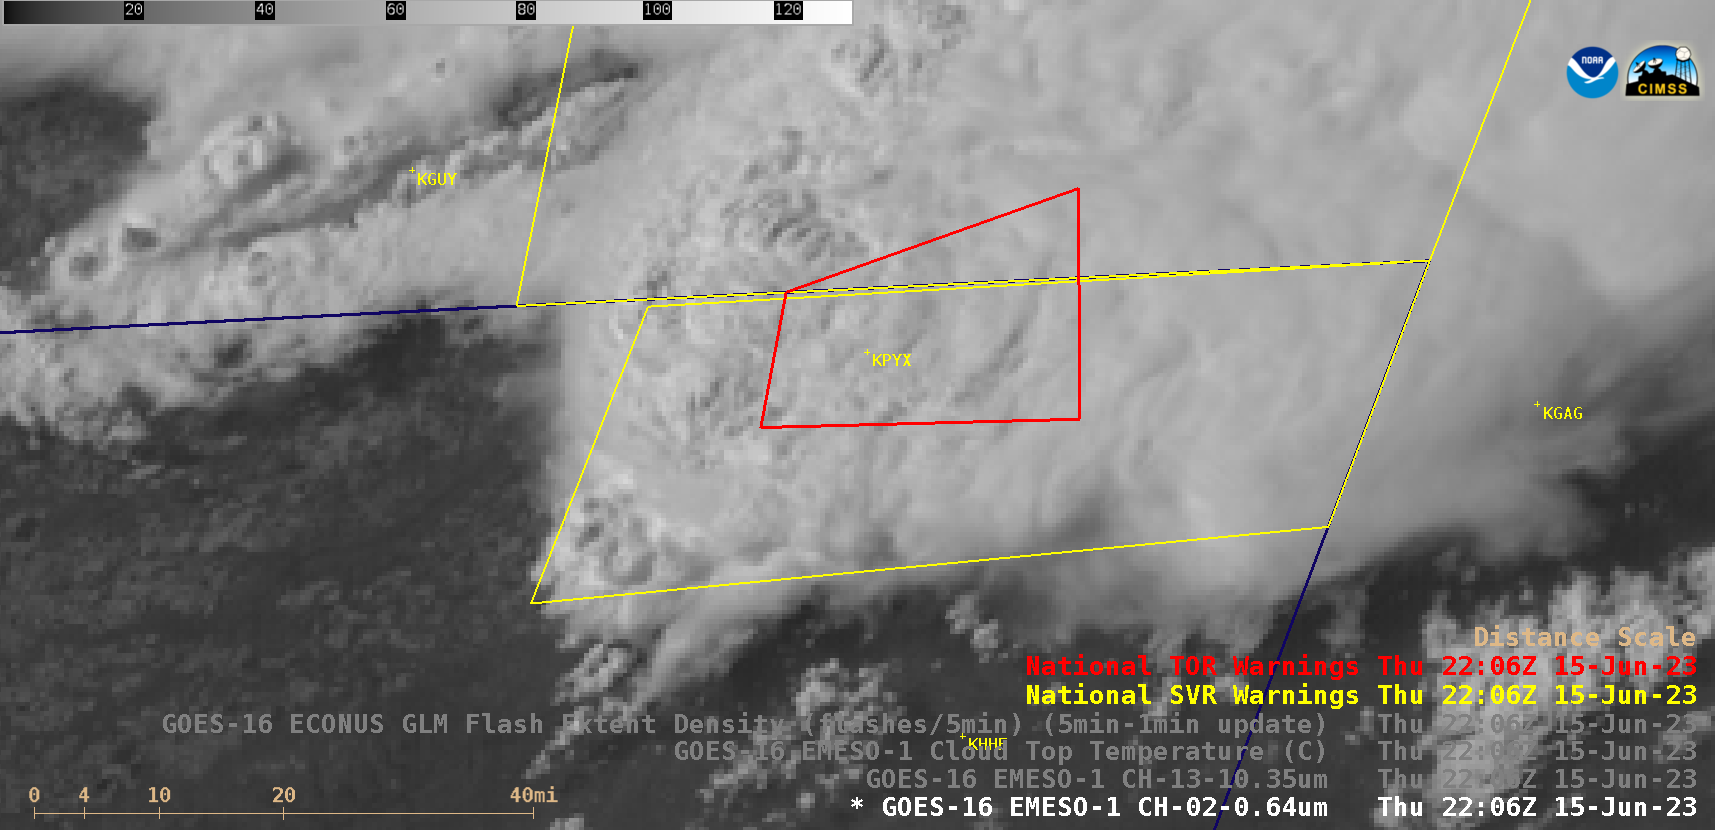
1-minute Mesoscale Domain Sector GOES-16 (GOES-East) “Red” Visible (0.64 µm) images (above) with/without an overlay of GLM Flash Extent Density (above) showed the development of a thunderstorm that produced the fatal EF3-rated tornado that moved through Perryton, Texas (located about 4 miles southwest of airport identifier KPYX) from 2206-2217 UTC on 15 June 2023. A modest amount of lightning activity was associated... Read More

GOES-16 “Red” Visible (0.64 µm) images, with/without an overlay of GLM Flash Extent Density [click to play animated GIF | MP4]
1-minute
Mesoscale Domain Sector GOES-16
(GOES-East) “Red” Visible (
0.64 µm) images
(above) with/without an overlay of
GLM Flash Extent Density (above) showed the development of a thunderstorm that produced the fatal
EF3-rated tornado that moved through Perryton, Texas (located about 4 miles southwest of airport identifier KPYX) from 2206-2217 UTC on
15 June 2023. A modest amount of lightning activity was associated with these storms. Prior to convective initiation in the far northern Texas Panhandle, orphan anvil pulses were evident south of Perryton (indicating that convective inhibition was diminishing across that area).
The corresponding GOES-16 “Clean” Infrared Window (10.3 µm) and Cloud Top Temperature derived product images are shown below; just prior to the tornado, the coldest 10.3 µm infrared brightness temperature and Cloud Top Temperature values were -73.41ºC and -76.92ºC, respectively, at 2158 UTC (note that the coldest temperature for this infrared color enhancement was adjusted to be -95ºC).
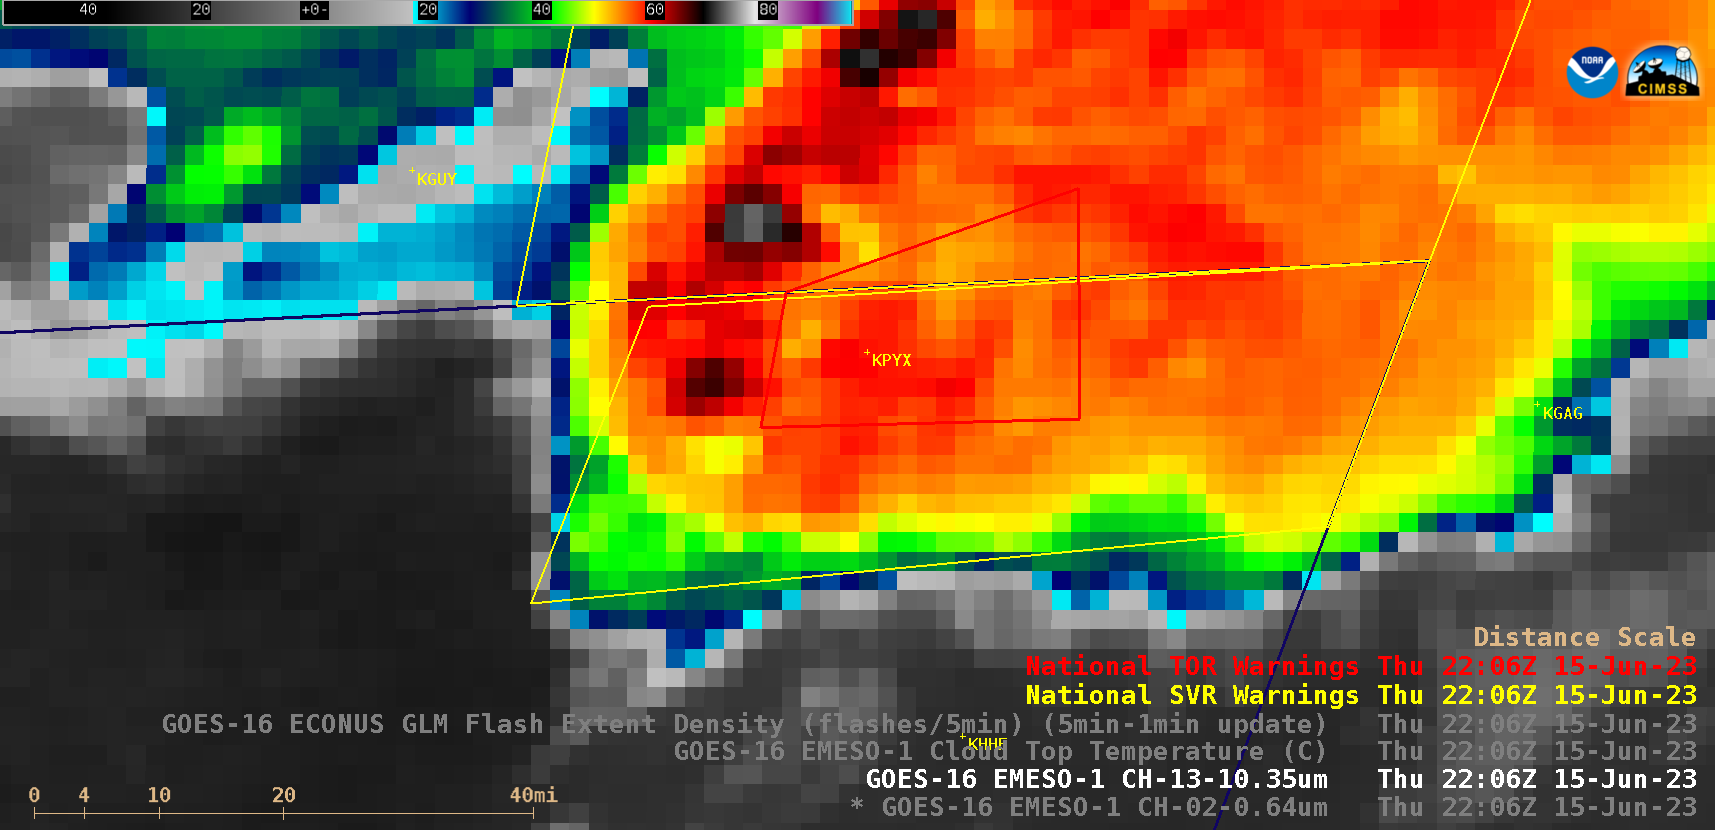
GOES-16 “Clean” Infrared Window (10.3 µm) and Cloud Top Temperature derived product images [click to play animated GIF | MP4]
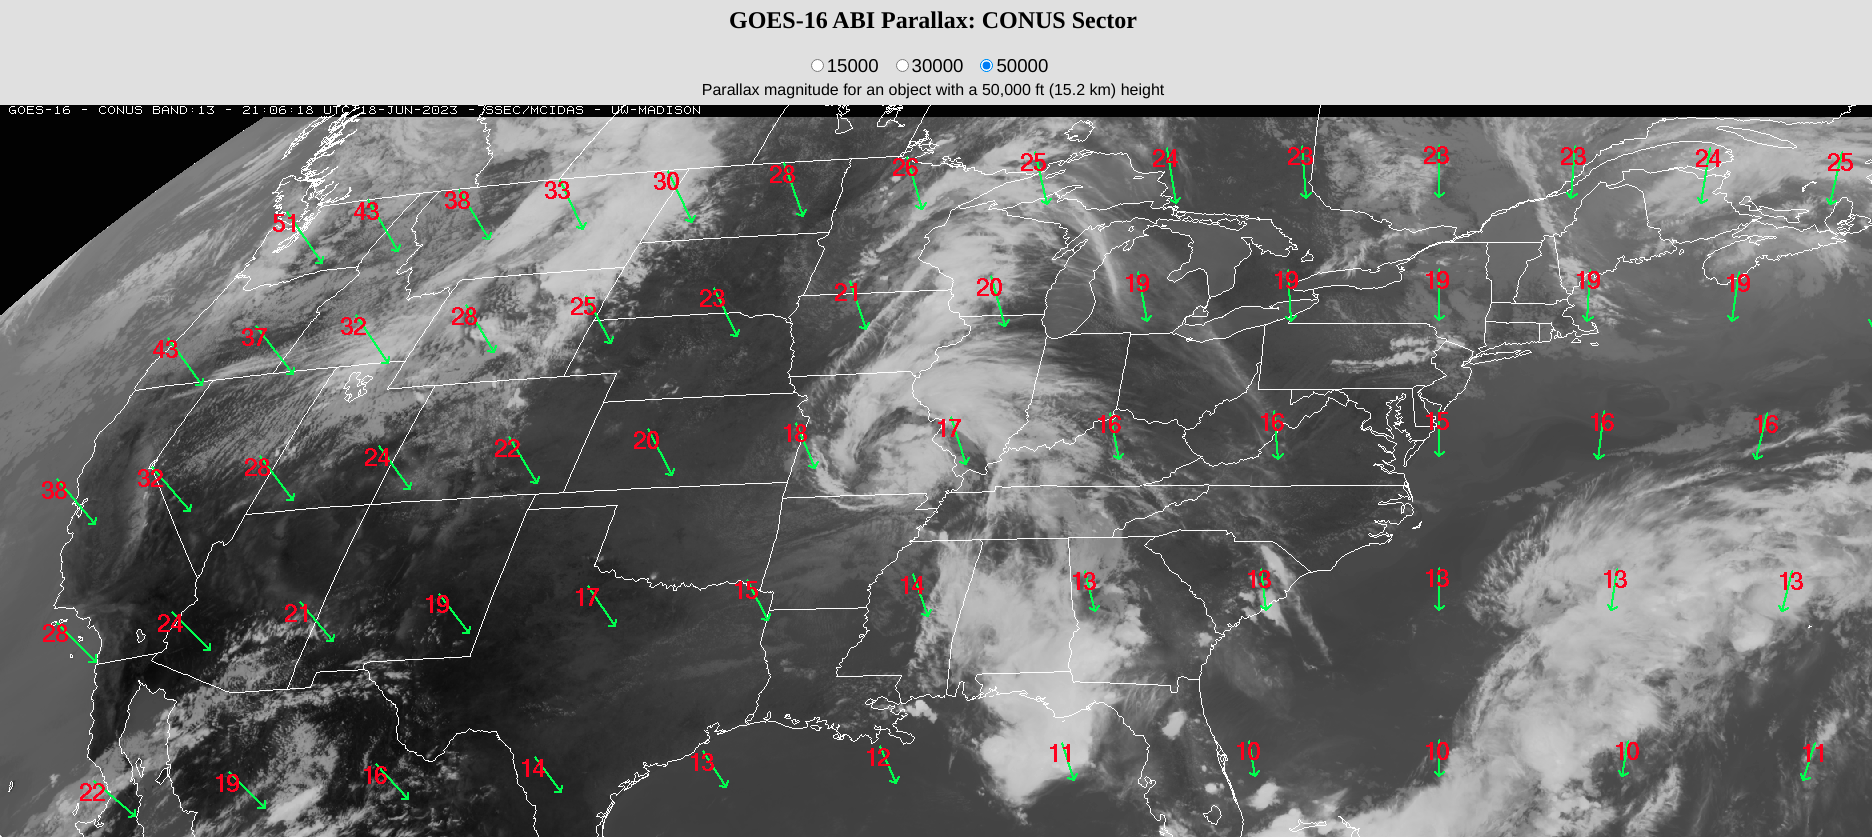
In a toggle between GOES-16 Visible and Infrared images at 2158 UTC
(below), the apparent location of the thunderstorm’s cold overshooting top was over the Oklahoma Panhandle — but taking
parallax into account, the actual location of that overshooting top would have been about
20 km (12 miles) to the southeast (closer to Perryton).
GOES-16 “Red” Visible (0.64 µm) and “Clean” Infrared Window (10.3 µm) images 2158 UTC [click to enlarge]
GOES-16
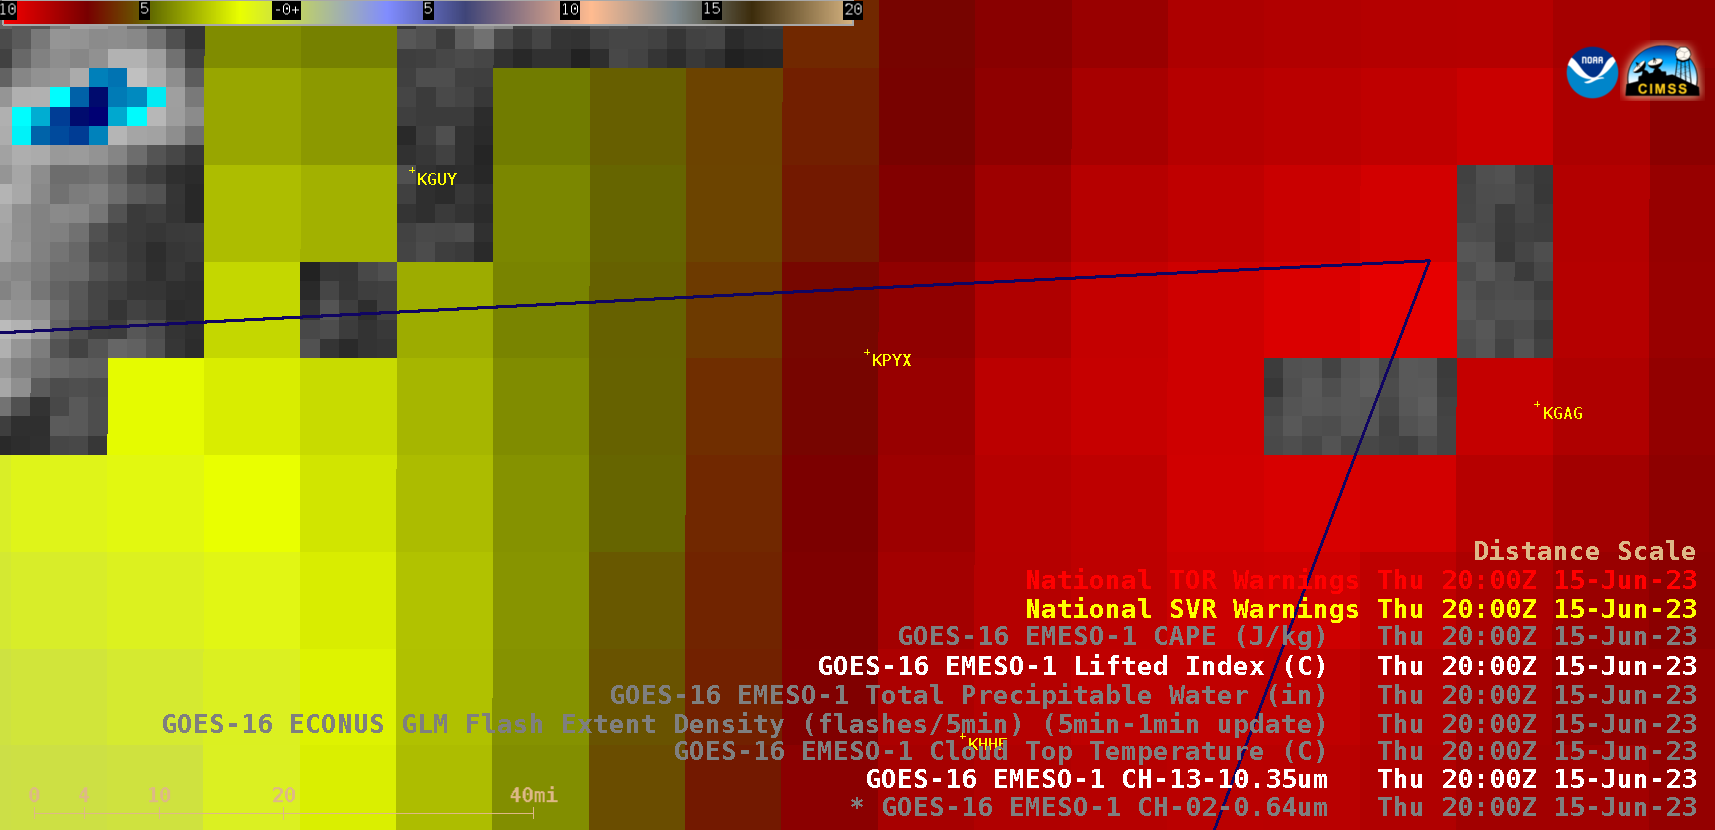
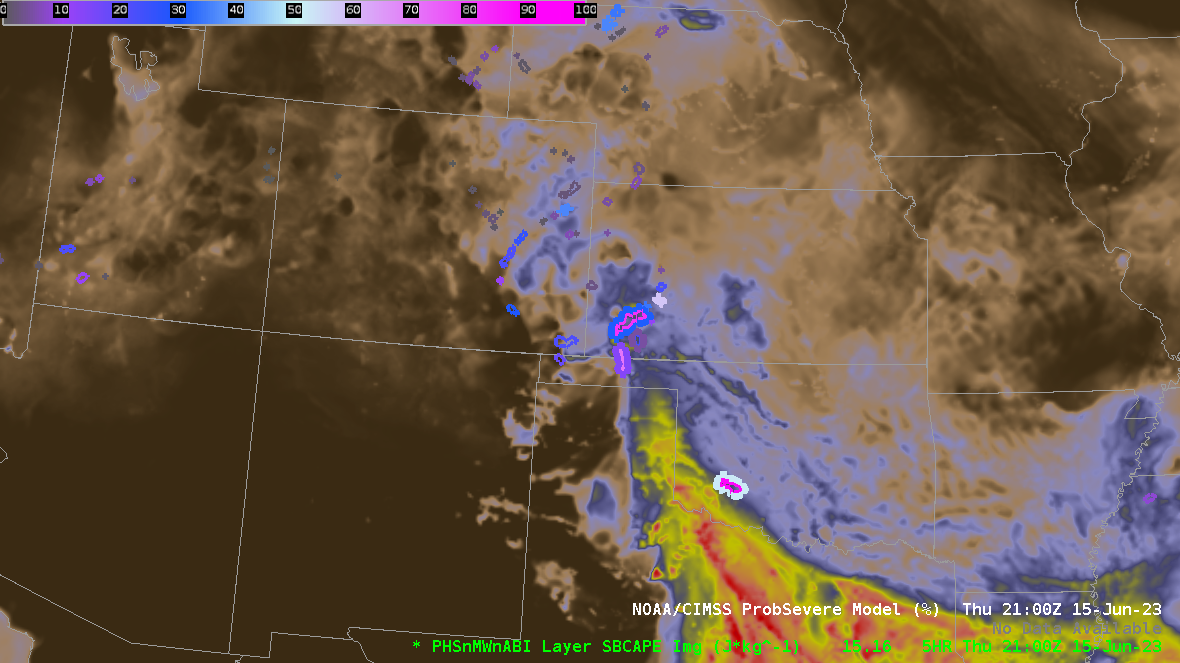
Lifted Index (LI) and Convective Available Potential Energy (CAPE) derived products
(below) showed that the thunderstorms were approaching a N-S oriented corridor of instability (as was also discussed in
this blog post). The most unstable LI values within that corridor were around -10ºC, with CAPE values around 2500 J/kg.
GOES-16 Lifted Index and Convective Available Potential Energy (CAPE) derived product images [click to play animated GIF | MP4]
GOES-16
Total Precipitable Water (TPW) derived product images
(below) indicated that an axis of moisture was also in place within the corridor of instability. Peak TPW values were around 1.3 inches.

GOES-16 Total Precipitable Water derived product images [click to play animated GIF | MP4]
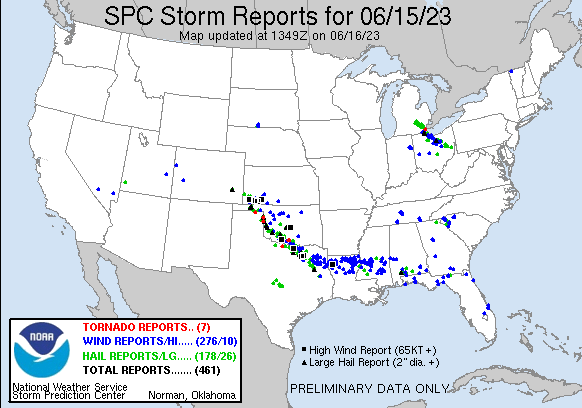
GOES-16 Visible and Infrared images
(below) include time-matched (+/- 3 minutes) plots of
SPC Storm Reports.
GOES-16 “Red” Visible (0.64 µm, top) and “Clean” Infrared Window (10.3 µm, bottom) images, with time-matched plots of SPC Storm Reports [click to play animated GIF | MP4]
View only this post
Read Less


