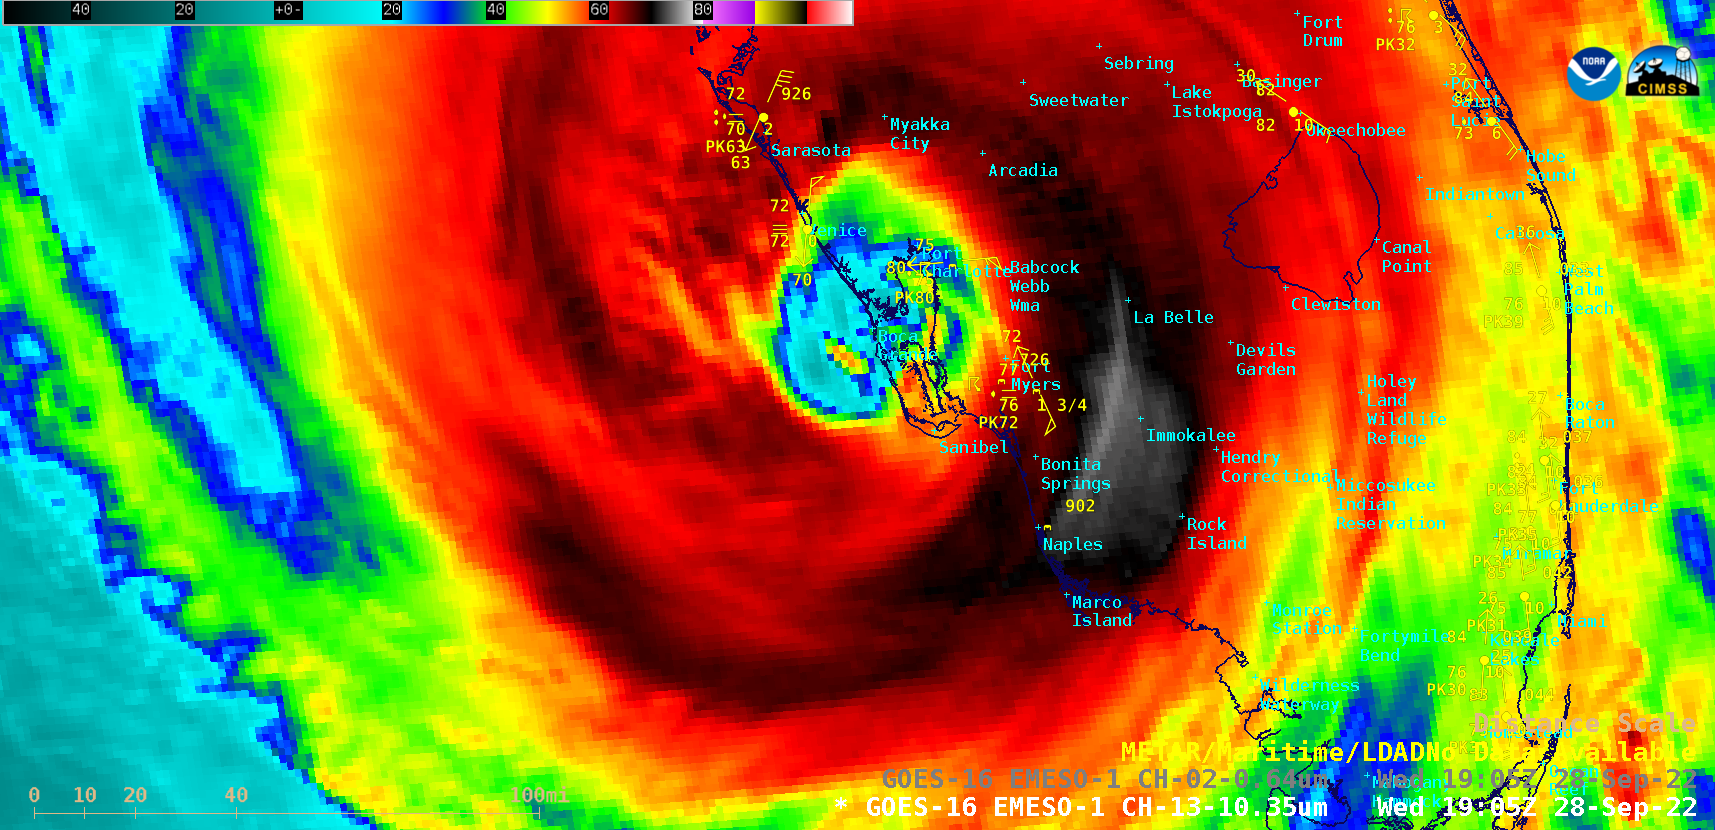
Hurricane Ian makes landfall in Florida

GOES-16 “Clean” Infrared Window (10.3 µm) and “Red” Visible (0.64 µm) images [click to play animated GIF | MP4]
30-second GOES-16 Visible images with time-matched plots of GLM Flashes (below) indicated that lightning activity within the eyewall decreased as the eye of Ian approached the coast.

GOES-16 “Red” Visible (0.64 µm) images, with plots of GLM Flashes [click to play animated GIF | MP4]
GOES-16 “Red” Visible (0.64 µm) and Landsat-8 Panchromatic (0.59 µm) images, valid at 1557 UTC [click to enlarge]
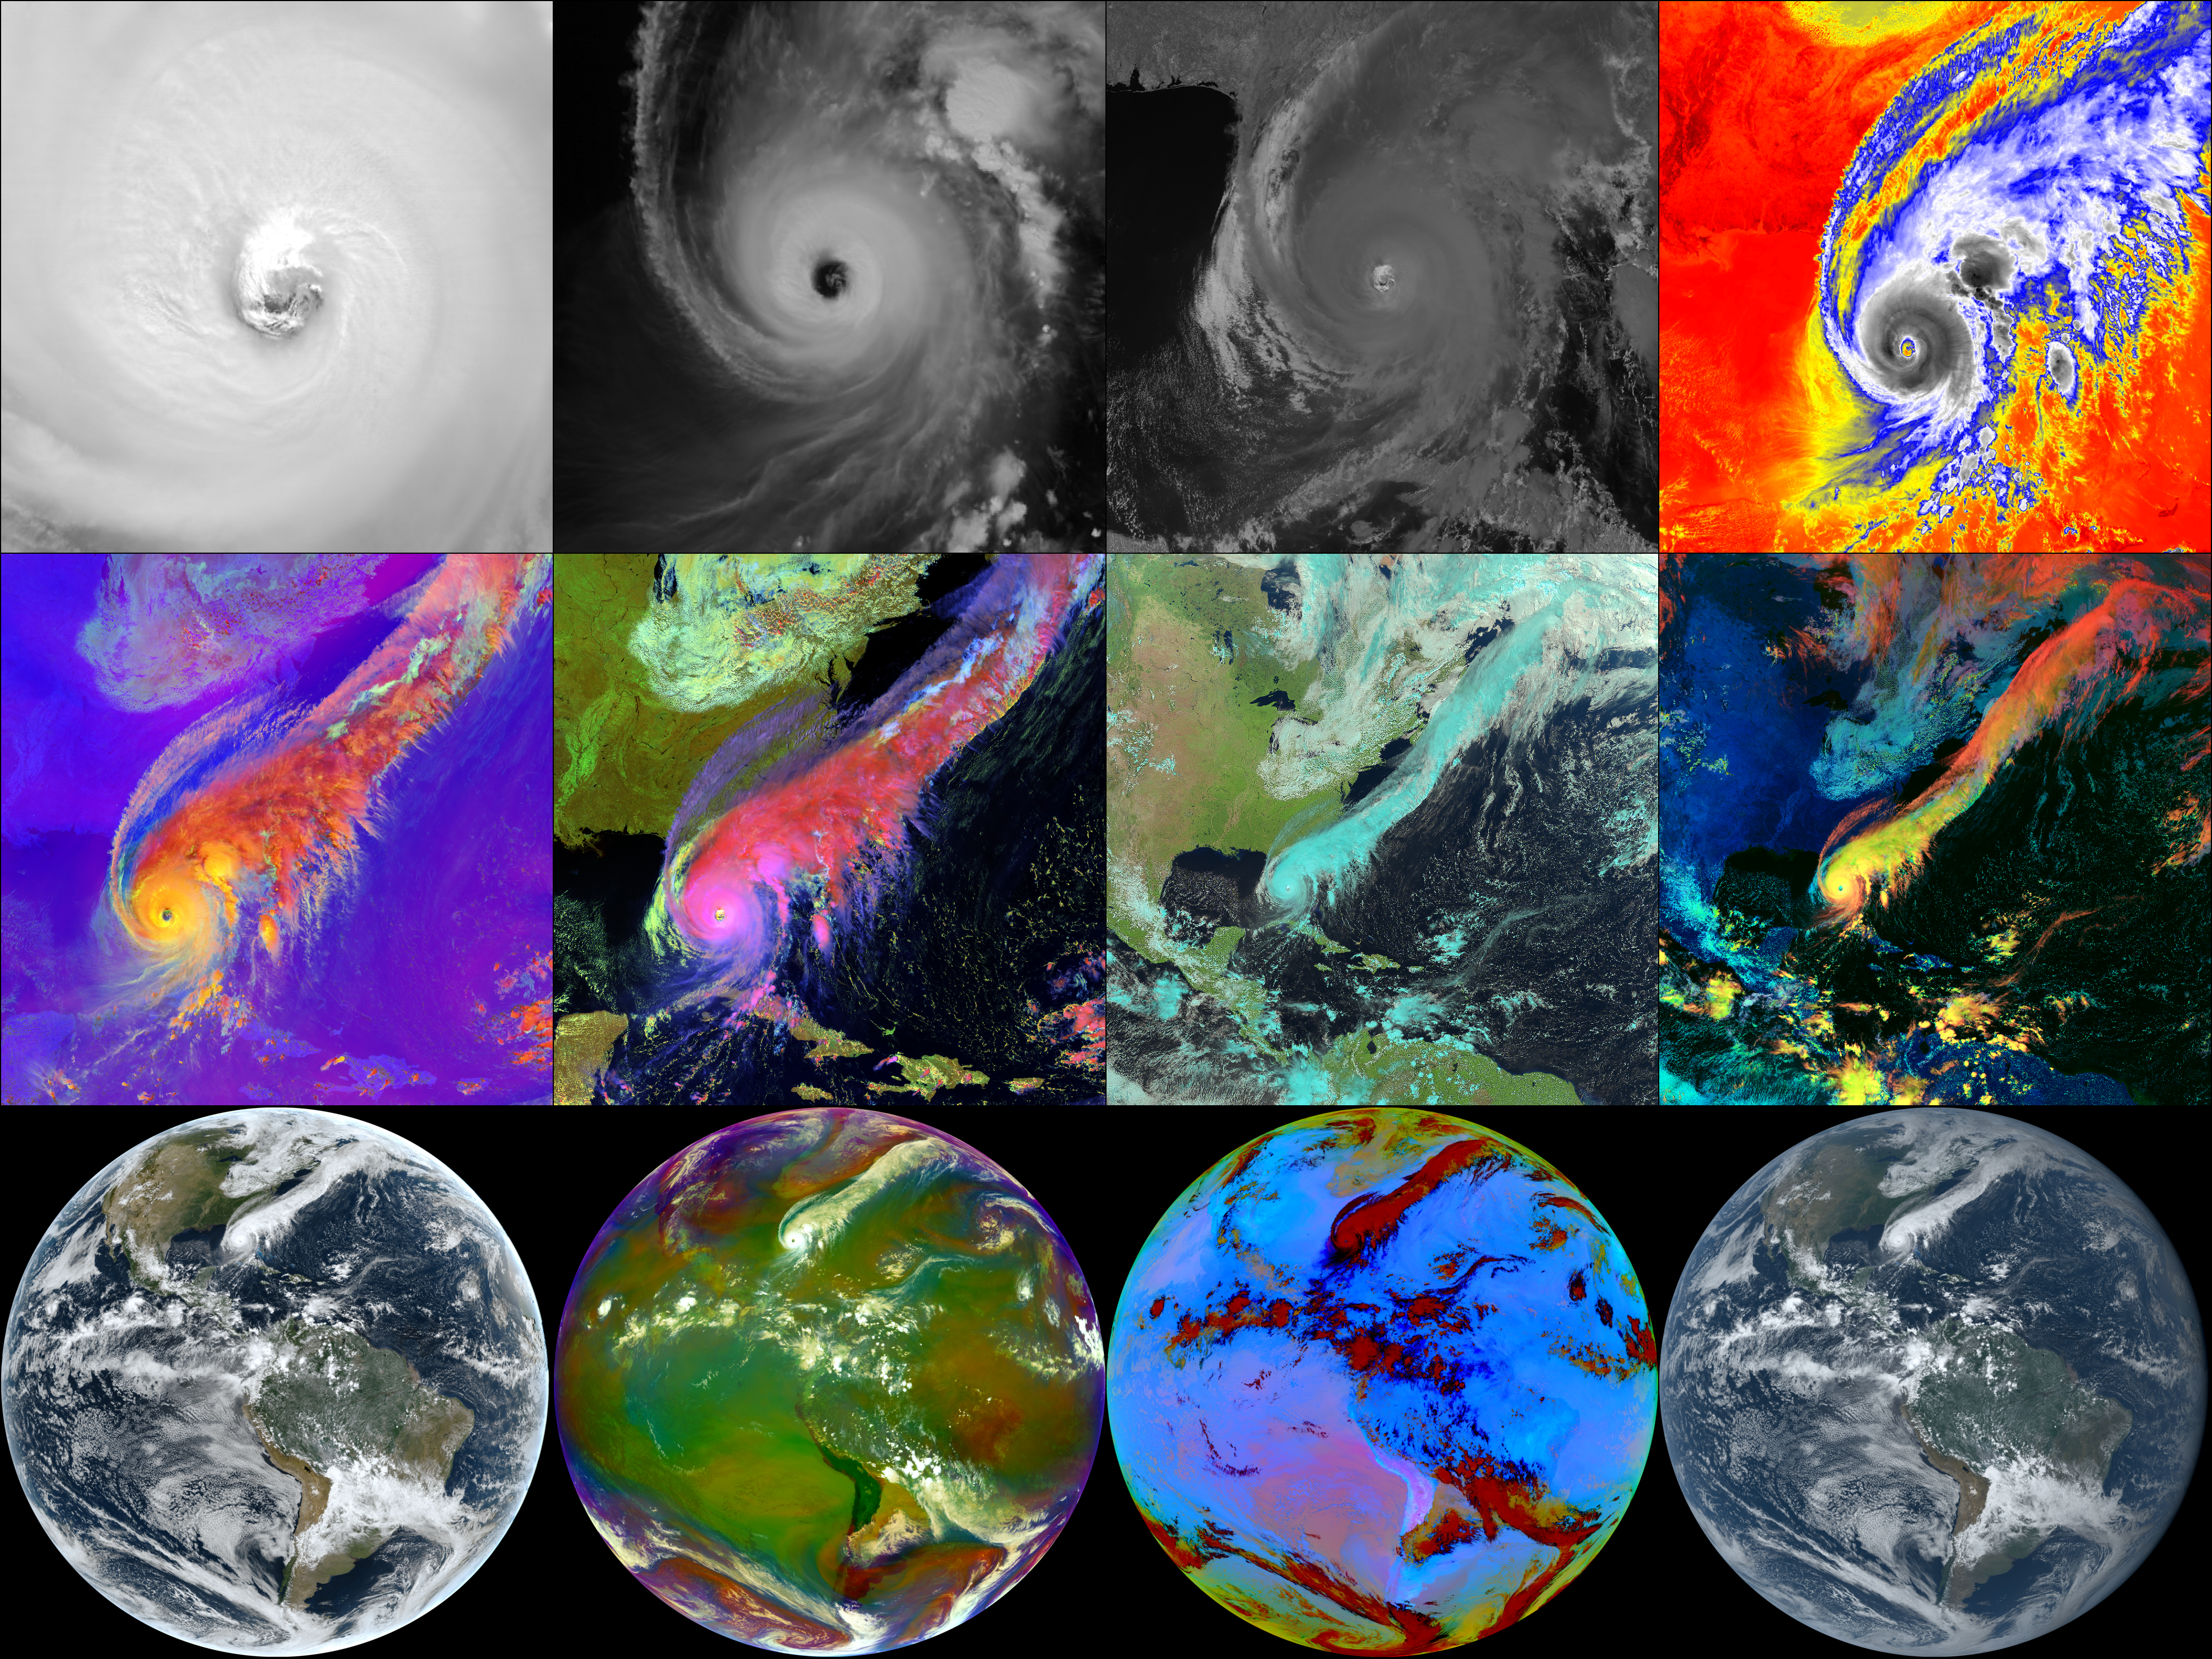
Multi-panel Image at Landfall
This multi-panel image shows a number of GOES-16 ABI spectral bands, or band composites when Hurricane Ian made landfall. The upper left image is the finest spatial resolution, while the last row showing full disk scale imagery.
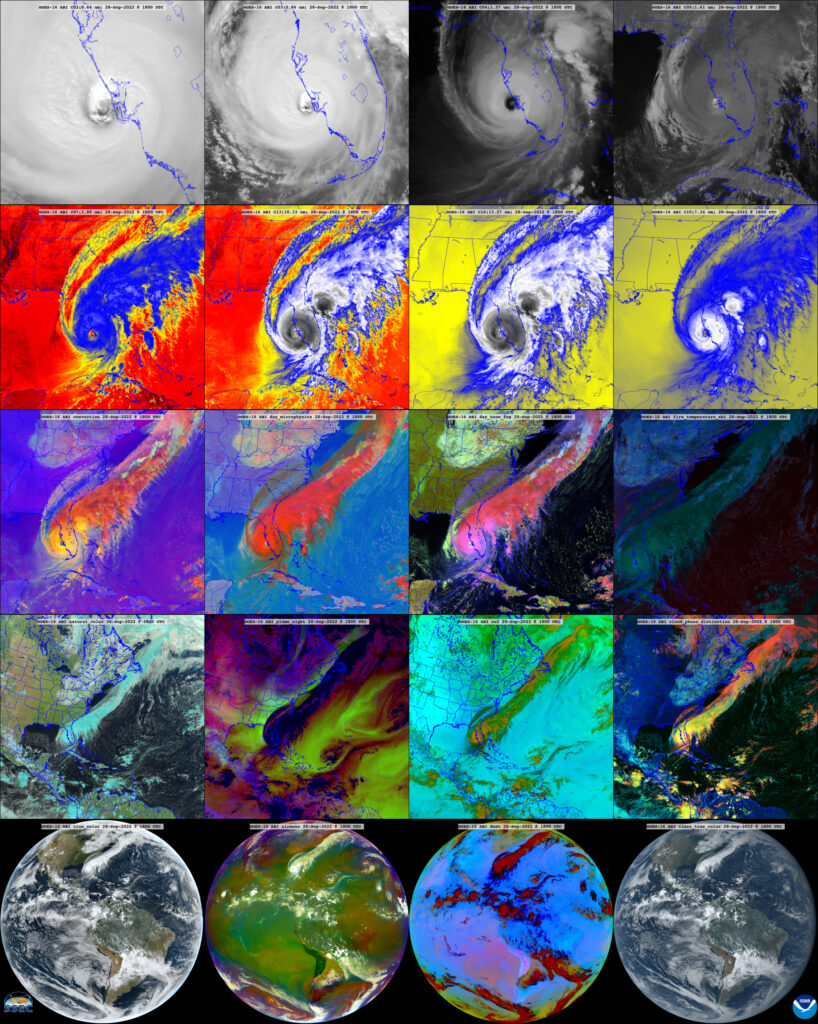
Same image as above, but in a larger size.