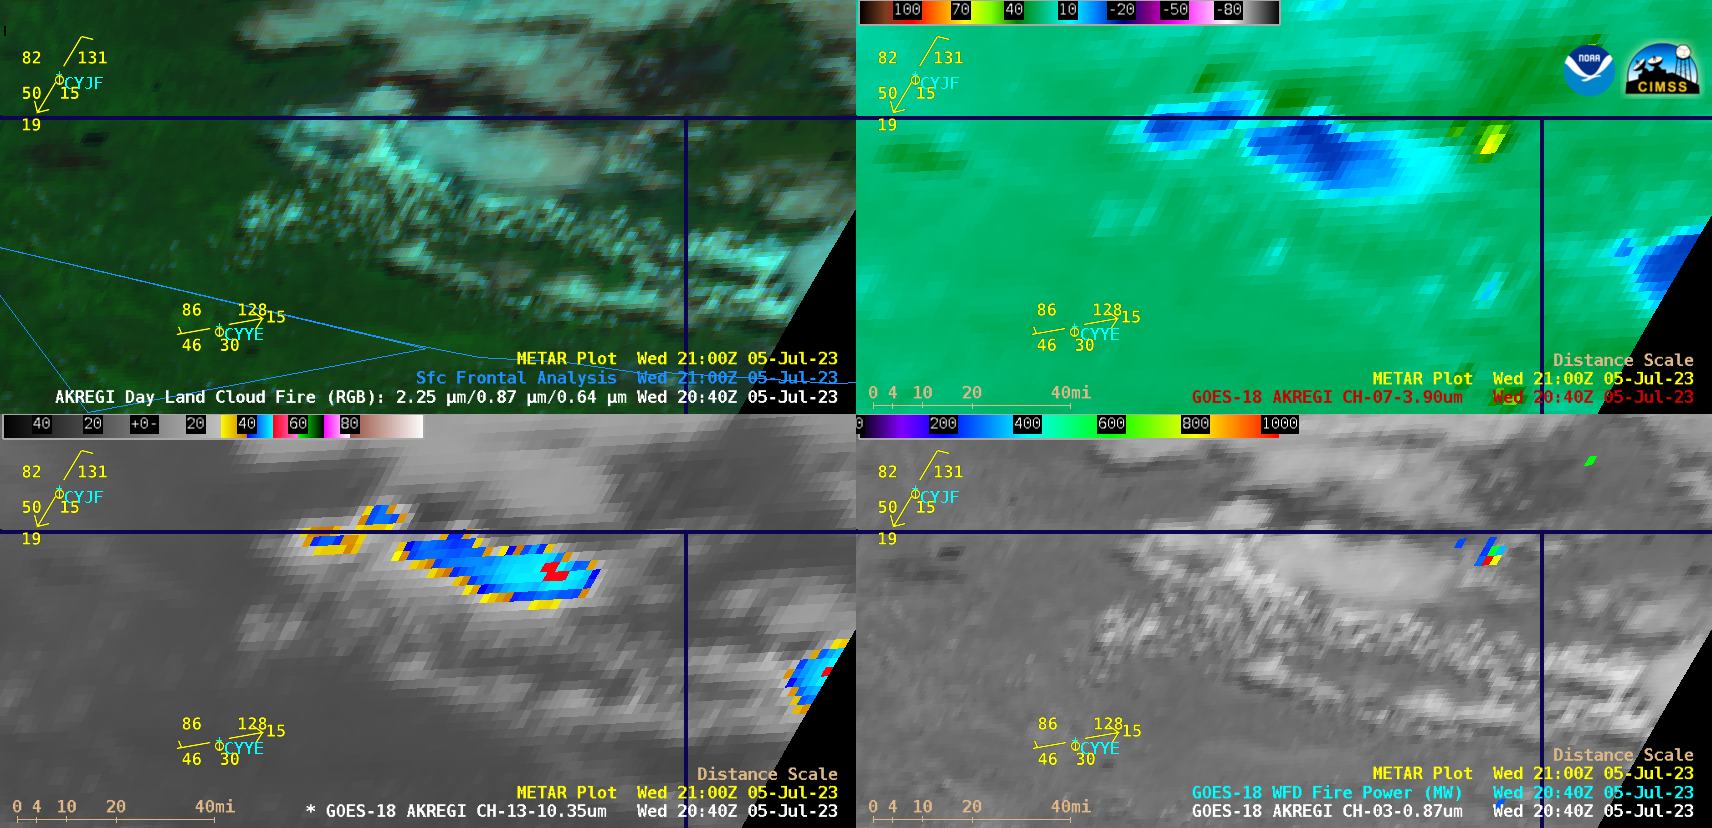
GOES-16 (GOES-East) Near-Infrared “Vegetation” (0.86 µm), Vegetation Channel Difference (0.64 µm – 0.86 µm), Day Land Cloud RGB and CIMSS Natural Color RGB images (above) showed a west-to-east oriented damage swath across Furnas and Harlan counties in far southern Nebraska n 02 July 2023 — which resulted from wind-driven large hail (wind gusts to 70 mph, hail up to... Read More

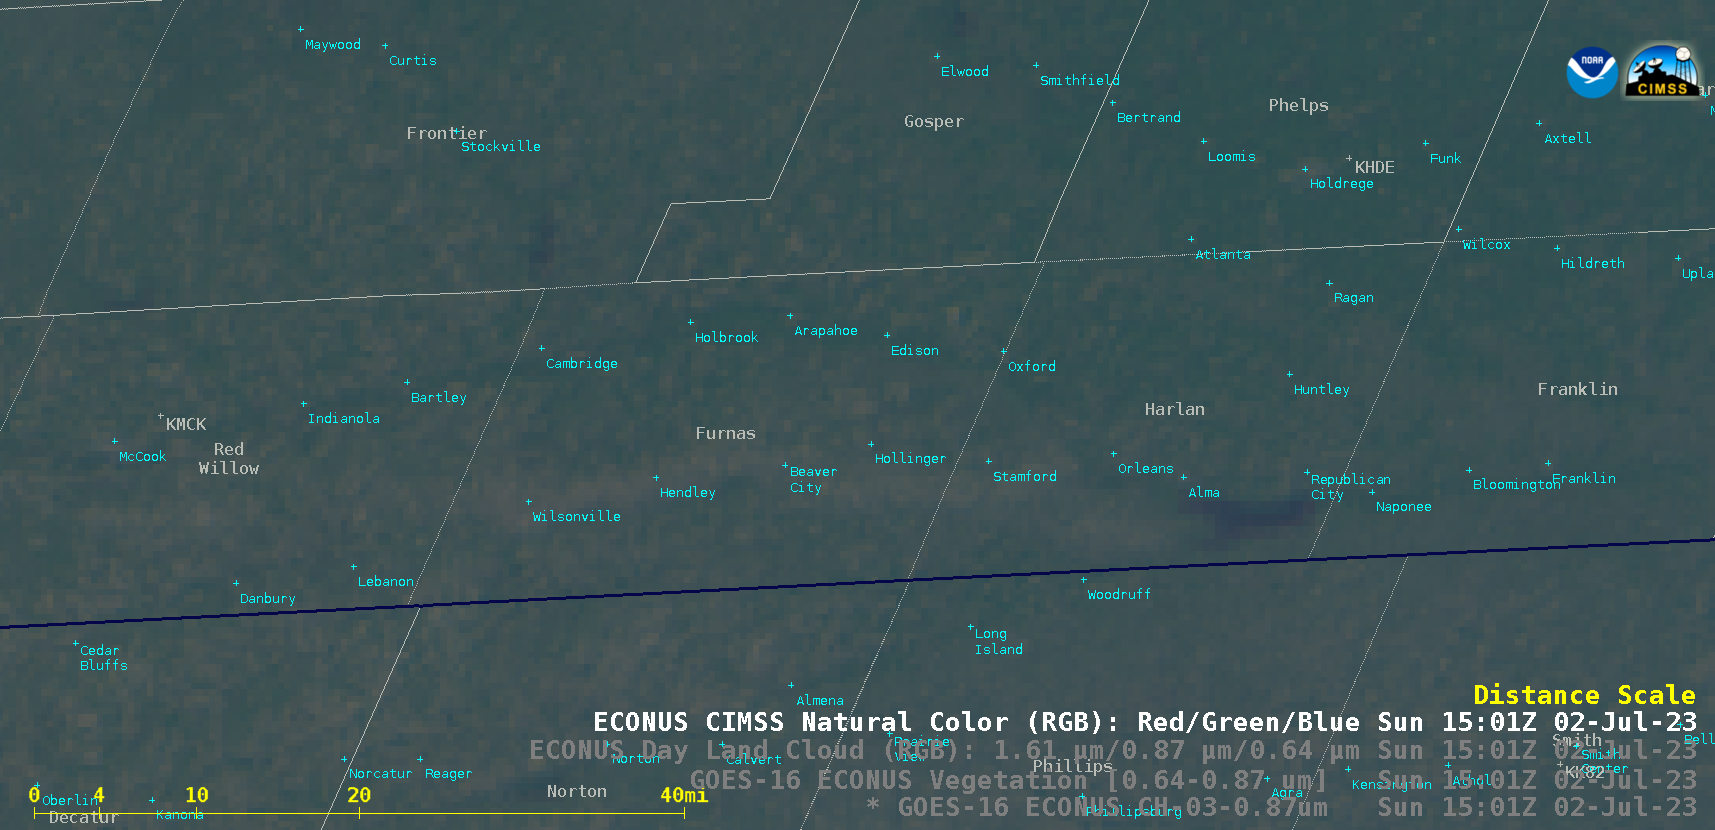
GOES-16 Near-Infrared “Vegetation” (0.86 µm), Vegetation Channel Difference (0.64 µm – 0.86 µm), Day Land Cloud RGB and CIMSS Natural Color RGB images [click to play animated GIF | MP4]
GOES-16
(GOES-East) Near-Infrared “Vegetation” (
0.86 µm), Vegetation Channel Difference (0.64 µm – 0.86 µm),
Day Land Cloud RGB and
CIMSS Natural Color RGB images
(above) showed a west-to-east oriented damage swath across Furnas and Harlan counties in far southern Nebraska n
02 July 2023 — which resulted from wind-driven large hail (wind gusts to 70 mph, hail up to 3.00 inches in diameter:
Local Storm Reports) 3 days earlier during the
28-29 June Derecho event.
GOES-16 Rayleigh-scattering-corrected True Color RGB images from the CSPP GeoSphere site (below) provided a higher-contrast view of the damage swath, which exhibited shades of tan (in contrast to the predominantly greener appearance of adjacent healthy vegetation and fields of crops).
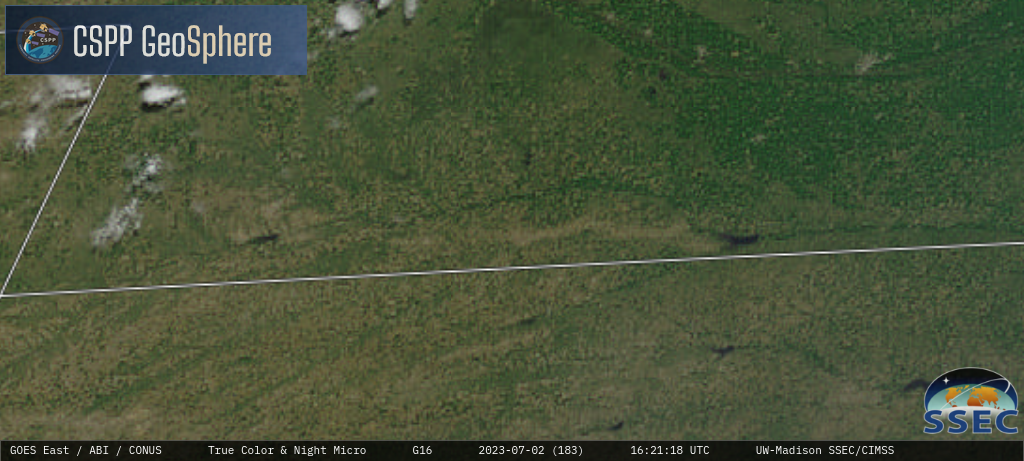
GOES-16 True Color RGB images [click to play MP4 animation]
The derecho damage swath also showed up well in a toggle between Suomi-NPP VIIRS True Color RGB and False Color RGB images
valid at 1932 UTC (below). Data used to create the VIIRS images were downloaded and processed by the SSEC/CIMSS Direct Broadcast ground station.
Suomi-NPP VIIRS True Color RGB and False Color RGB images valid at 1932 UTC [click to enlarge]
1-minute
Mesoscale Domain Sector GOES-16 “Clean” Infrared Window (10.3 µm) images just after local midnight on
29 June (below) inc\luded time-matched (+/- 3 minutes)
SPC Storm Reports plotted in white — which showed the reports of wind/hail responsible for the Furnas/Harlan county damage swath seen on 02 July.
GOES-16 “Clean” Infrared Window (10.3 µm) images, with time-matched SPC Storm Reports plotted in white; Furnas and Harlan counties are outlined in cyan [click to play animated GIF | MP4]
View only this post
Read Less


