This website works best with a newer web browser such as Chrome, Firefox, Safari or Microsoft
Edge. Internet Explorer is not supported by this website.
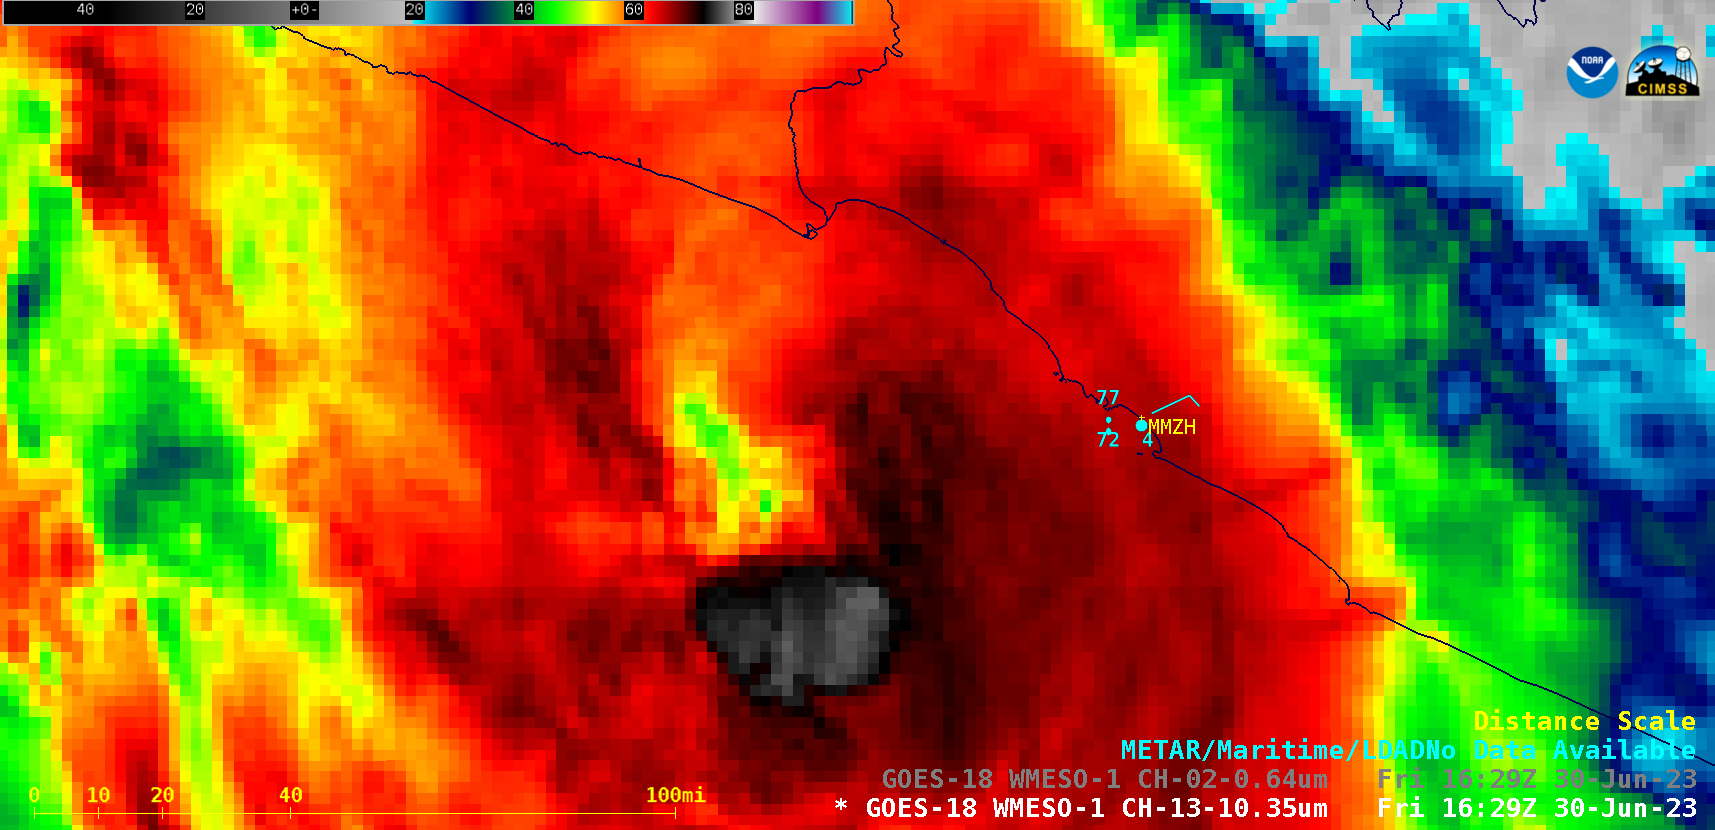
1-minute Mesoscale Domain Sector GOES-18 (GOES-West) “Red” Visible (0.64 µm) and “Clean” Infrared Window (10.3 µm) images (above) showed Category 1 Hurricane Beatriz just off the west coast of Mexico (near Ixtapa, station identifier MMZH) as a cloud-filled eye was becoming more apparent.A DMSP-17 Microwave (85 GHz) image at 1322 UTC (below) from the CIMSS Tropical Cyclones site indicated... Read More
GOES-18 “Red” Visible (0.64 µm) and “Clean” Infrared Window (10.3 µm) images [click to play animated GIF | MP4]
1-minute Mesoscale Domain Sector GOES-18 (GOES-West) “Red” Visible (0.64 µm) and “Clean” Infrared Window (10.3 µm) images (above) showed Category 1 Hurricane Beatriz just off the west coast of Mexico (near Ixtapa, station identifier MMZH) as a cloud-filled eye was becoming more apparent.
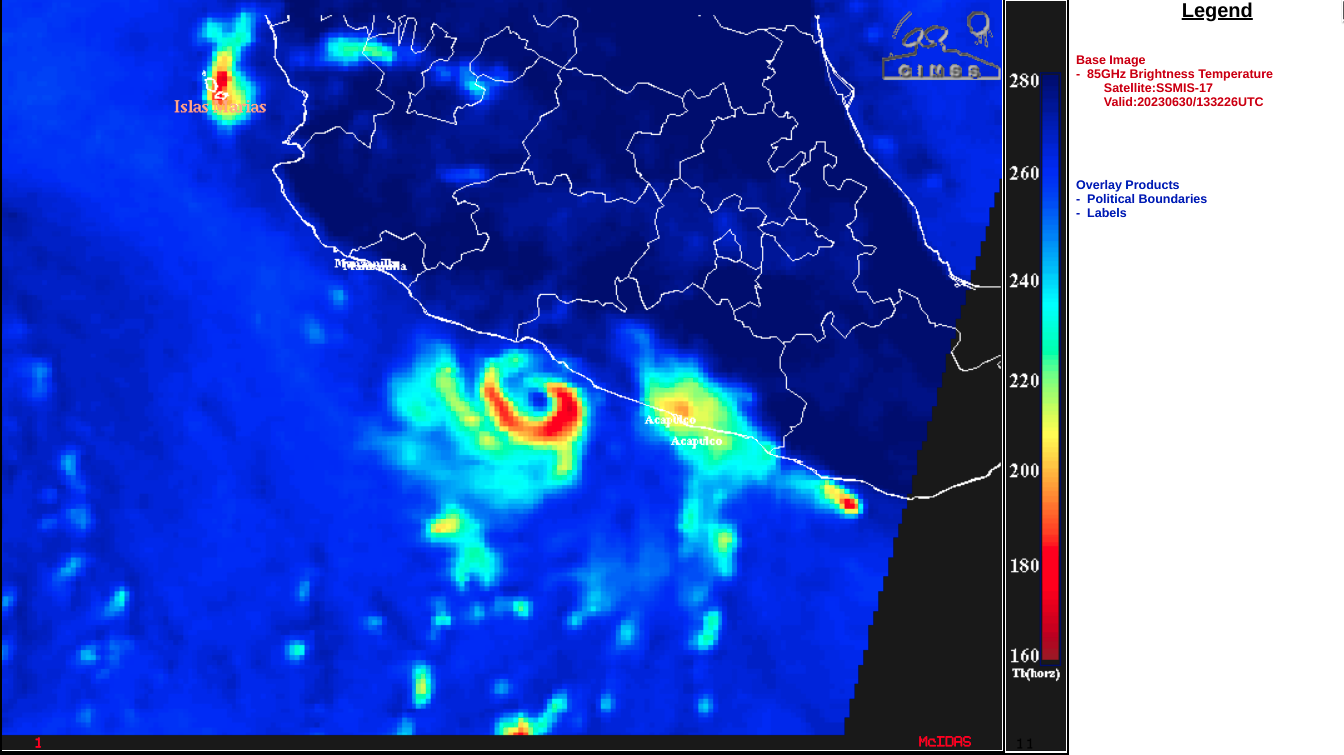
A DMSP-17 Microwave (85 GHz) image at 1322 UTC (below) from the CIMSS Tropical Cyclones site indicated that the eyewall had not yet completely closed at that time.
DMSP-17 SSMIS Microwave (85 GHz) image at 1332 UTC [click to enlarge]
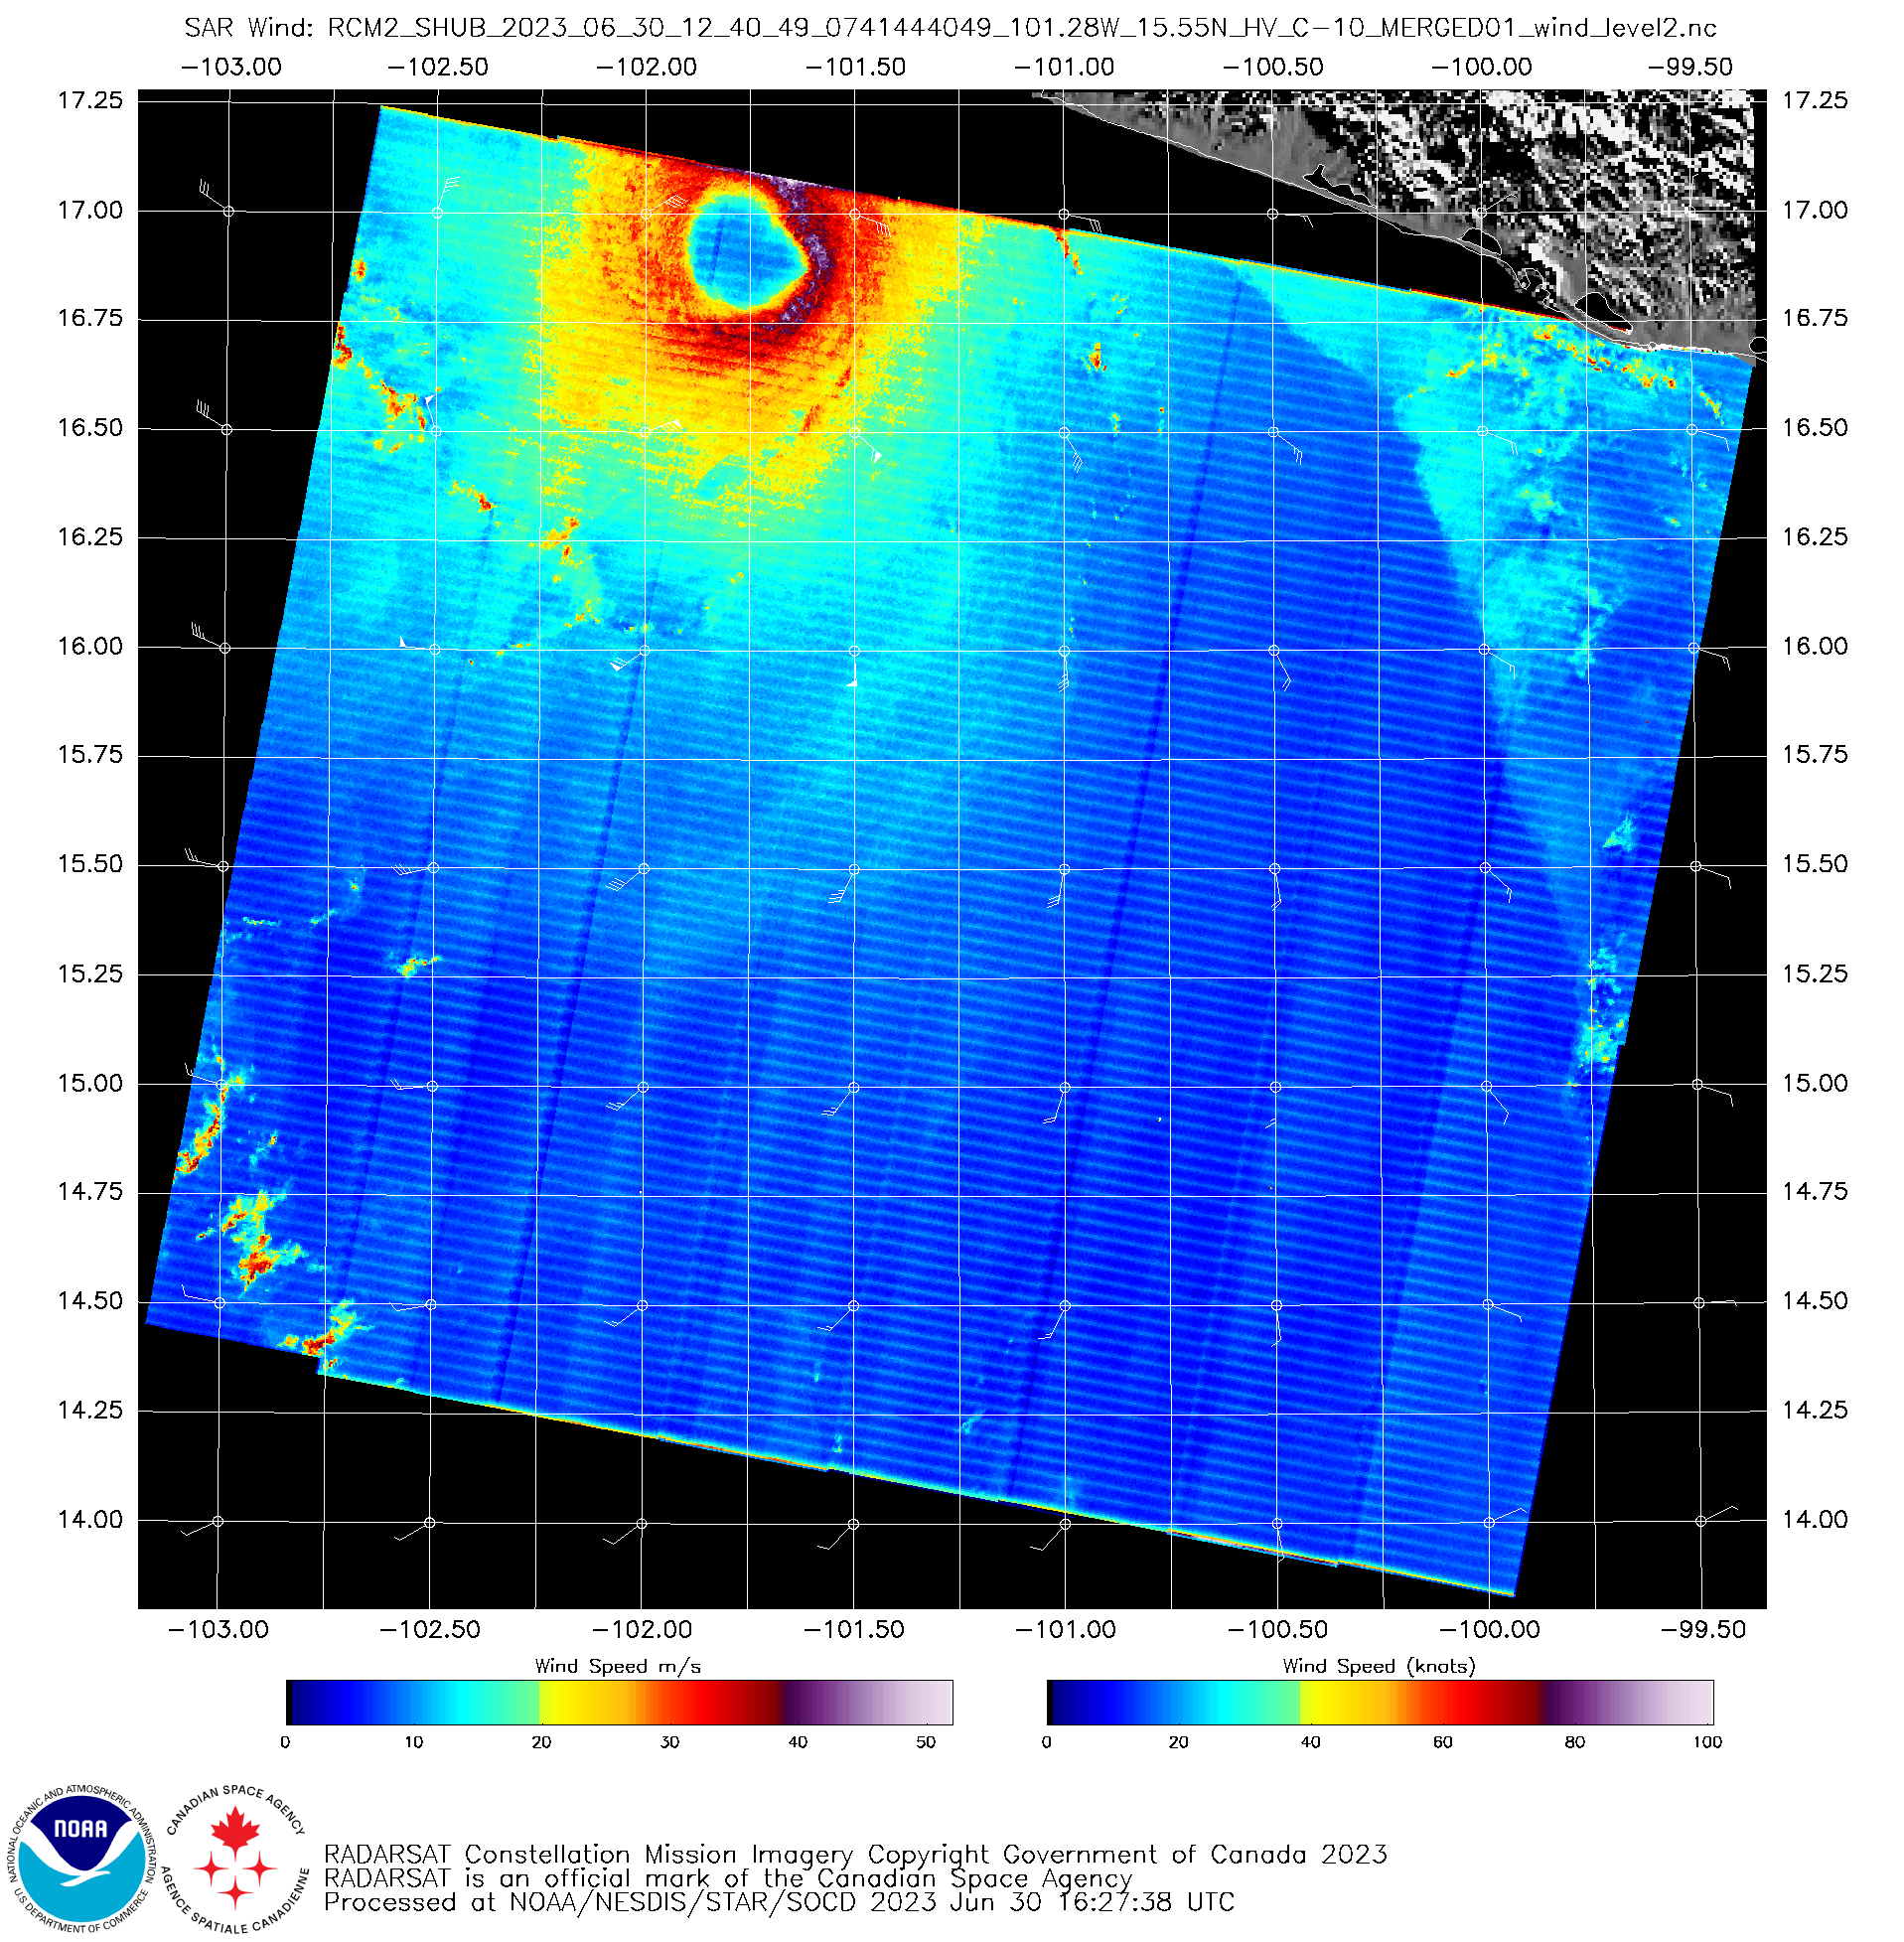
However, Synthetic Aperture Radar (SAR) winds (below) from an earlier 1240 UTC overpass of RCM-2 (source) did suggest that a closed eye had formed — and the peak radial wind speed at that time was 79 knots.
A long-lived mesoscale convective system (MCS) accompanied by strong winds at its leading edge, i.e., a Derecho, moved through the central US on 29 June 2023. The animation above shows GOES-16 Clean Window Infrared (10.3 µm) imagery at 15-minute intervals from 0100 UTC through 19 UTC on 29 June 2023.... Read More
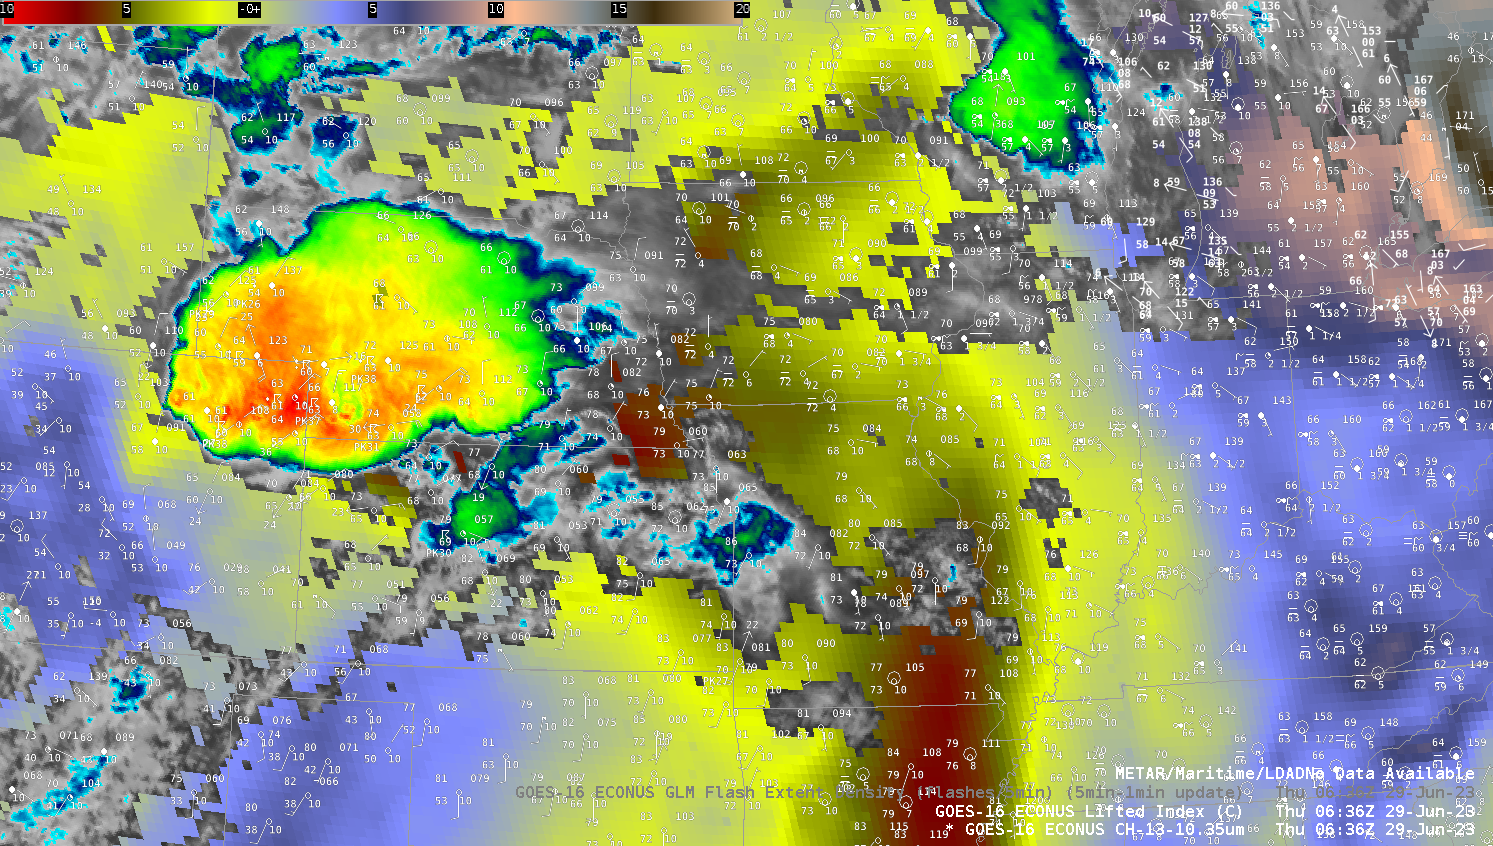
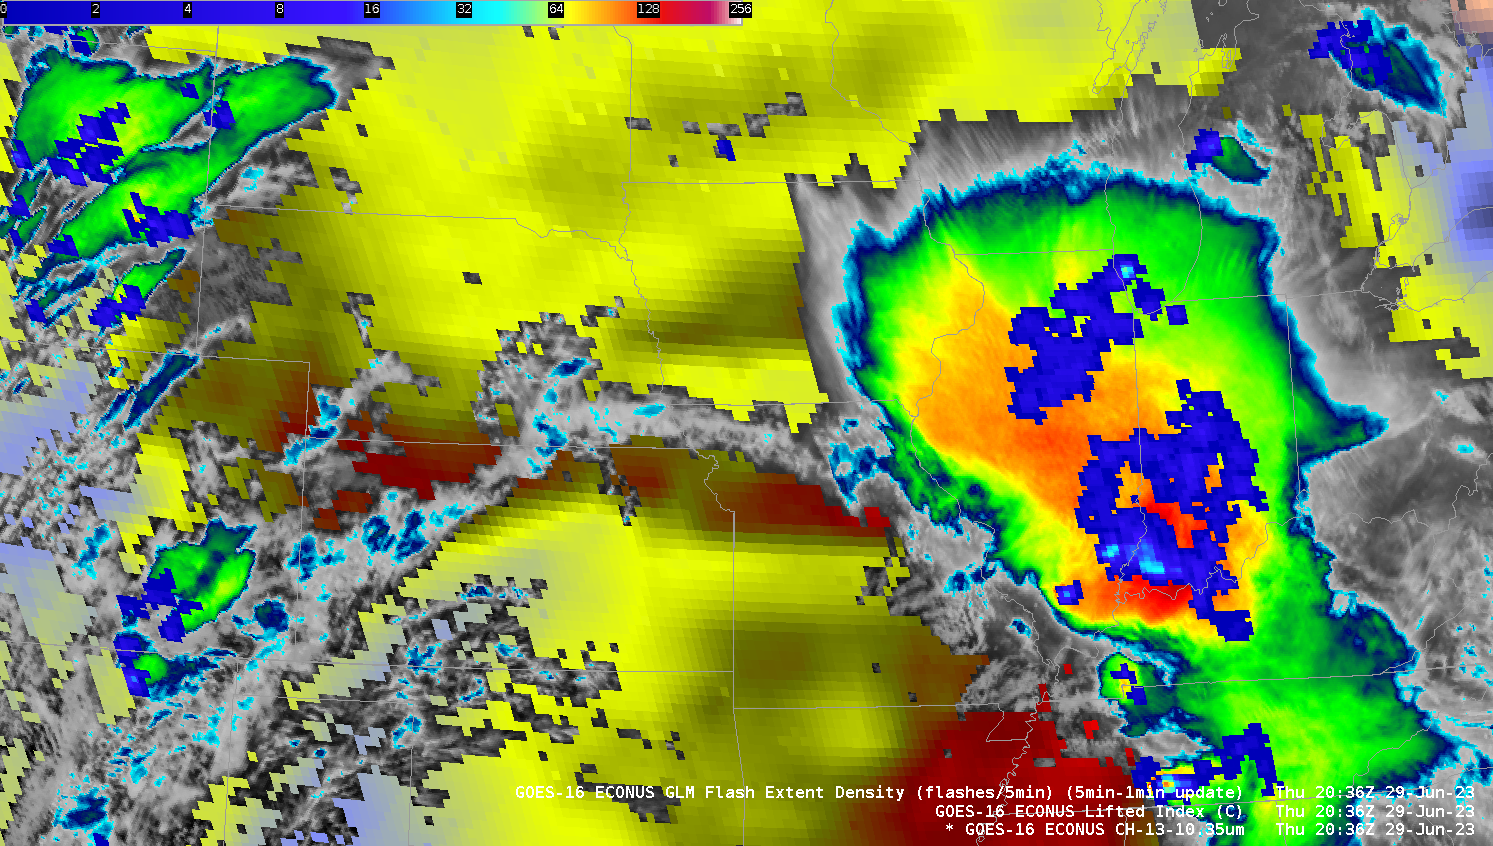
GOES-16 Clean Window (10.3 µm) Infrared imagery overlain on Derived Lifted Index, with 5-minute GLM Flash Extent Density 0051-2036 UTC on 29 June 2023 (Click to enlarge)
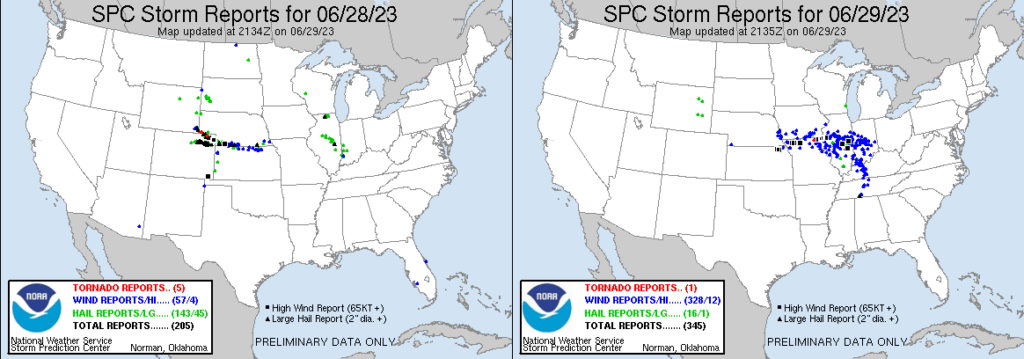
A long-lived mesoscale convective system (MCS) accompanied by strong winds at its leading edge, i.e., a Derecho, moved through the central US on 29 June 2023. The animation above shows GOES-16 Clean Window Infrared (10.3 µm) imagery at 15-minute intervals from 0100 UTC through 19 UTC on 29 June 2023. The imagery also includes 5-minute accumulations of Flash Extend Density from the Geostationary Lightning Mapper (GLM), and GOES-derived Lifted Indices. Of particular note is the corridor of instability over northern Kansas/southern Nebraska, and the large pool of instability of Illinois, that helped sustain the thunderstorms within the MCS as the feature propagated eastward. The system started as a supercell with a pronounced enhanced V as well (shown below) before evolving into an MCS overnight. Numerous reports of severe weather occurred on both 28 June and 29 June, as shown below.
Preliminary Storm Reports on 28 June (left) and 29 June 2023 (right) (Click to enlarge)
The high winds caused blow-over in some cornfields in central Illinois (near Farmer City in DeWitt County) to the west of Champaign-Urbana, as shown in this tweet from Andrew Pritchard. He also showed damage in Farmer City.
GOES-16 “Clean” Infrared Window (10.3 µm) images, with Local Storm Reports plotted in cyan (courtesy Scott Bachmeier, CIMSS) [click to play animated GIF | MP4]
1-minute Mesoscale Domain Sector GOES-16 “Clean” Infrared Window (10.3 µm) images around the beginning period (above) and the end period of the derecho event (below) include time-matched plots of Local Storm Reports. The earlier thunderstorms produced a few tornadoes in Nebraska/Colorado, hail as large as 4.00 inches in diameter in Wyoming/Colorado and wind gusts exceeding 80 mph in Colorado — while the later thunderstorms exhibited an impressive display of overshooting tops across Illinois (having cloud-top infrared brightness temperatures in the -80 to -86ºC range, shades of white embedded within darker black areas) as the MCS produced several wind gusts of 80 mph and higher.
GOES-16 “Clean” Infrared Window (10.3 µm) images, with Local Storm Reports plotted in cyan (courtesy Scott Bachmeier, CIMSS) [click to play animated GIF | MP4]
The storm that grew into this MCS had both an Enchanced-V structure, the accompanying warm trench, and an obvious Above-Anvil Cirrus Plume, all hallmarks of severity, as shown in the toggle below.
GOES-16 Clean Window (10.3 µm) Infrared imagery and Red Visible (0.64 µm) at 0151 UTC, 29 June 2023 (Click to enlarge)
Note that a corridor of instability remains along the Kansas/Nebraska border at the end of the animation up top, and as shown below. Convection is forming over the high plains of Colorado. Will convection follow a similar path on the 29th into the 30th?
GOES-16 Clean Window (10.3 µm) Infrared imagery overlain on Derived Lifted Index, with 5-minute GLM Flash Extent Density 2036 UTC on 29 June 2023 (Click to enlarge)
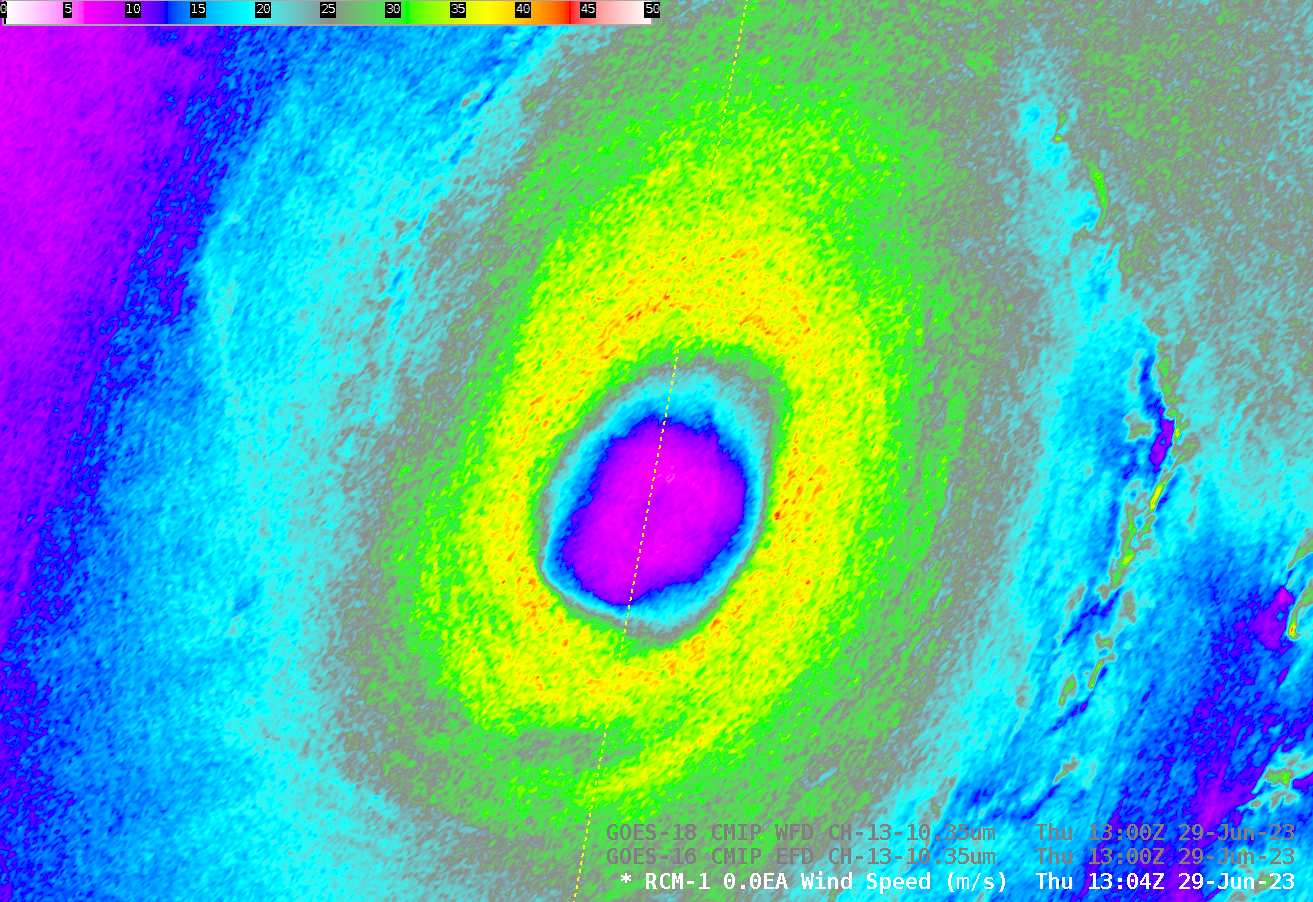
RCM1 overflew Hurricane Adrian (the 2nd latest-forming first tropical system of the eastern Pacific since the start of the satellite record) at 1300 UTC on 29 June 2023, as shown above. SAR winds derived from satellite data show a closed ring of 35- to 40-knot winds surrounding the eye. Adrian’s center at 15.9oN, 110oW in the 1300 UTC... Read More
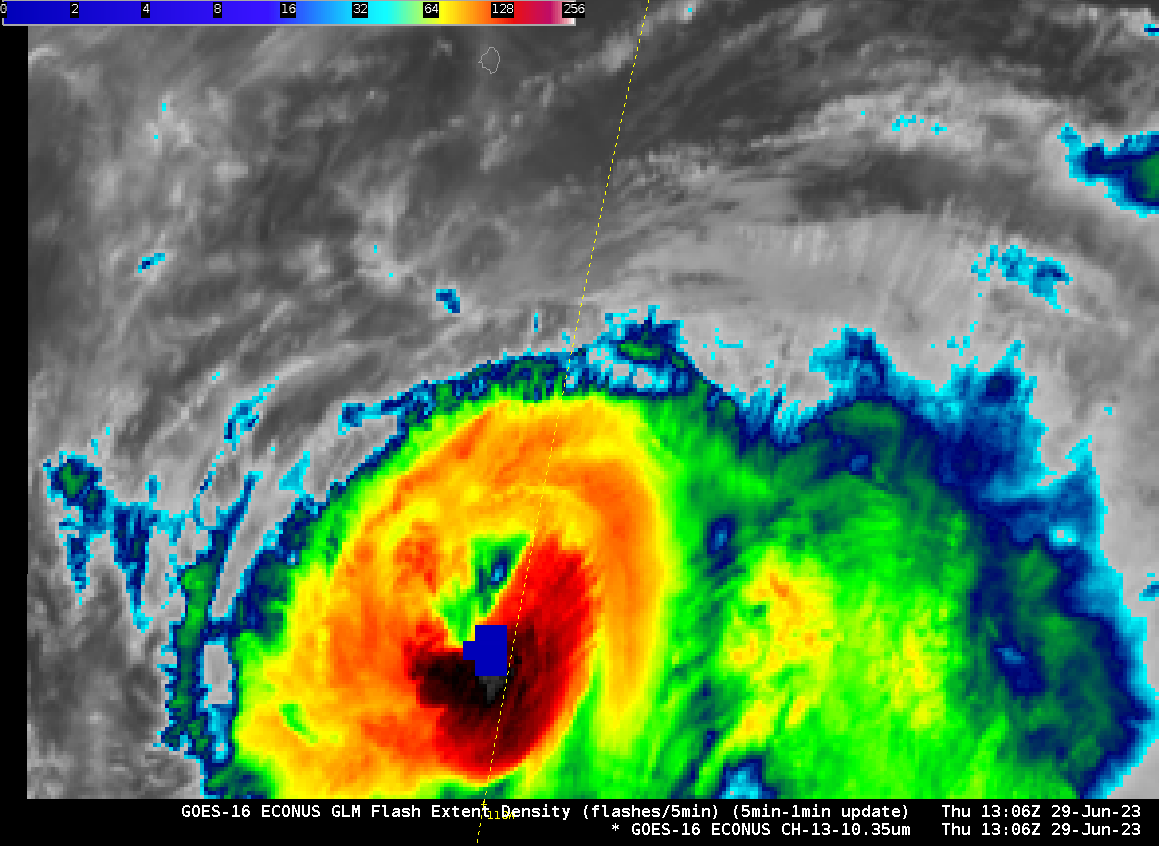
RCM1 overflew Hurricane Adrian (the 2nd latest-forming first tropical system of the eastern Pacific since the start of the satellite record) at 1300 UTC on 29 June 2023, as shown above. SAR winds derived from satellite data show a closed ring of 35- to 40-knot winds surrounding the eye. Adrian’s center at 15.9oN, 110oW in the 1300 UTC SAR image above is in the southwest corner of the GOES-16 CONUS sector, allowing for routine 5-minute scanning of the center. The animation below, from 1006 to 1641 UTC on 29 June, shows vigorous convection developing along the southern part of the eyewall. There’s even lightning detected at 1306 UTC. A distinct eye is not apparent in the GOES imagery. Given the distance between the storm and the GOES-16 sub-satellite point, viewers should be aware of the parallax shift in this image.
GOES-16 Band 13 Clean Window (10.3 µm) infrared imagery, 1001 – 1641 UTC on 29 June 2023
Adrian’s forecast takes the storm over progressively colder waters as shown below (imagery from the CIMSS Tropical Website). The storm is forecast to weaken as that happens.
Adrian’s track (past and forecast) and SST values (click to enlarge)
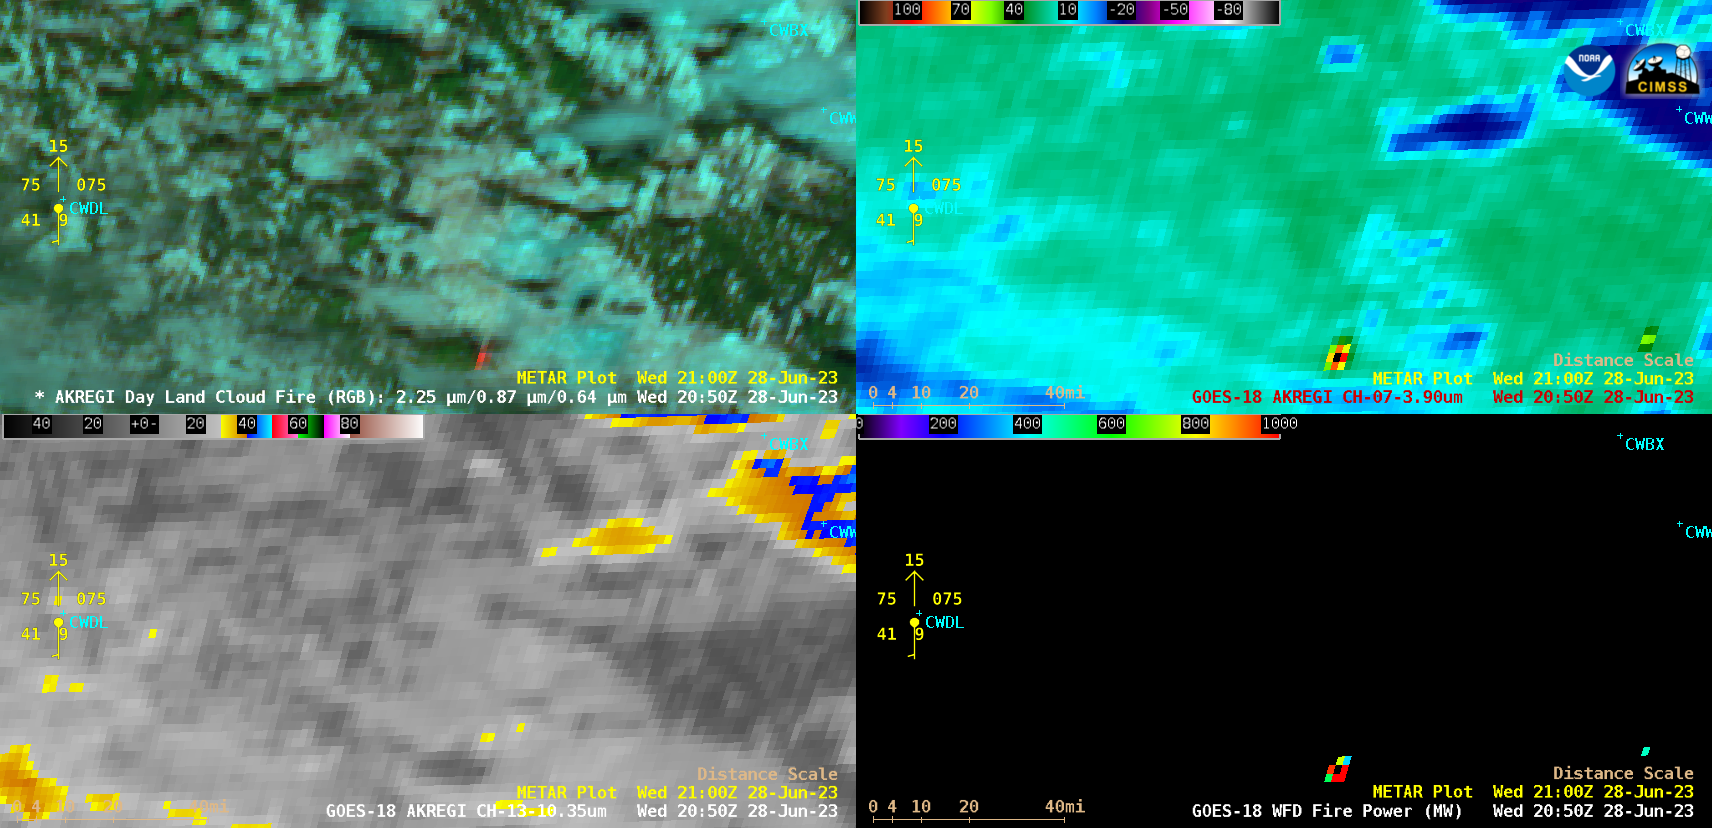
GOES-18 (GOES-West) Day Land Cloud Fire RGB, Shortwave Infrared (3.9 µm), “Clean” Infrared Window (10.3 µm) images along with the Fire Power derived product (a component of the GOES Fire Detection and Characterization Algorithm FDCA) (above) showed a wildfire southeast of Dease Lake (CWDL) in northern British Columbia that produced a pyrocumulonimbus (pyroCb) cloud late in the day... Read More
GOES-18 Day Land Cloud Fire RGB (top left), Shortwave Infrared (3.9 µm, top right), “Clean” Infrared Window (10.3 µm, bottom left) and Fire Power derived product (bottom right) [click to play animated GIF | MP4]
GOES-18 (GOES-West)Day Land Cloud Fire RGB, Shortwave Infrared (3.9 µm), “Clean” Infrared Window (10.3 µm) images along with the Fire Power derived product (a component of the GOES Fire Detection and Characterization Algorithm FDCA) (above) showed a wildfire southeast of Dease Lake (CWDL) in northern British Columbia that produced a pyrocumulonimbus (pyroCb) cloud late in the day on 28 June 2023.
The thermal signature of the wildfire exhibited 3.9 µm brightness temperatures as hot as 126.3ºC and Fire Power values as high as 2510 MW (both occurring at 2050 UTC). The pyroCB cloud exhibited cloud-top 10.3 µm infrared brightness temperatures as cold as -56.13ºC.
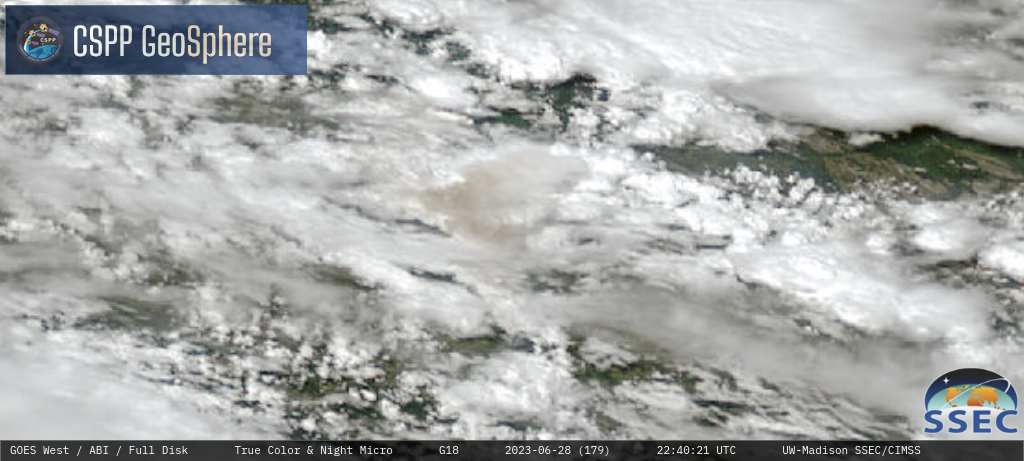
In GOES-18 True Color RGB images from the CSPP GeoSphere site (below), shades of tan to light brown helped to identify the smoke-laden anvil of the pyroCb as it drifted northward.
GOES-18 True Color RGB images [click to play MP4 animation]


