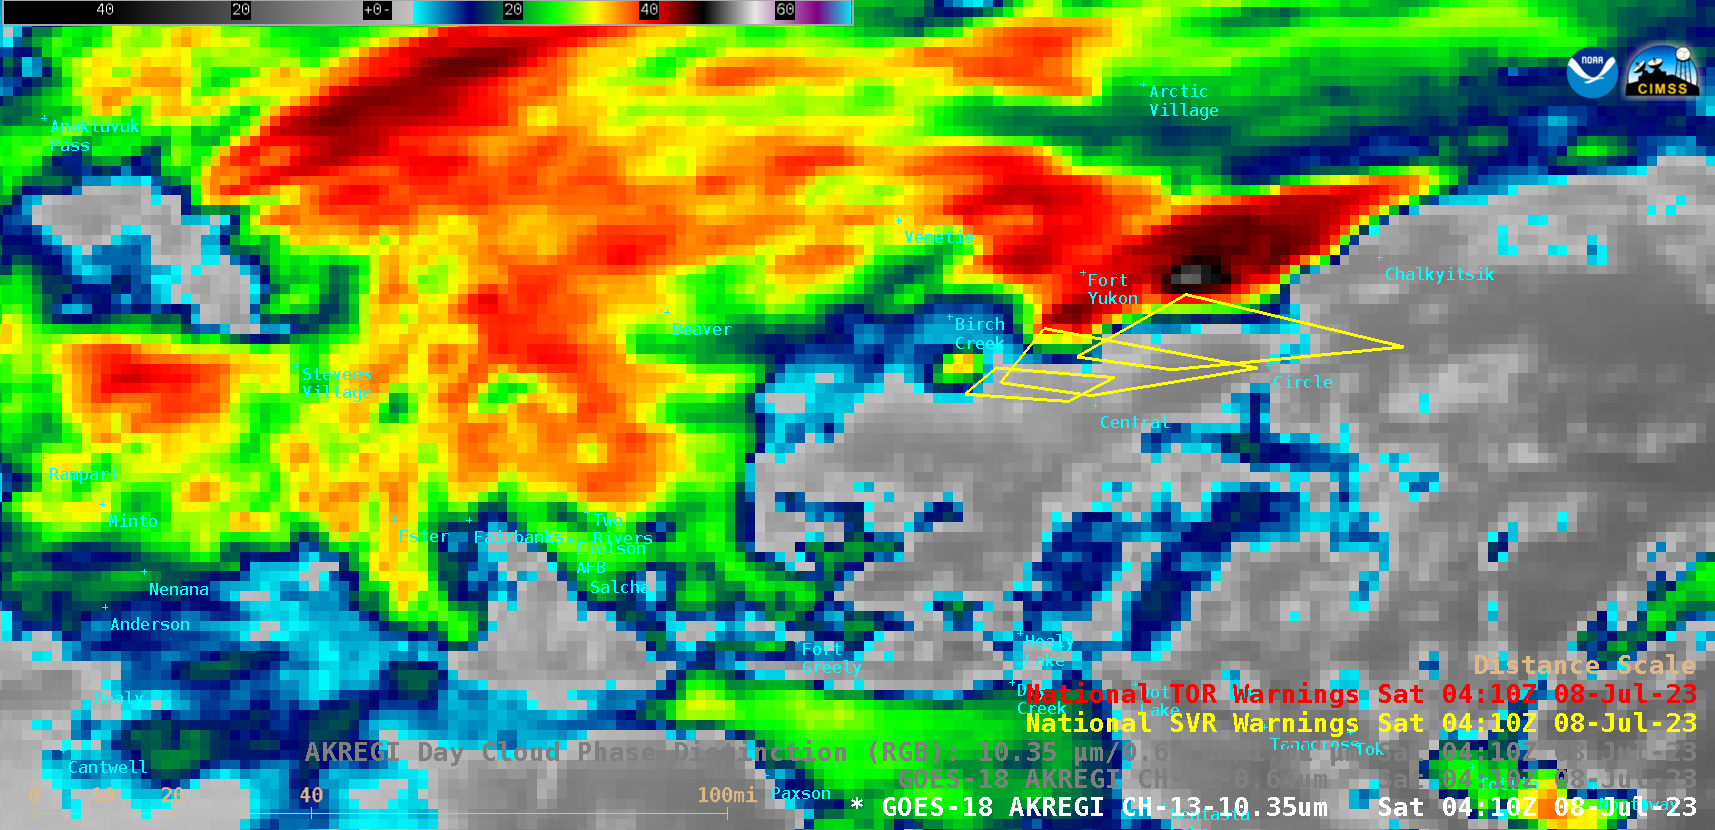
GOES-18 (GOES-West) “Clean” Infrared Window (10.3 µm) and “Red” Visible (0.64 µm) images (above) included plots of the 15 Severe Thunderstorm Warning polygons issued by NWS Fairbanks on 07 July 2023 — which was a record number of warnings issued by that forecast office for a single calendar day. The coldest cloud-top 10.3... Read More

GOES-18 “Clean” Infrared Window (10.3 µm) and “Red” Visible (0.64 µm) images, with Severe Thunderstorm Warning polygons plotted in yellow [click to play animated GIF | MP4]
GOES-18
(GOES-West) “Clean” Infrared Window (
10.3 µm) and “Red” Visible (
0.64 µm) images
(above) included plots of the 15 Severe Thunderstorm Warning polygons issued by
NWS Fairbanks on 07 July 2023 — which was a record number of warnings issued by that forecast office for a single calendar day. The coldest cloud-top 10.3 µm infrared brightness temperatures were -51C — which corresponded to an altitude around 36,000 feet, according to 0000 UTC
rawinsonde data from Fairbanks
(below).
Plot of rawinsonde data from Fairbanks at 0000 UTC on 08 July [click to enlarge]
GOES-18 “Clean” Infrared Window (10.3 µm) image at 0410 UTC [click to enlarge]
Recall that when viewing geostationary imagery at high latitudes,
parallax must be taken into account — for example, the cold overshooting top east of Fort Yukon seen on the 0410 UTC image
(above) was actually located over a point about 35 km (22 miles) to the south-southeast
(below), placing it closer to Circle.
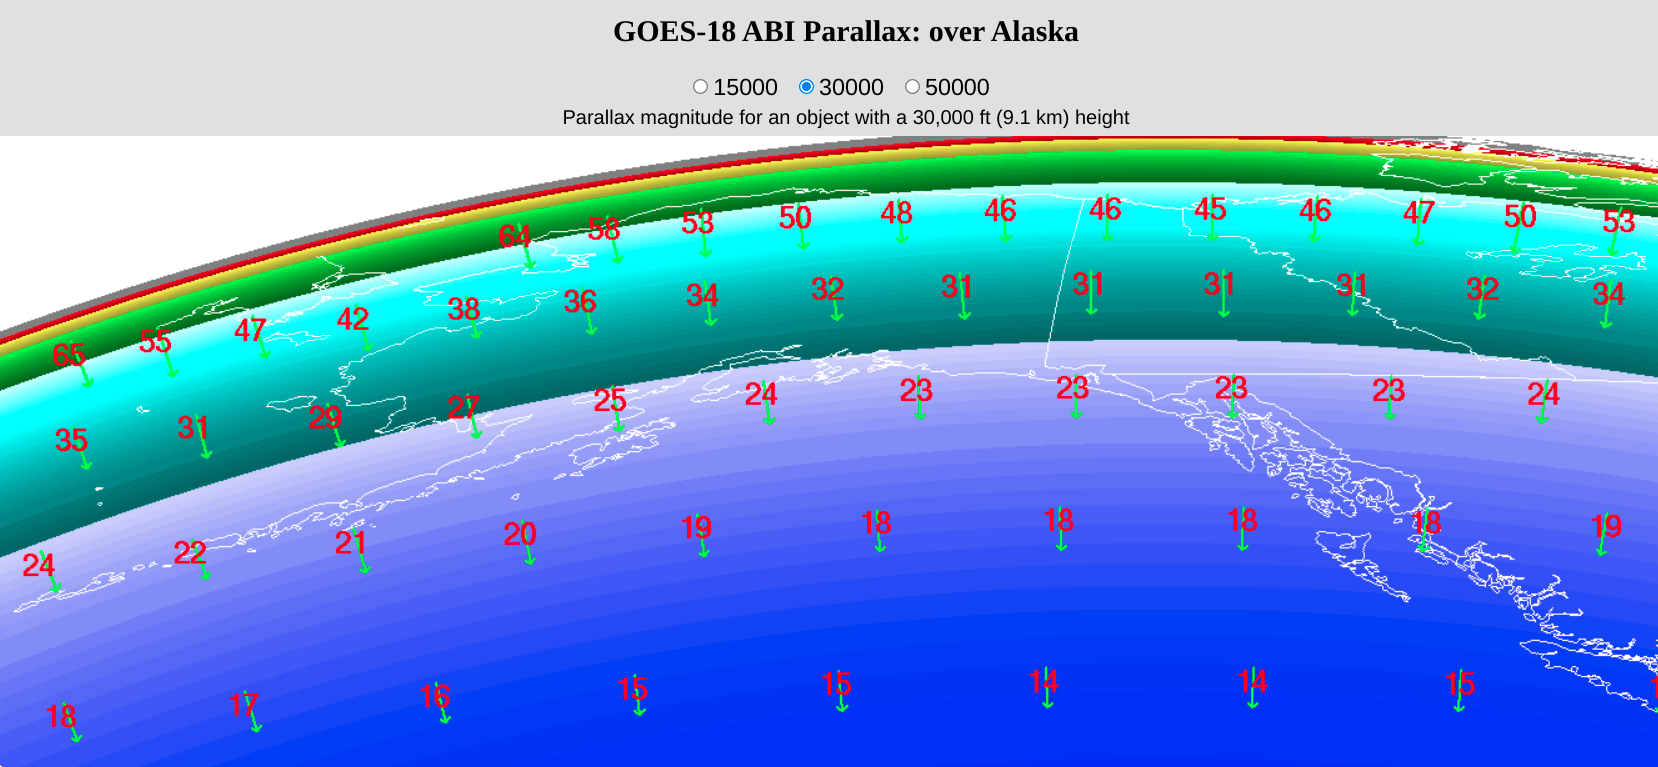
GOES-18 parallax correction vector (green) and magnitude (in km, red) for a cloud-top feature at a height of 9.1 km (30,000 feet) [click to enlarge]
In GOES-18
Day Cloud Phase Distinction RGB images
(below), developing cumulus clouds that were beginning to glaciate exhibited shades of green. Given that many of these thunderstorms occurred in rather remote areas, verification was difficult — but there was one report of
tree damage in Chalkyitsik.
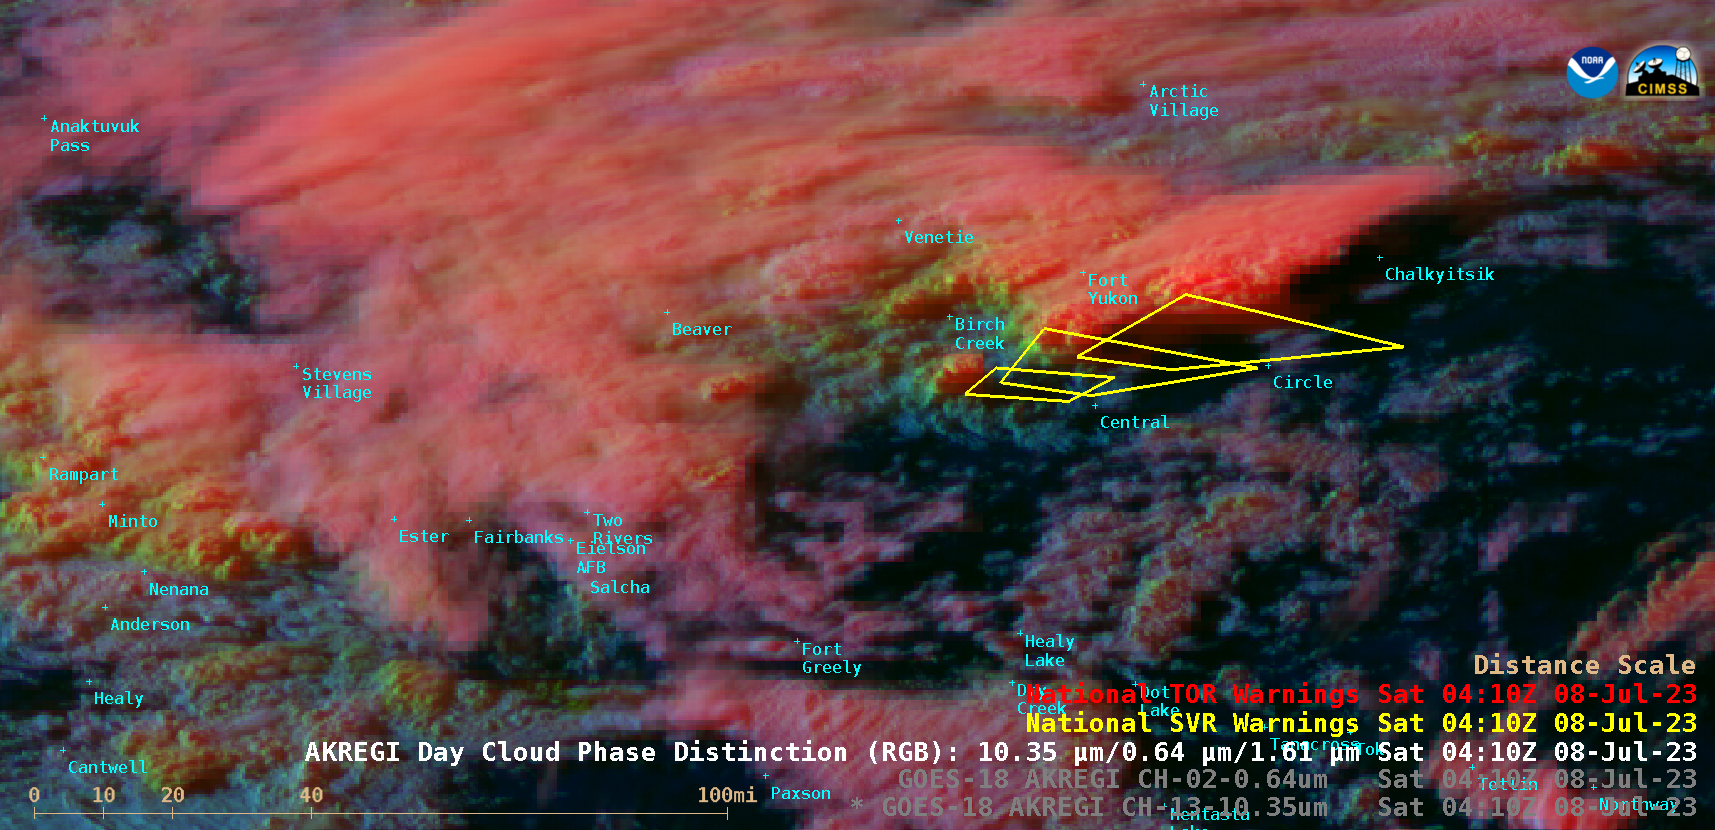
GOES-18 Day Cloud Phase Distinction RGB images, with Severe Thunderstorm Warnings plotted in yellow [click to play animated GIF | MP4]
View only this post
Read Less


