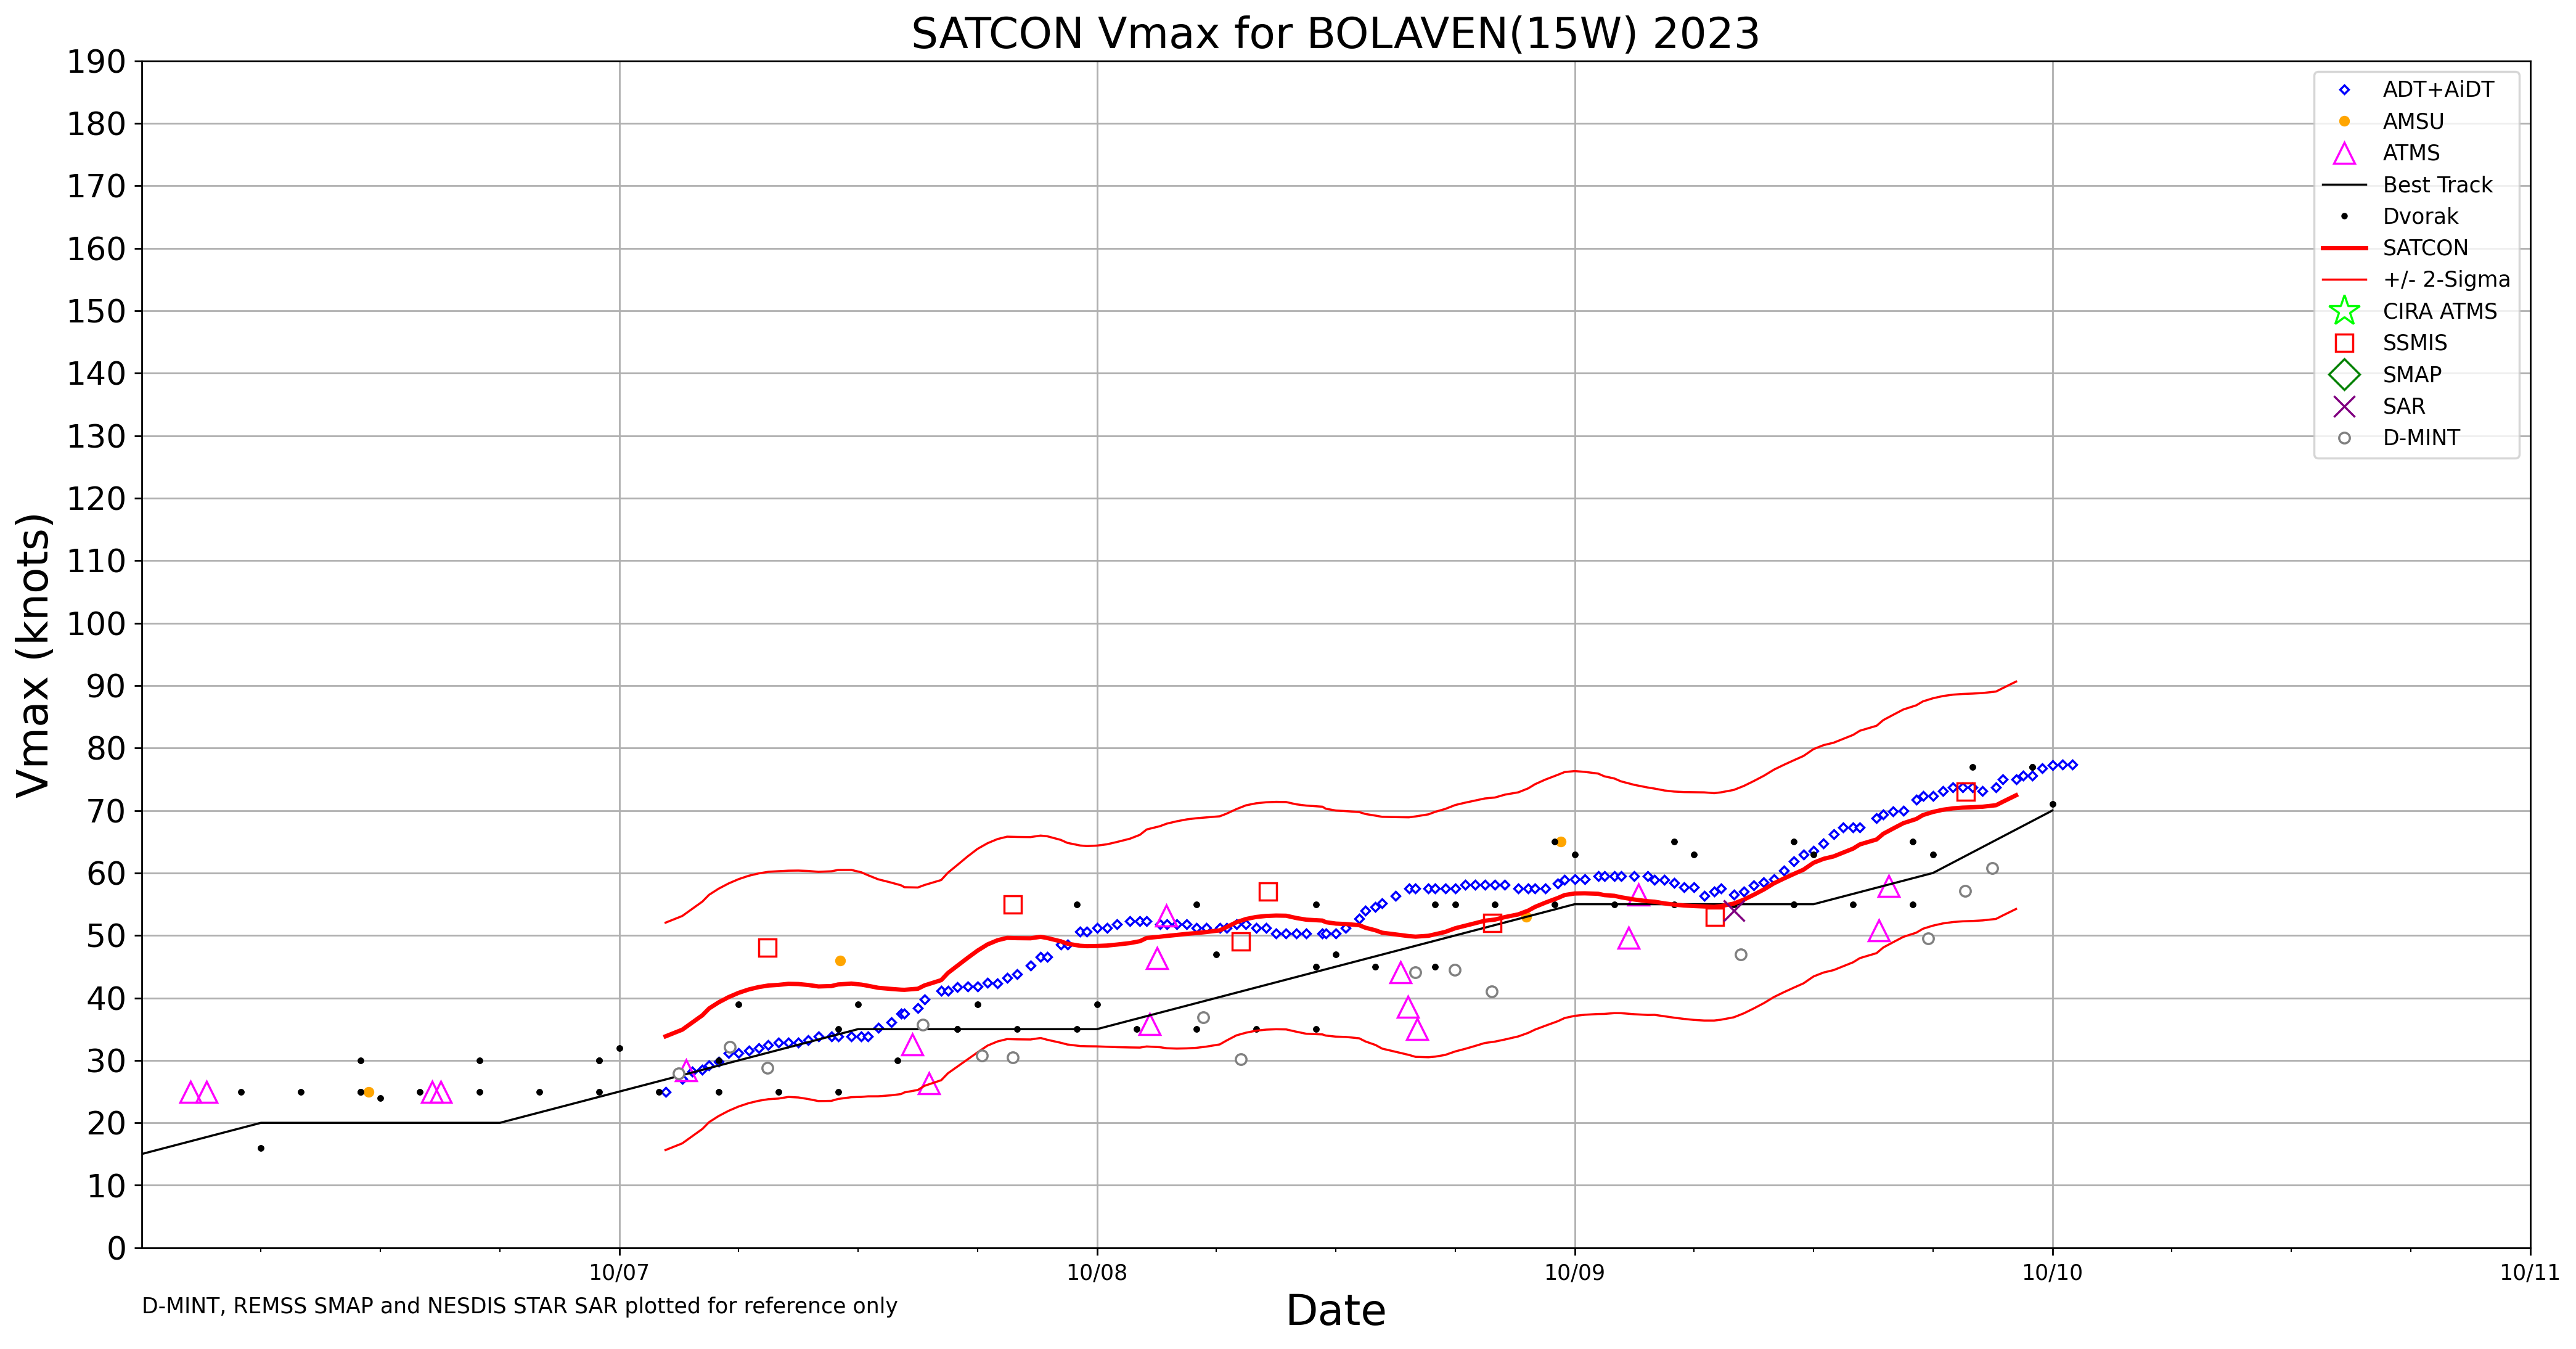
Target Sector (2.5-minute interval) JMA Himawari-9 AHI Clean Infrared Window (10.4 µm) images (above) and Red Visible (0.64 µm) mages (below) showed Tropical Storm Bolaven as it intensified to become a Category 1 Typhoon just southeast of the Mariana Islands at 0000 UTC (SATCON | JTWC advisory) on 10 October 2023. The coldest cloud-top infrared brightness temperatures, associated with... Read More
JMA Himawari-9 Clean Infrared Window (10.4 µm) images, from 2012 UTC on 09 October to 0752 UTC on 10 October [click to play animated GIF | MP4]
(2.5-minute interval)
JMA Himawari-9
AHI Clean Infrared Window (10.4 µm) images
(above) and Red Visible (0.64 µm) mages
(below) showed Tropical Storm Bolaven as it intensified to become a Category 1 Typhoon just southeast of the
Mariana Islands at 0000 UTC (
SATCON |
JTWC advisory) on 10 October 2023. The coldest cloud-top infrared brightness temperatures, associated with brief
vortical hot towers within the Central Dense Overcast of Bolaven, were around -90ºC (yellow pixels embedded within dark purple areas).
JMA Himawari-9 Red Visible (0.64 µm) images, from 2012 UTC on 09 October to 0752 UTC on 10 October [click to play animated GIF | MP4]
JMA Himawari-9 Red Visible (0.64 µm) and Clean Infrared Window (10.4 µm) images at 0322 UTC on 10 October [click to enlarge]
One of the more notable vortical hot towers (VHTs) occurred just southeast of the island of
Rota at 0322 UTC on 10 October, as seen in a toggle between Himawari-9 Red Visible (0.64 µm) and Clean Infrared Window (10.4 µm) images
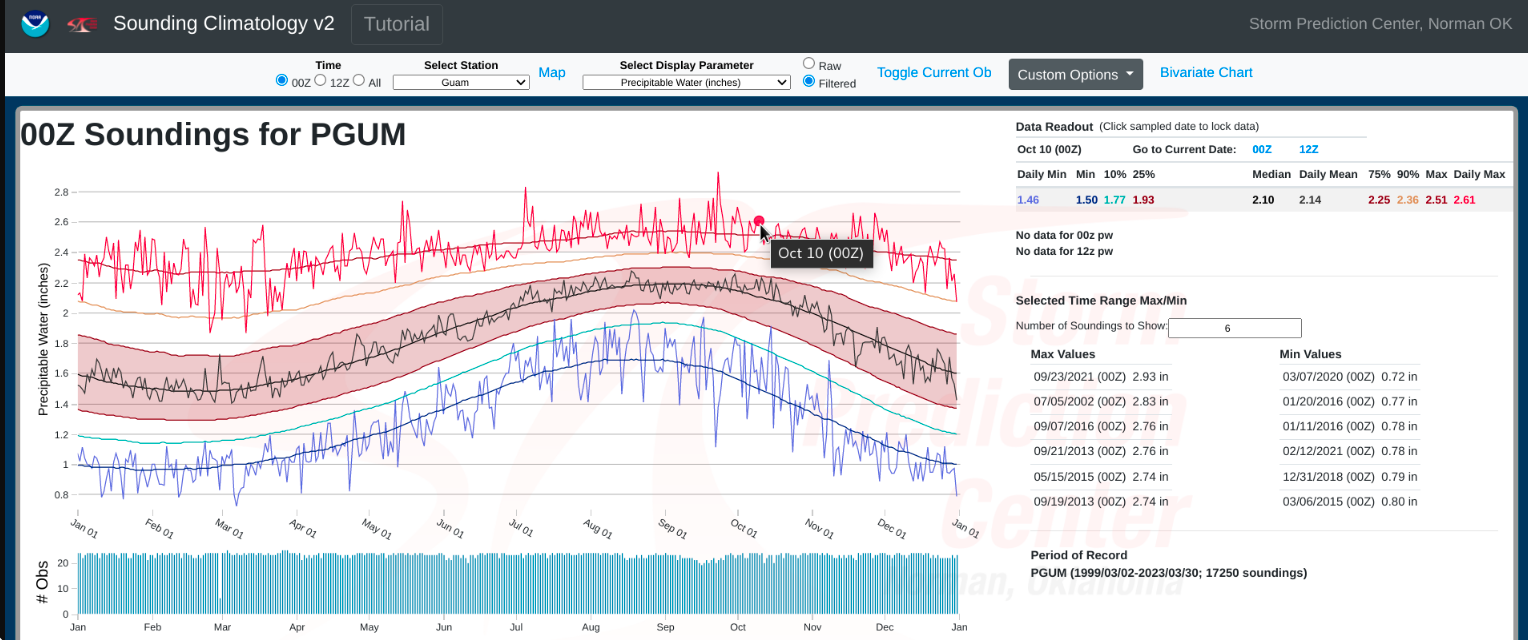
(above). The coldest infrared brightness temperature within the VHT cluster of yellow pixels was -94ºC; that temperature represented a significant air parcel overshoot of the local tropopause — which was -81.9ºC at 106 hPa, as seen in a plot of 0000 UTC rawinsonde data from Guam
(below). On a side note, the Total Precipitable Water (PW) value of
2.74 in analyzed from that sounding was a
record high value for 0000 UTC soundings on 10 October (the previous record was 2.61 in).
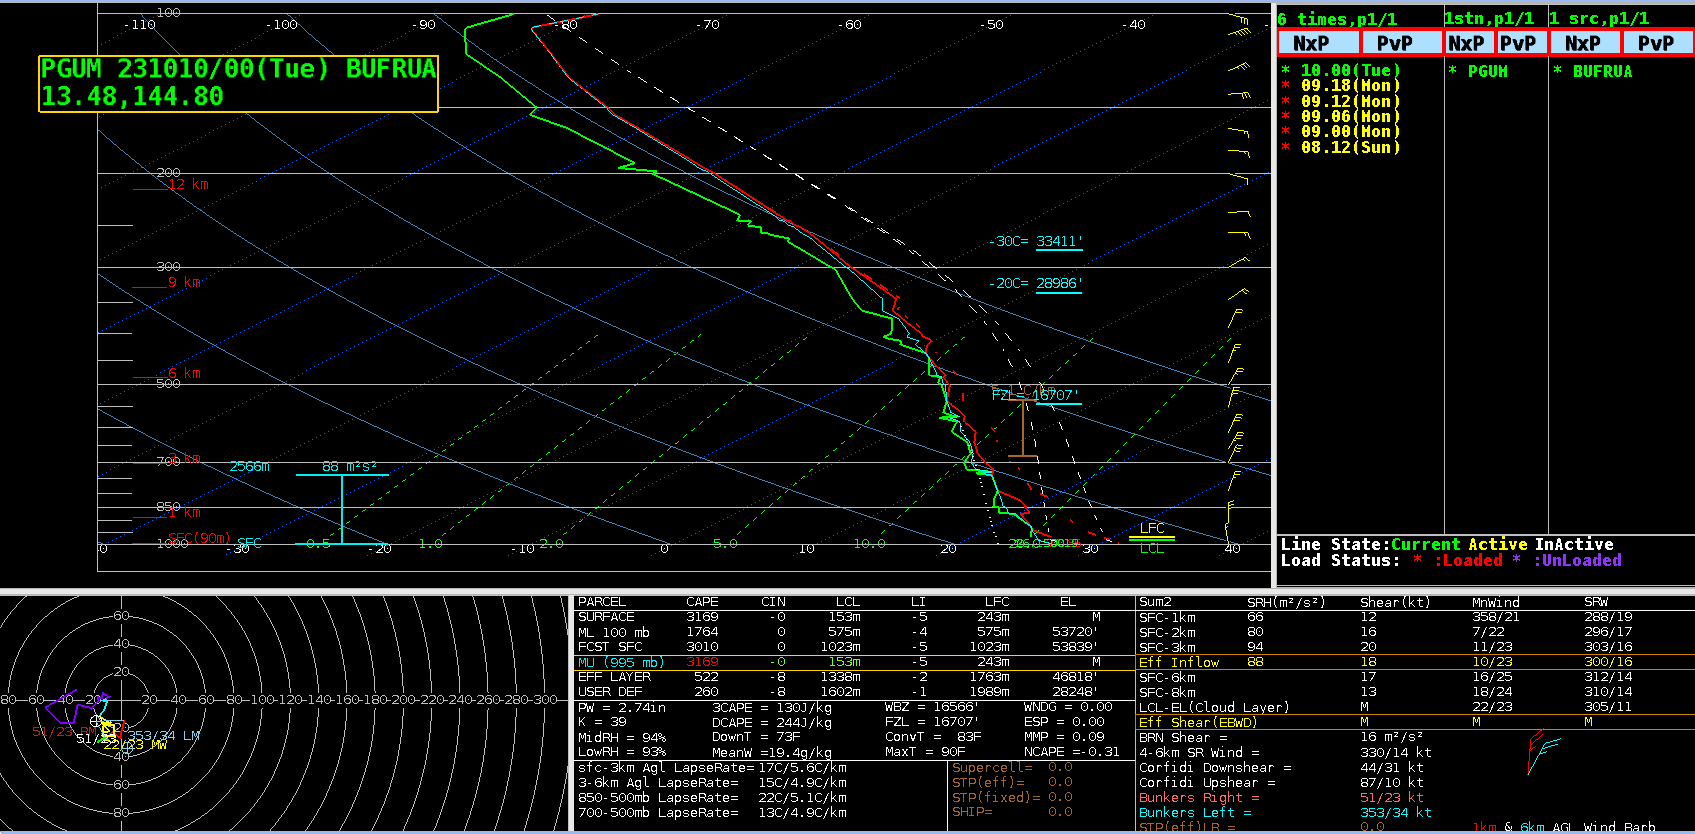
Plot of rawinsonde data from Guam at 0000 UTC on 10 October [click to enlarge]
Himawari-9 Infrared Window (11.2 µm) images from the
CIMSS Tropical Cyclones site
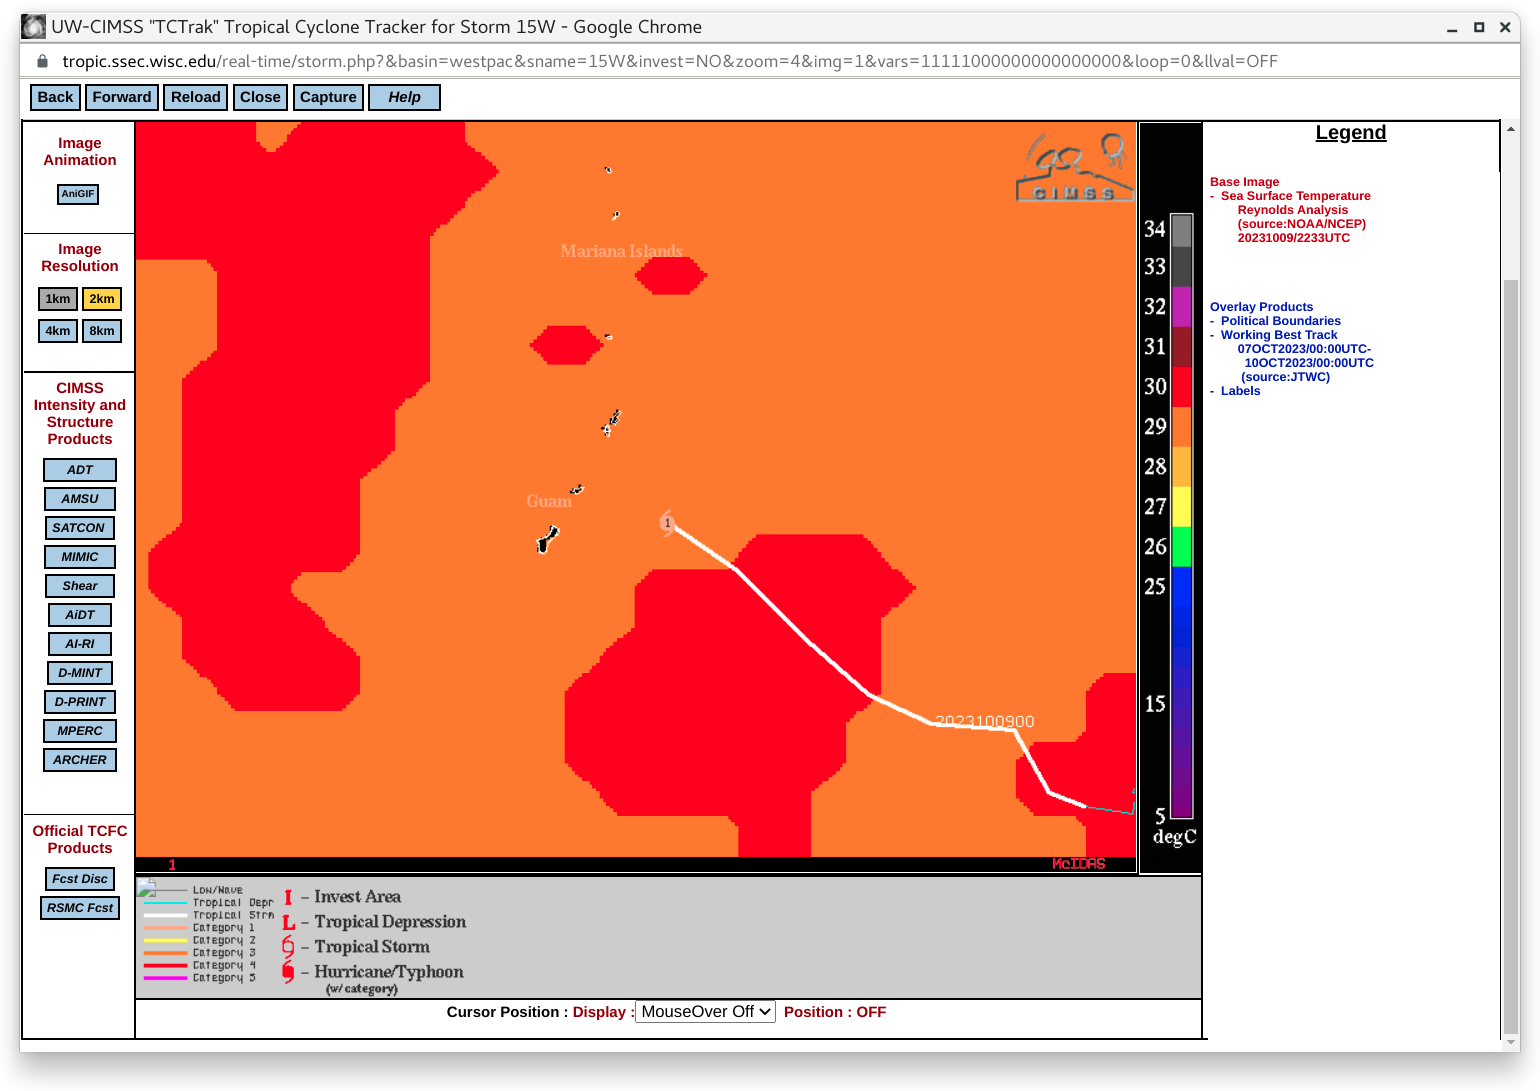
(below) showed that Bolaven was moving through an environment of low
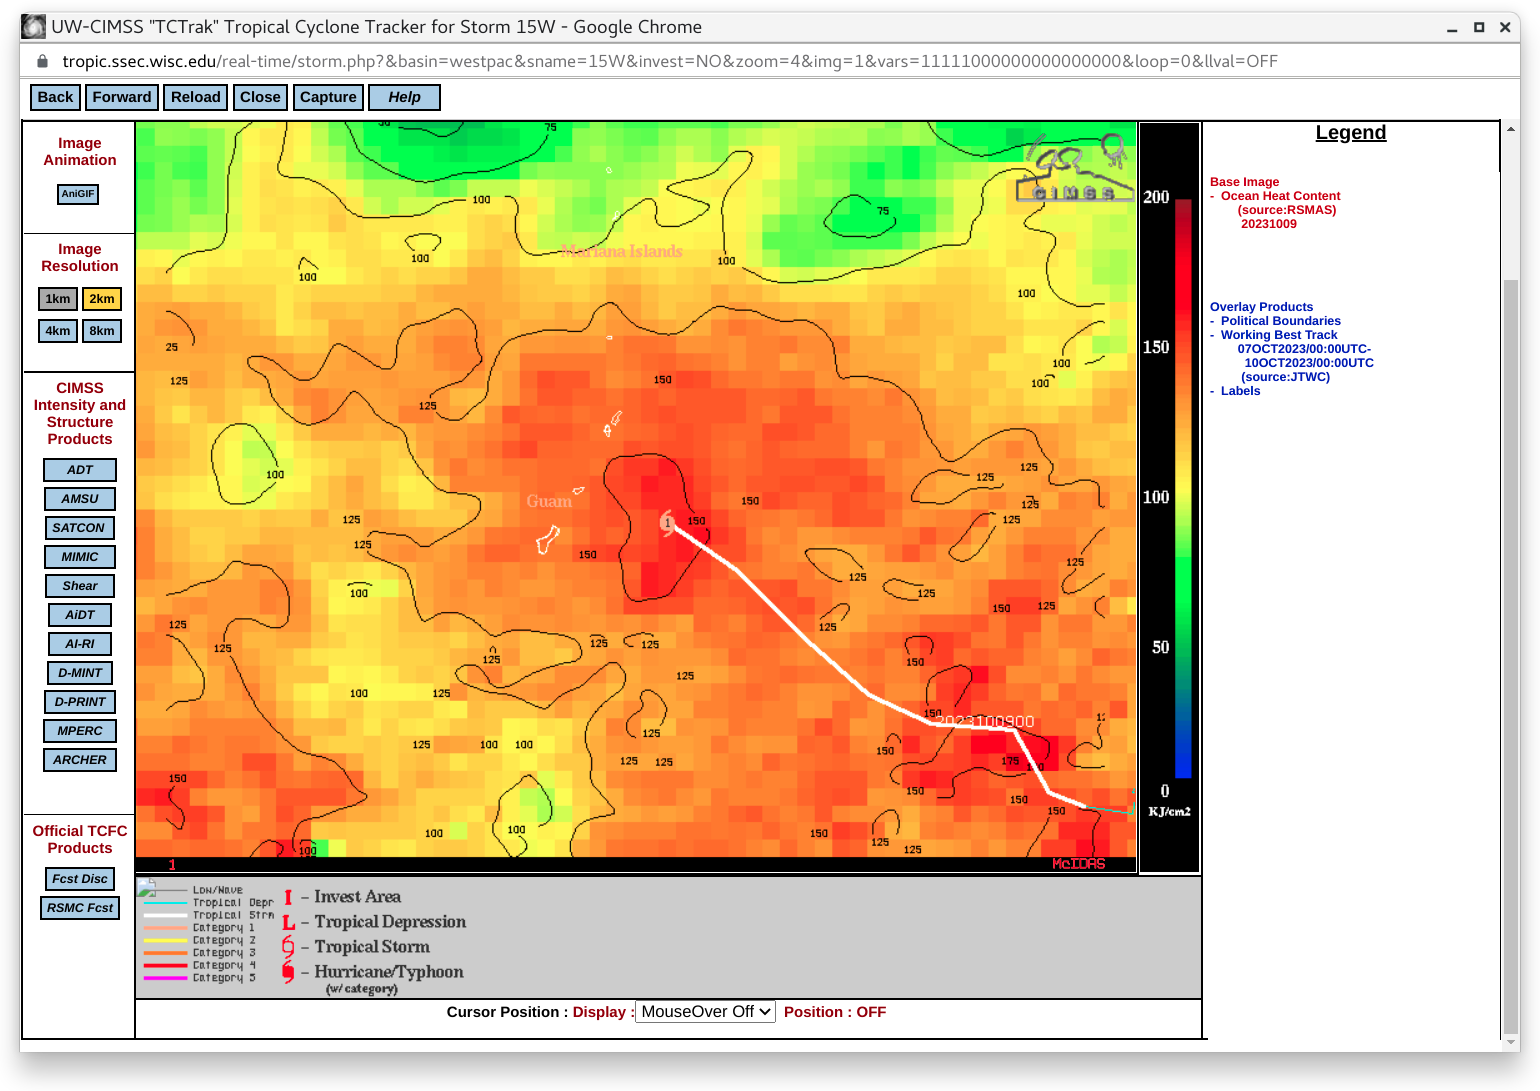
deep-layer wind shear — which, in addition to its motion across warm water (
SST |
OHC), favored continued intensification.
JMA Himawari9 Infrared Window (11.2 µm) images, with an overlay of deep-layer wind shear at 0000 UTC [click to enlarge]
View only this post
Read Less


