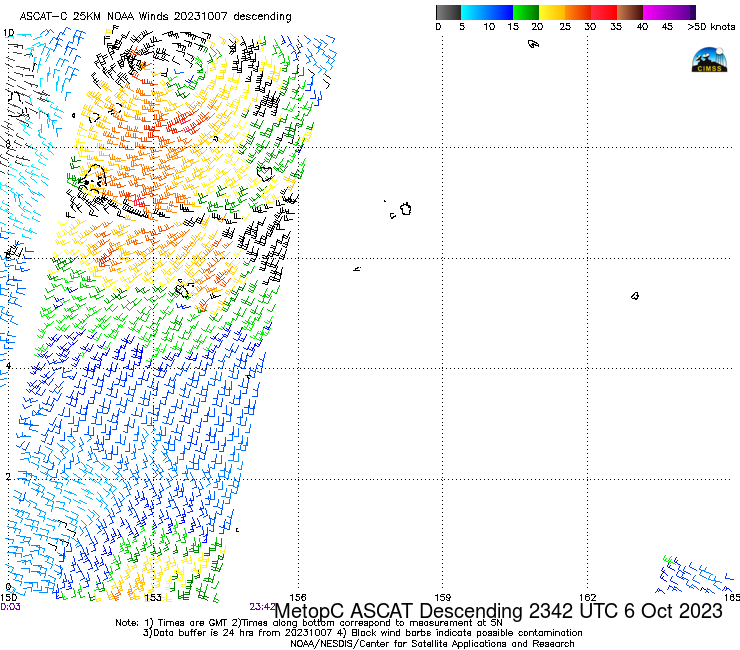
This website works best with a newer web browser such as Chrome, Firefox, Safari or Microsoft Edge. Internet Explorer is not supported by this website.

SAR data over Tropical Cyclone Freddy in the Indian Ocean

RADARSAT Constellation Mission Satellite 1 (RCM-1) overflew tropical cyclone Freddy in the eastern Indian Ocean on 9 February, and Synthetic Aperture Radar (SAR) winds from the satellite captured a well-developed eye with (instantaneous) surface winds that peaked around 25 m/s. More information on SAR winds with Freddy is available here. The toggle above shows the storm center displaced significantly to the east... Read More

Himawari-9 Clean Window infrared (10.41 µm) imagery, and SAR winds from RCM-1, 1110 UTC on 9 February 2023 (Click to enlarge)

RADARSAT Constellation Mission Satellite 1 (RCM-1) overflew tropical cyclone Freddy in the eastern Indian Ocean on 9 February, and Synthetic Aperture Radar (SAR) winds from the satellite captured a well-developed eye with (instantaneous) surface winds that peaked around 25 m/s. More information on SAR winds with Freddy is available here. The toggle above shows the storm center displaced significantly to the east of the coldest cloud tops. Freddy was experiencing shear (see the 1800 UTC shear analysis below taken from the CIMSS Tropical Website) that may have helped to cause this displacement, but parallax error in the Himawari-9 imagery likely also has an affect. (This website shows the parallax error for Himawari-9 imagery).

1800 UTC 9 February 2023 850-200 mb shear analysis over Freddy (Click to enlarge)

More information on Freddy is available from the Joint Typhoon Warning Center.


A second overpass (RCM-3) later at 2200 UTC 9 February showed significantly stronger winds — 50 m/s! — that were more centered underneath the Central Dense Overcast, suggesting weaker shear. Indeed, the Shear Analysis (at bottom, showing shear at 1500 UTC 9 February and 0000 UTC 10 February) showed weakening shear over the storm.

Himawari-9 Clean Window infrared (10.41 µm) imagery, and SAR winds from RCM-3, 2220 UTC on 9 February 2023 (Click to enlarge)
850-200 mb shear analysis, 1500 UTC on 9 February and 0000 UTC on 10 February 2023 (Click to enlarge)

The toggle below compares the derived winds from RCM1 at 1111 UTC and from RCM3 at 2220 UTC with the same color enhancement, and over the same domain. Significant strengthening is shown!

Derived SAR winds over Cyclone Freddy, 1111 UTC (from RCM1) and 2220 UTC (from RCM3) on 9 February 2023 (Click to enlarge)

SAR observations continued as Freddy intensified to a Category 4 storm (blog post). The animation below shows five images between 9 and 12 February 2023.

Himawari-9 Clean Window infrared (Band 13, 10.41 µm) imagery during the times of SAR overpasses (Click to enlarge)

The imagery below shows the 5 scenes from above, but zoomed in so that maximum wind speeds can be identified. Note that some of the windspeeds are in knots, and some are in m/s. The color enhancement has been altered so that the windspeed to color association is similar. SAR Winds and diagnoses for Freddy are available here.

SAR Winds overlain on top of Band 13 Himawari-9 (Clean window, 10.41 µm) imagery, 9-12 February 2023. (Click to enlarge)

Late on 13 February, RCM2 overflew Freddy and produced the wind scene shown below in a toggle with Himawari-9 Clean window imagery. Note that the limb of the Himawari scene is showing up in this image. Parallax errors in the Himawari-9 imagery (compared to the surface-based SAR imagery) will increase as the storm moves closer to Africa. A zoomed-in view of the SAR winds is available here.

SAR Winds overlain on top of Band 13 Himawari-9 (Clean window, 10.41 µm) imagery, 2320 UTC on 13 February 2023 (Click to enlarge)

Another overpass occurred at 1224 UTC on 14 February. Two toggles are shown below; the effects of the parallax shift in the Himawari-9 imagery become more and more apparent!

SAR Winds overlain on top of Band 13 Himawari-9 (Clean window, 10.41 µm) imagery, 1224 UTC on 14 February 2023 (Click to enlarge)
SAR Winds overlain on top of Band 13 Himawari-9 (Clean window, 10.41 µm) imagery, 1224 UTC on 14 February 2023, zoomed in over the eye (Click to enlarge)

RCM2 SAR winds from 2330 UTC on 14 February are shown below, and the parallax shift is readily apparent. Click here to view a zoomed-in SAR analysis over the eye.

SAR Winds from RCM2 overlain on top of Band 13 Himawari-9 (Clean window, 10.41 µm) imagery, 2330 UTC on 14 February 2023 (Click to enlarge)

View only this post Read Less

Snow squalls in Wyoming and Colorado

1-minute Mesoscale Domain Sector GOES-18 (GOES-West) “Clean” Infrared Window (10.3 µm) images (above) showed the colder cloud tops (shades of green) associated with snow squalls that moved east-southeastward across parts of far southern Wyoming and northern/central Colorado late in the day on 08 February 2023. Plots of 15-minute METAR surface reports indicated how... Read More

GOES-18 “Clean” Infrared Window (10.3 µm) images, with 15-minute METAR surface reports plotted in yellow [click to play animated GIF | MP4]

1-minute Mesoscale Domain Sector GOES-18 (GOES-West) “Clean” Infrared Window (10.3 µm) images (above) showed the colder cloud tops (shades of green) associated with snow squalls that moved east-southeastward across parts of far southern Wyoming and northern/central Colorado late in the day on 08 February 2023. Plots of 15-minute METAR surface reports indicated how quickly the visibility fluctuated at sites where the snow squalls passed overhead.

View only this post Read Less

Tropical Cyclone Gabrielle in the Coral Sea

Himawari-9 Upper Level Water Vapor infrared (6.25 µm) imagery for the 8 hours ending 1300 UTC on 8 February 2023 show the nighttime blossoming of convection near the center of developing tropical cyclone Gabrielle to the east of Australia in the tropical southwest Pacific. The environment of the storm is... Read More

Himawari-9 Band 8 (“Upper Level Water Vapor”) infrared (6.25 µm) imagery, Hourly from 0600 to 1300 UTC on 8 February 2023 (Click to enlarge)

Himawari-9 Upper Level Water Vapor infrared (6.25 µm) imagery for the 8 hours ending 1300 UTC on 8 February 2023 show the nighttime blossoming of convection near the center of developing tropical cyclone Gabrielle to the east of Australia in the tropical southwest Pacific. The environment of the storm is favorable to strengthening: the Band 8 imagery above shows little dry air near the storm center, and a toggle with the Band 10 (7.34 µm) infrared imagery at 1200 UTC similarly shows little dry air.

Himawari-9 Upper and Lower level water vapor infrared imagery (Bands 8 and 10, 6.25 µm and 7.34 µm, respectively) at 1200 UTC on 8 February 2023 (Click to enlarge)

MIMIC Total Precipitable Water fields (from this site) also show an atmosphere rich in moisture where Gabrielle is developing.

MIMIC Total Precipitable Water, 1500 UTC 7 February – 1400 UTC 8 February 2023 (click to enlarge)

Analyses from the CIMSS Tropical Website, show an environment that supports development. SSTs in the region are warm, shear values are low, low-level convergence and upper level divergence are all strong, as shown in the toggle below. Indeed, many numerical models predict Gabrielle to strengthen as it moves southeastward through the Coral Sea between Australia to the west and New Caledonia to the east.

Predicted bath of Tropical Cyclone Gabrielle, SST analysis, 850-200 mb shear analysis, 850-mb convergence, 200-mb divergence, 1200 UTC on 8 February 2023 (Click to enlarge)

Added: 10 February. RCM-1 overflew the western half of Gabrielle at 0800 UTC on 10 February, and the SAR Wind analysis (the colorbar ranges from 0-60 m/s), below, shows maximum wind speeds a bit stronger than 30 m/s.

Himawari-9 Clean Window infrared imagery (Bands 13, 10.41 µm) and RCM1 wind speed analysis, 0800 UTC on 10 February 2023 (Click to enlarge)

View only this post Read Less

Clear skies over the western Great Lakes

Predominantly clear skies and a waning Full Moon (the Full Moon was on 5 February) allowed for both Day Night Band imagery of the surface and Advanced Clear-Sky Processing for Ocean (ACSPO) sea-surface temperature (SST) fields using VIIRS data downloaded at the CIMSS Direct Broadcast antenna (and processed using CSPP... Read More

VIIRS Visible (0.7 µm) Imagery (Dynamic Day Night Band) and ACSPO SST analysis, 0800 UTC 0n 8 February 2023 (Click to enlarge)

Predominantly clear skies and a waning Full Moon (the Full Moon was on 5 February) allowed for both Day Night Band imagery of the surface and Advanced Clear-Sky Processing for Ocean (ACSPO) sea-surface temperature (SST) fields using VIIRS data downloaded at the CIMSS Direct Broadcast antenna (and processed using CSPP and Polar2Grid software). The toggle above shows the Day Night Band image (there are some clouds over eastern Lake Superior, and ice is apparent near/around the Apostle Islands and along the Wisconsin and western Upper Peninsula shorelines) with and without an overlain SST analysis over Lake Superior. SST values over Superior range from 32o F (white in the enhancement) to a brisk 37o F (green in the enhancement). Of interest in the SST analysis is the surface front extending to the northeast of Keewenaw Point: Green values to the east are just above 37o F; cyan values to the west are cooler than 36o F.

Day Night Band and ACSPO SSTs over Lake Superior, 0800 UTC on 8 February 2023 (Click to enlarge)

Fewer clouds were obvious over Lake Michigan. Lake Michigan is shows warmer surface temperatures, near 40o F (red enhancement) to the northeast of Chicago. Note the presence of ice over Green Bay.

VIIRS Day Night Band visible (0.70 µm) imagery and ACSPO SST analysis over Lake Michigan, 0800 UTC on 8 February 2023 (Click to enlarge)

You can also view imagery over the Great Lakes at the CIMSS VIIRS Imagery Viewer that packages imagery from the CIMSS Direct Broadcast site.

View only this post Read Less