Severe thunderstorms in the Central Valley of California

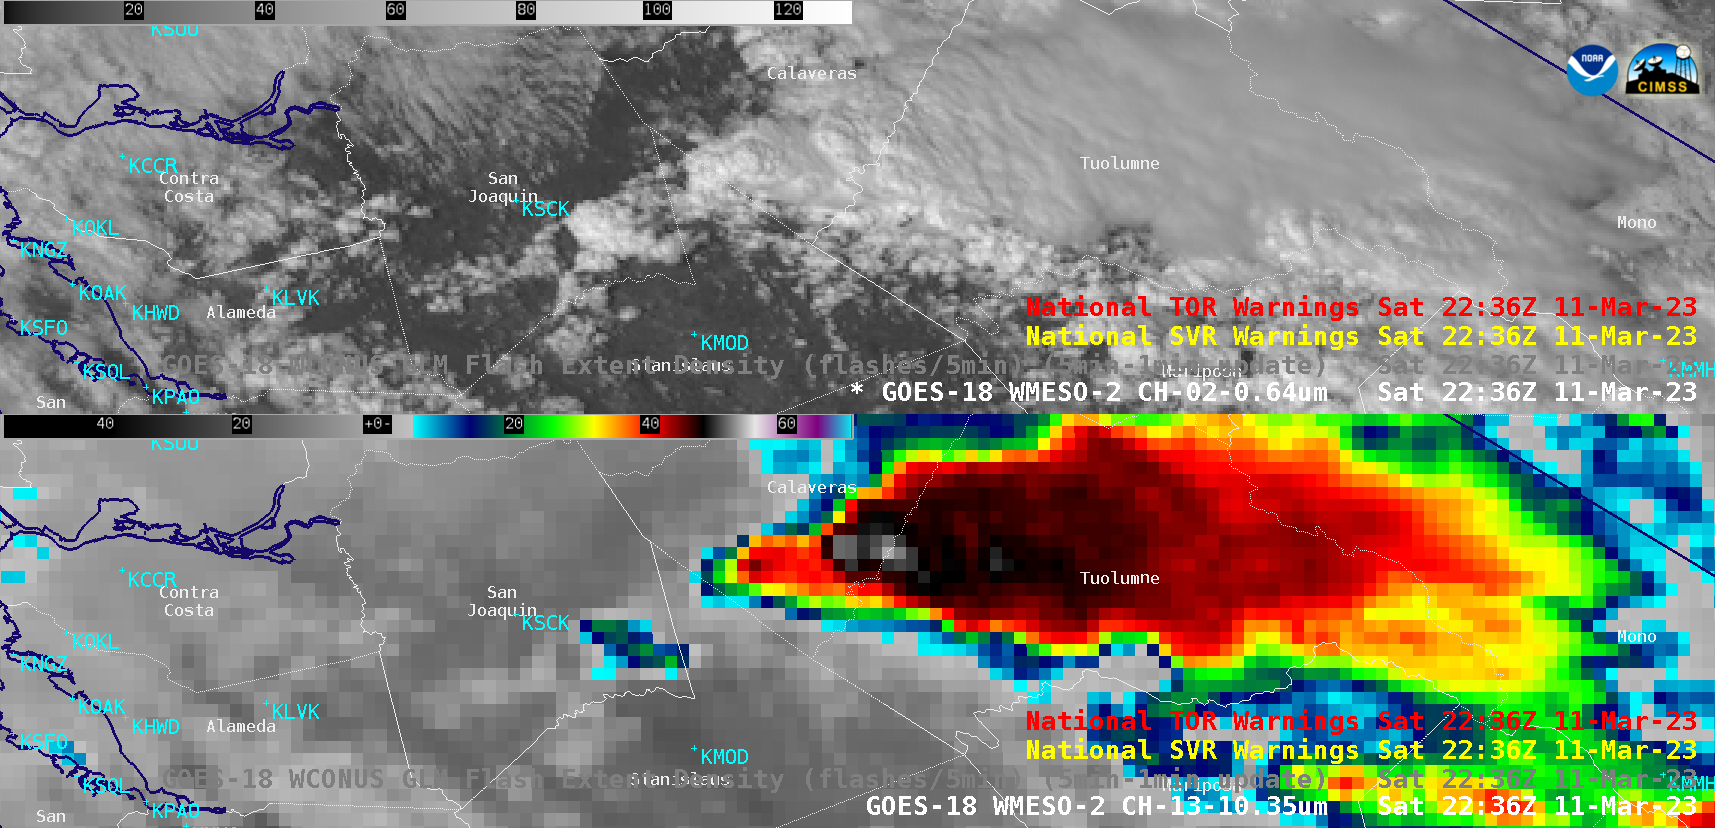
GOES-18 “Red” Visible (0.64 µm, top) and “Clean” Infrared Window (10.3 µm, bottom) images, with and without an overlay of GOES-18 GLM Flash Extent Density [click to play animated GIF | MP4]
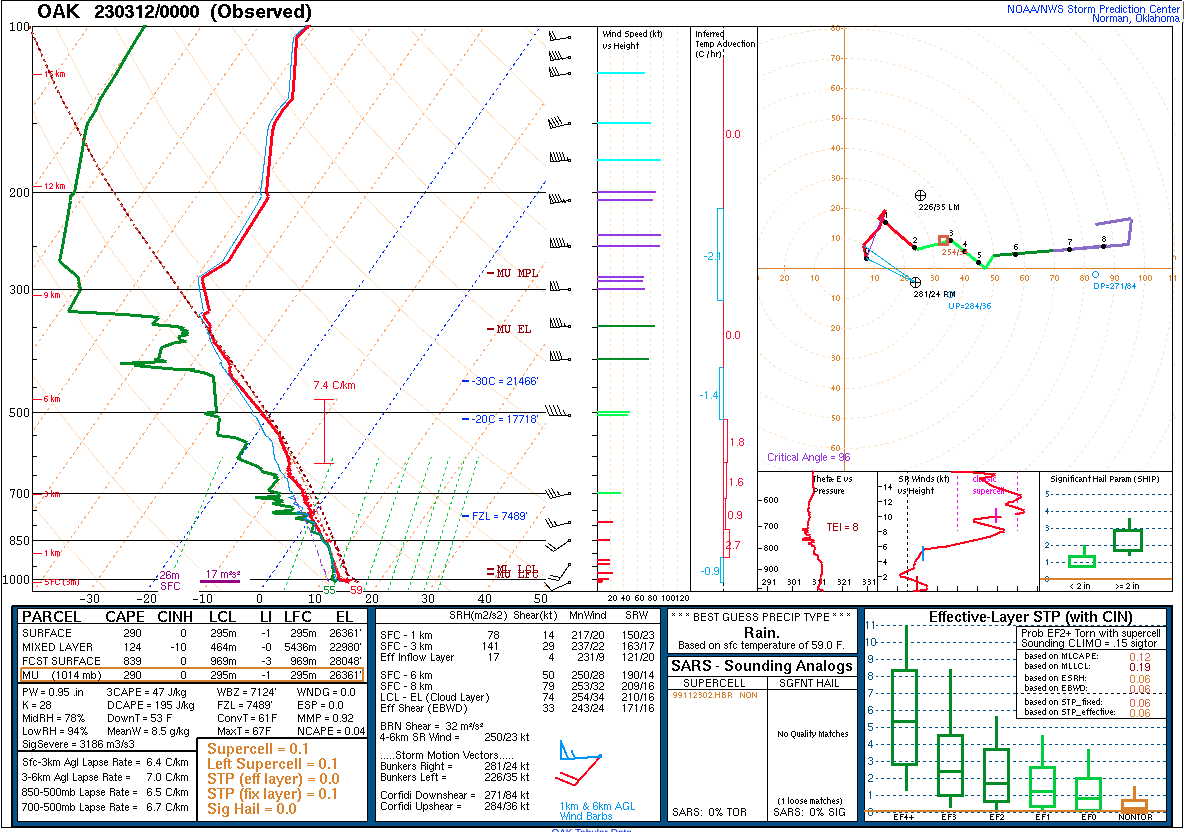
1-minute Mesoscale Domain Sector GOES-18 (GOES-West) “Red” Visible (0.64 µm) and “Clean” Infrared Window (10.3 µm) images (above) included an overlay of GLM Flash Extent Density — which showed thunderstorms that produced flash flooding, hail and an EF-1 tornado (SPC Storm Reports) in the Central Valley of California on 11 March 2023. At 2236 UTC (1 minute prior to the Tornado Warning being issued), an overshooting top along the Calaveras/Tuolumne County line exhibited an infrared brightness temperature of -53.3ºC — which roughly corresponded to the altitude of a Most Unstable Maximum Parcel Level (MU MPL) as analyzed from the 0000 UTC Oakland rawinsonde (source). Note that for the relatively low-topped convection over California on this day, the coldest value of the default infrared enhancement was modified to -70ºC, to aid in the identification of colder overshooting tops (shades of white embedded within dark black regions).
The corresponding GOES-18 Cloud Top Height derived product at 2236 UTC — just before the issuance of the Tornado Warning — was around 32,482 feet (below). For this storm, the maximum value of the default Cloud Top Height enhancement was set to 35,000 feet.
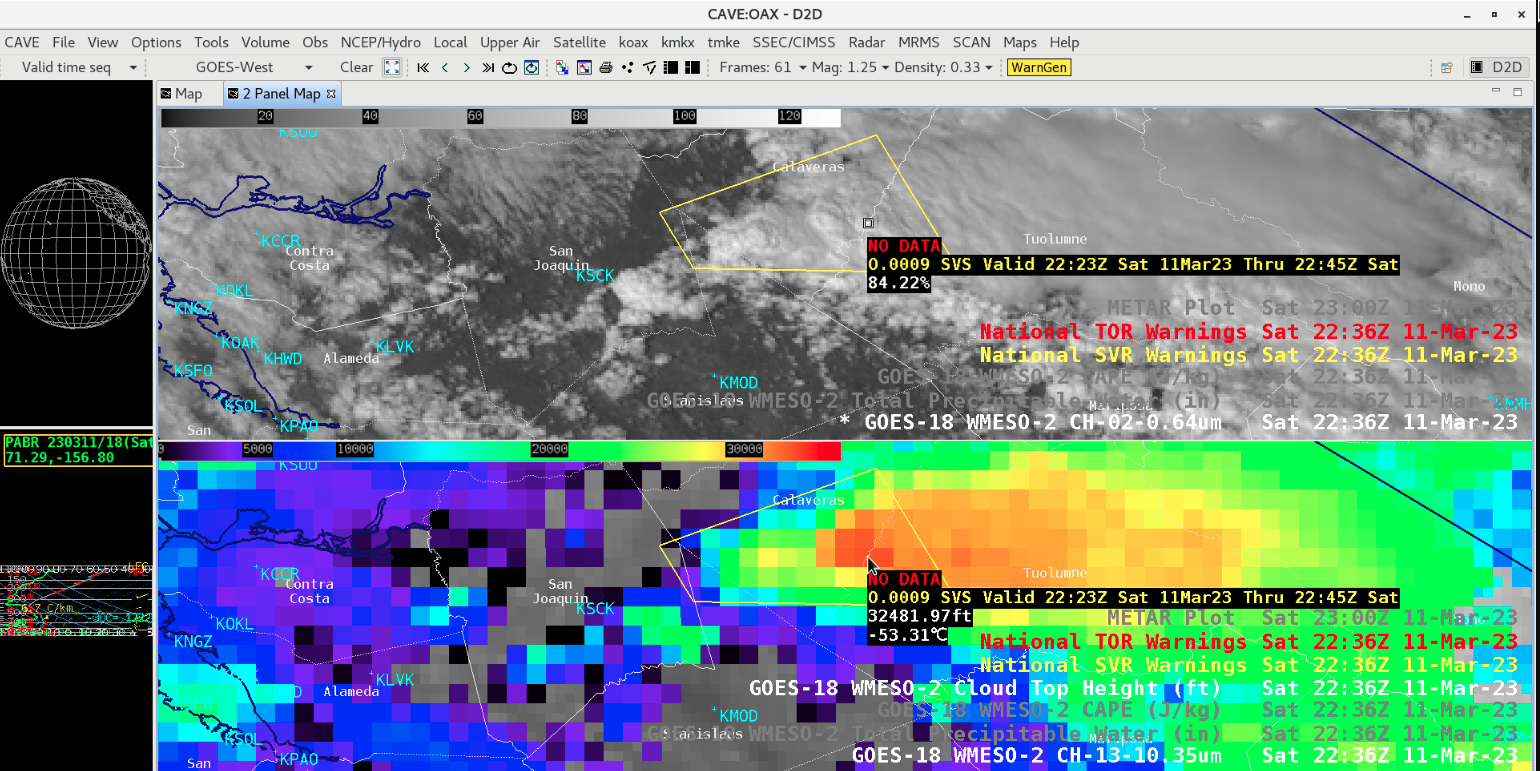
GOES-18 “Red” Visible image (0.64 µm, top) and Cloud Top Height derived product (bottom), with cursor sampling of the coldest 10.3 µm pixel along the Calaveras/Tuolumne County line at 2336 UTC [click to enlarge]
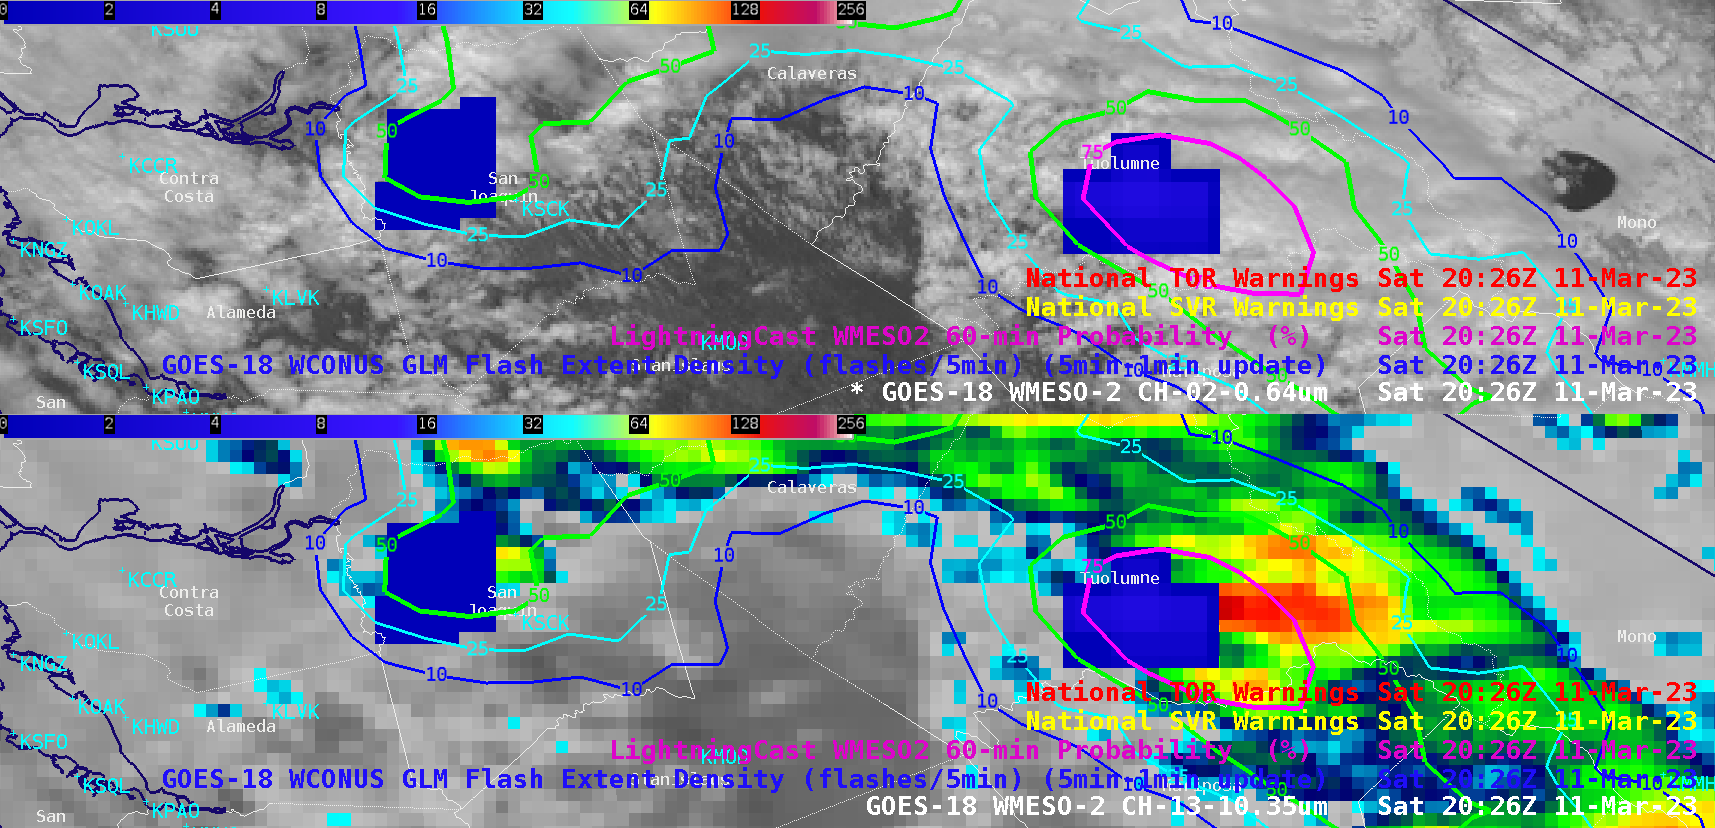
During the period leading up to convective initiation of the hail/tornado-producing thunderstorm, 1-minute GOES-18 Visible and Infrared images (below) include contours of LightningCast Probability — a >50% LightningCast Probability (green contour) over western San Joaquin County at 2009 UTC provided a 17-minute lead time to the start of a prolonged period of GLM-indicated lightning activity for that storm, which commenced at 2026 UTC (2000 – 0100 UTC animation).
GOES-18 “Red” Visible (0.64 µm, top) and “Clean” Infrared Window (10.3 µm, bottom) images, with an overlay of GLM Flash Extent Density and contours of LightningCast Probability [click to play animated GIF | MP4]
These thunderstorms developed in an environment of modest moisture and instability, as shown by 1-minute GOES-18 Visible and Infrared images combined with Total Preciptitable Water (TPW) and Convective Available Potential Energy (CAPE) derived products in cloud-free areas (below). Satellite-derived TPW values up to 0.90 inch and CAPE values as high as 400 J/kg were observed in the general vicinity of the strongest convection. Note that the default enhancements for TPW and CAPE were also modified for use with these particular storms — the maximum TPW value was set at 1.1 inches, while the maximum CAPE value was set at 500 J/kg.

GOES-18 “Red” Visible (0.64 µm, top) and “Clean” Infrared Window (10.3 µm, bottom) images, combined with Total Preciptitable Water and Convective Available Potential Energy (CAPE) derived products in cloud-free areas [click to play animated GIF | MP4]