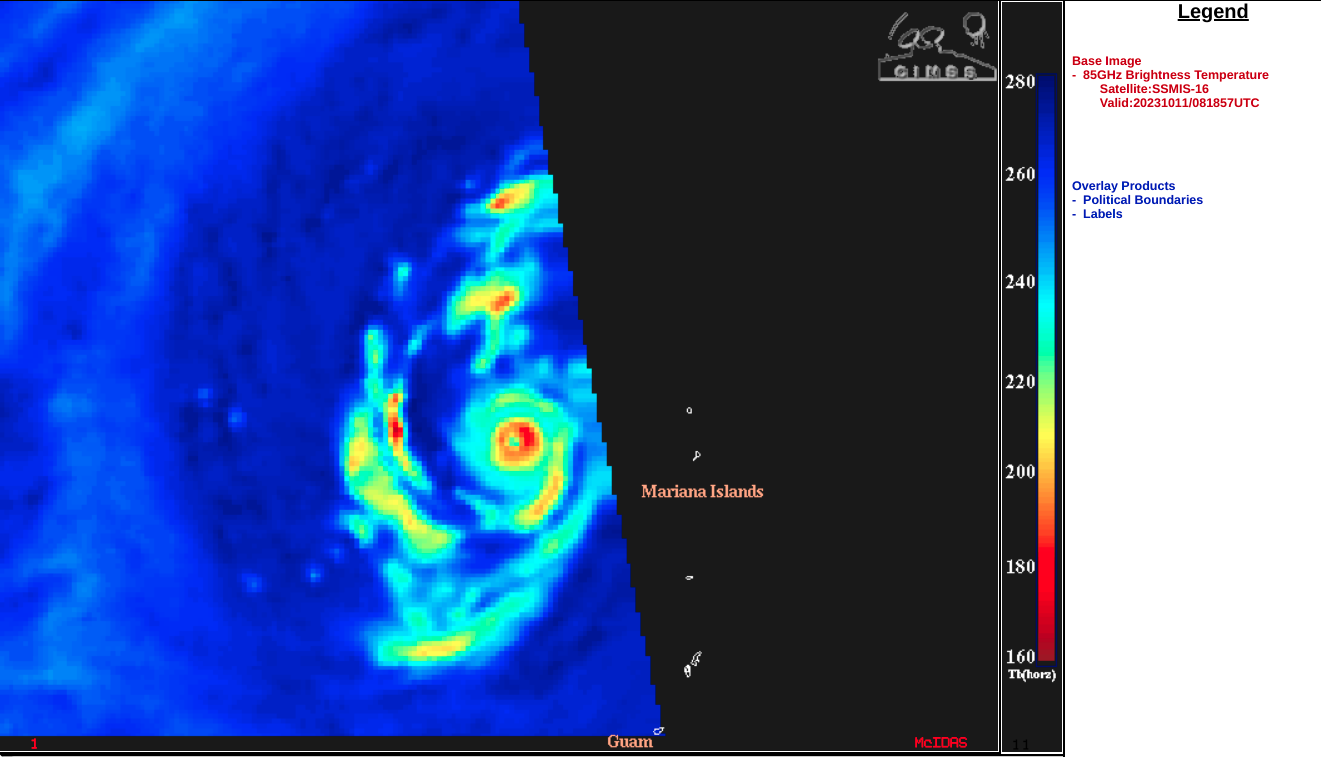
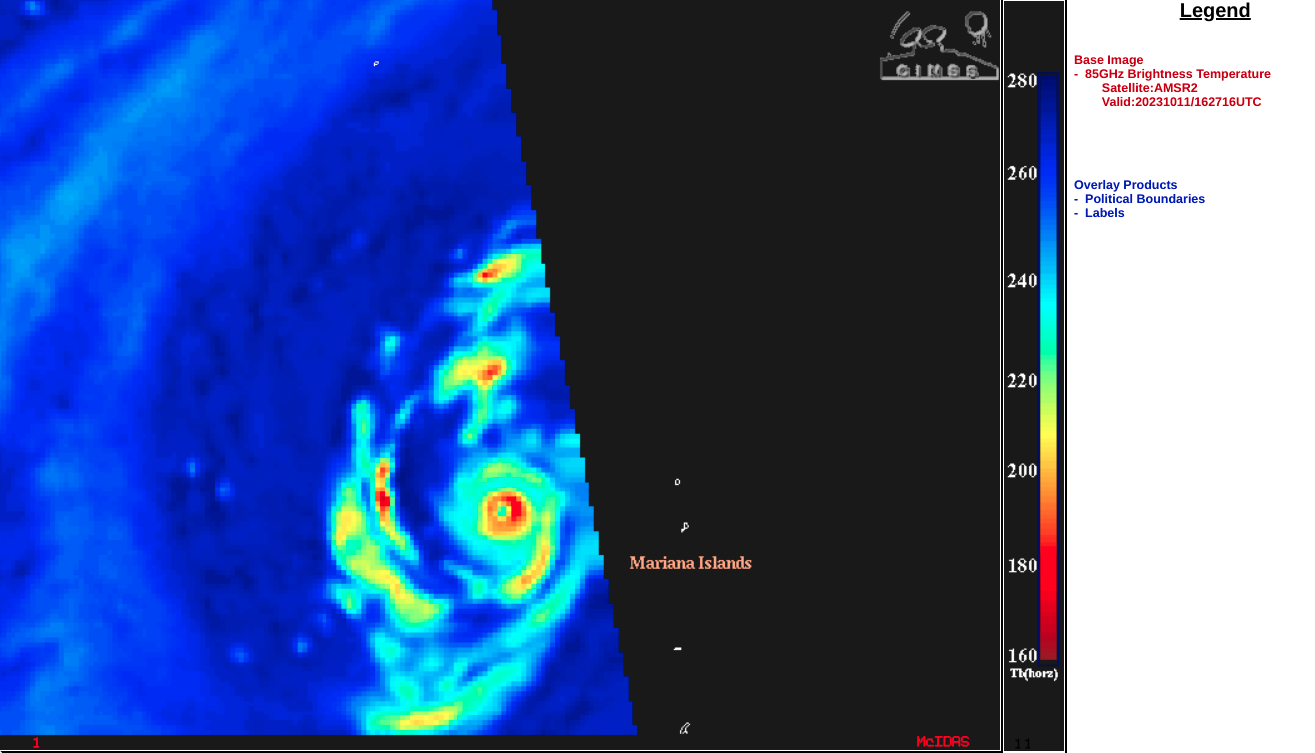
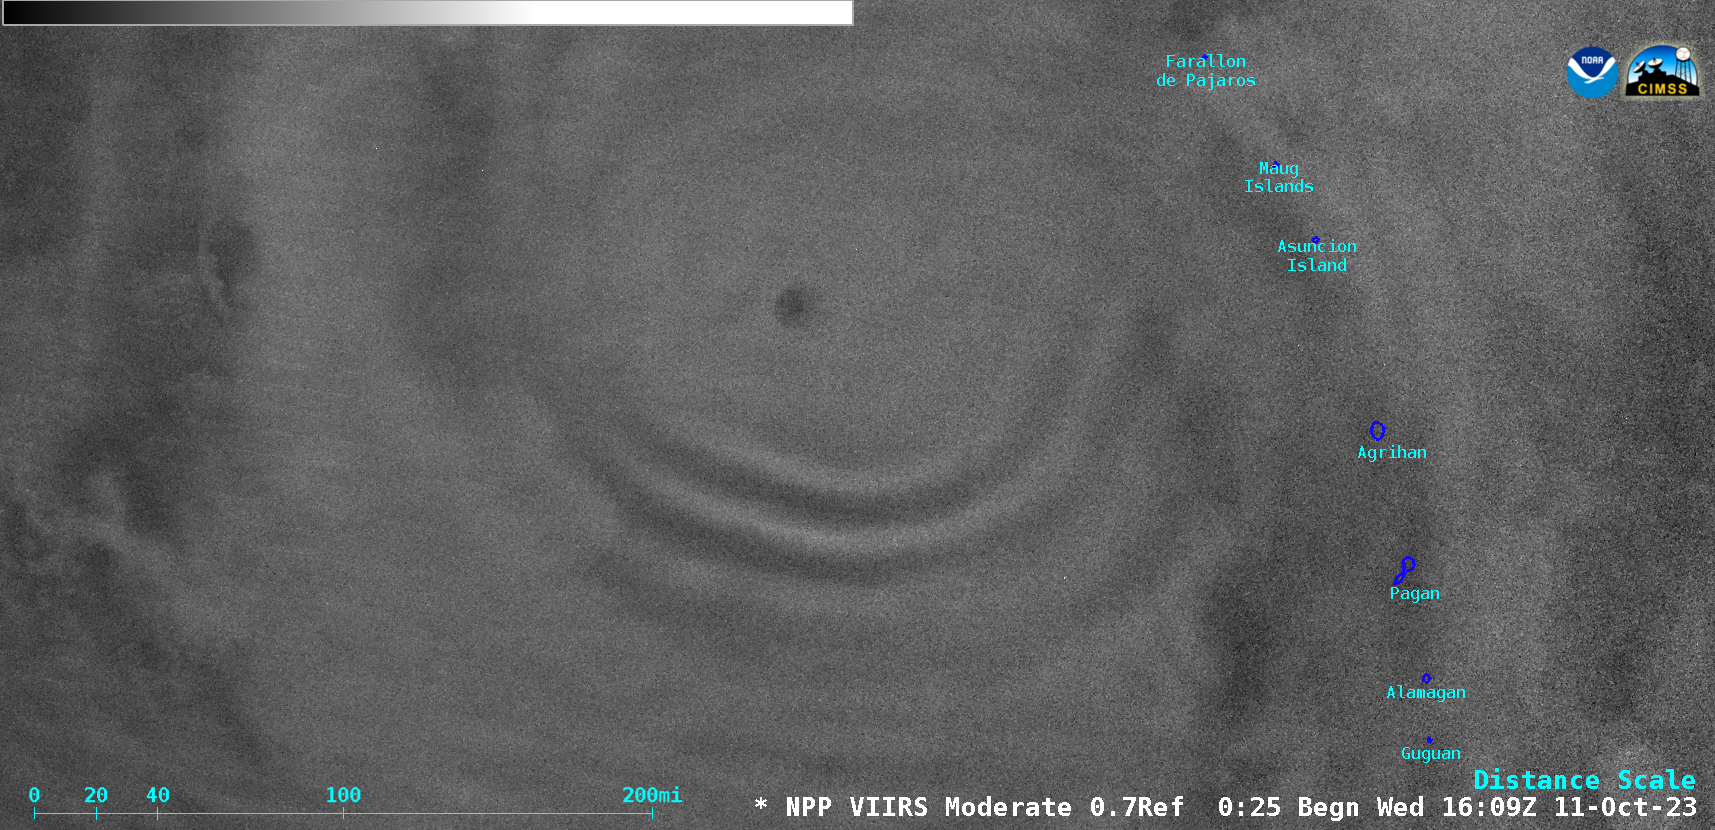
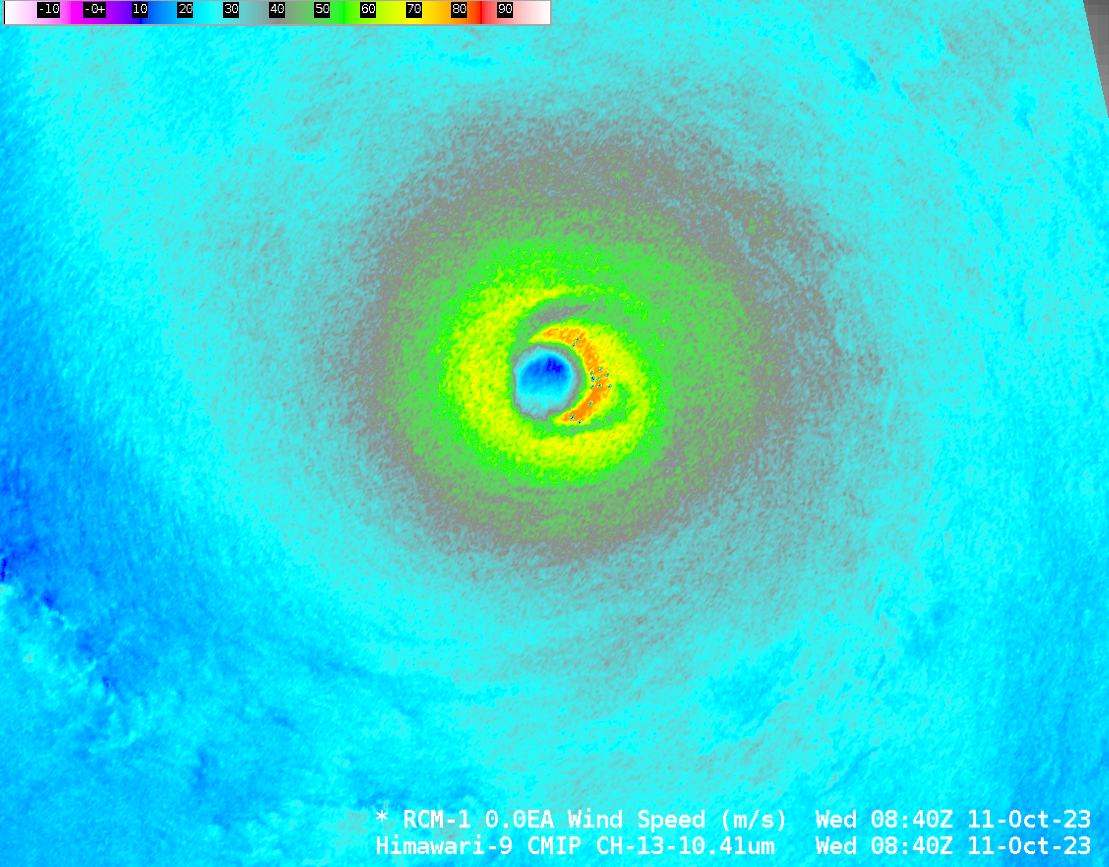
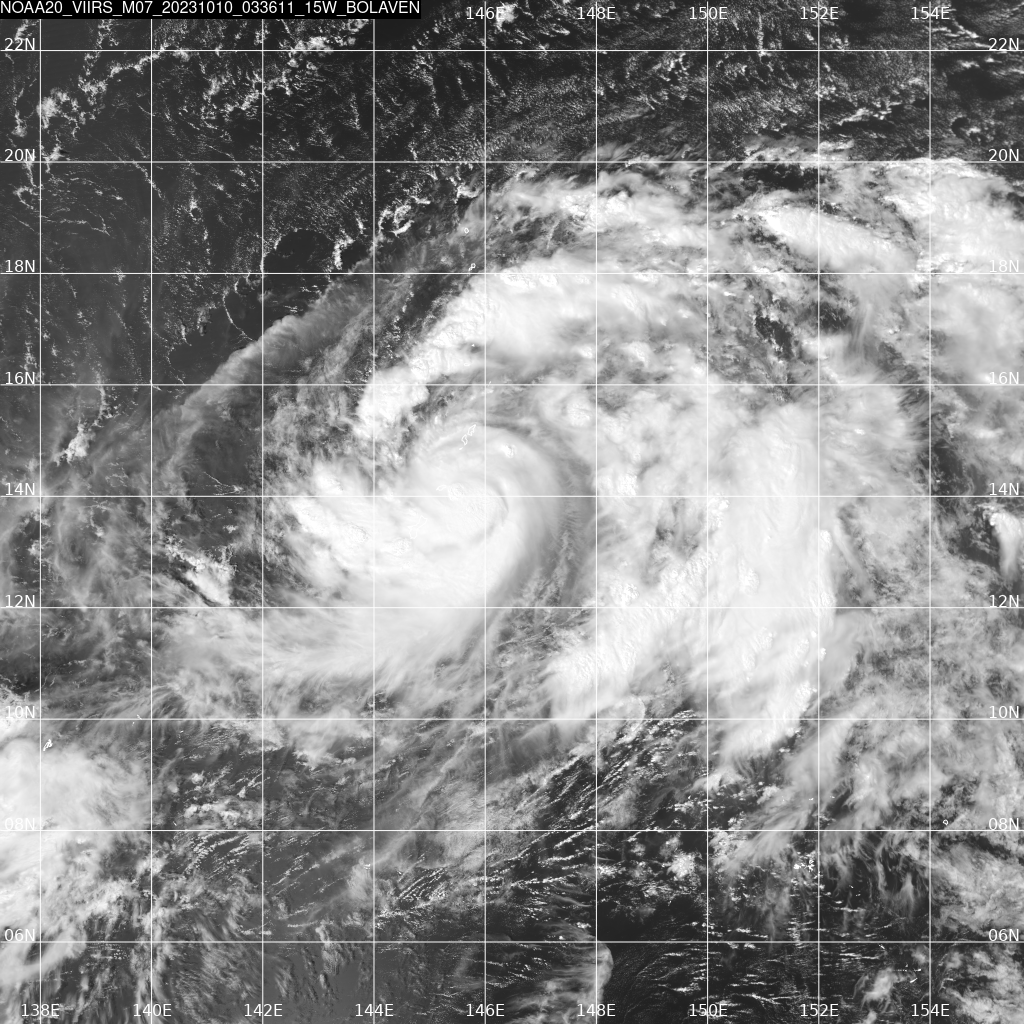
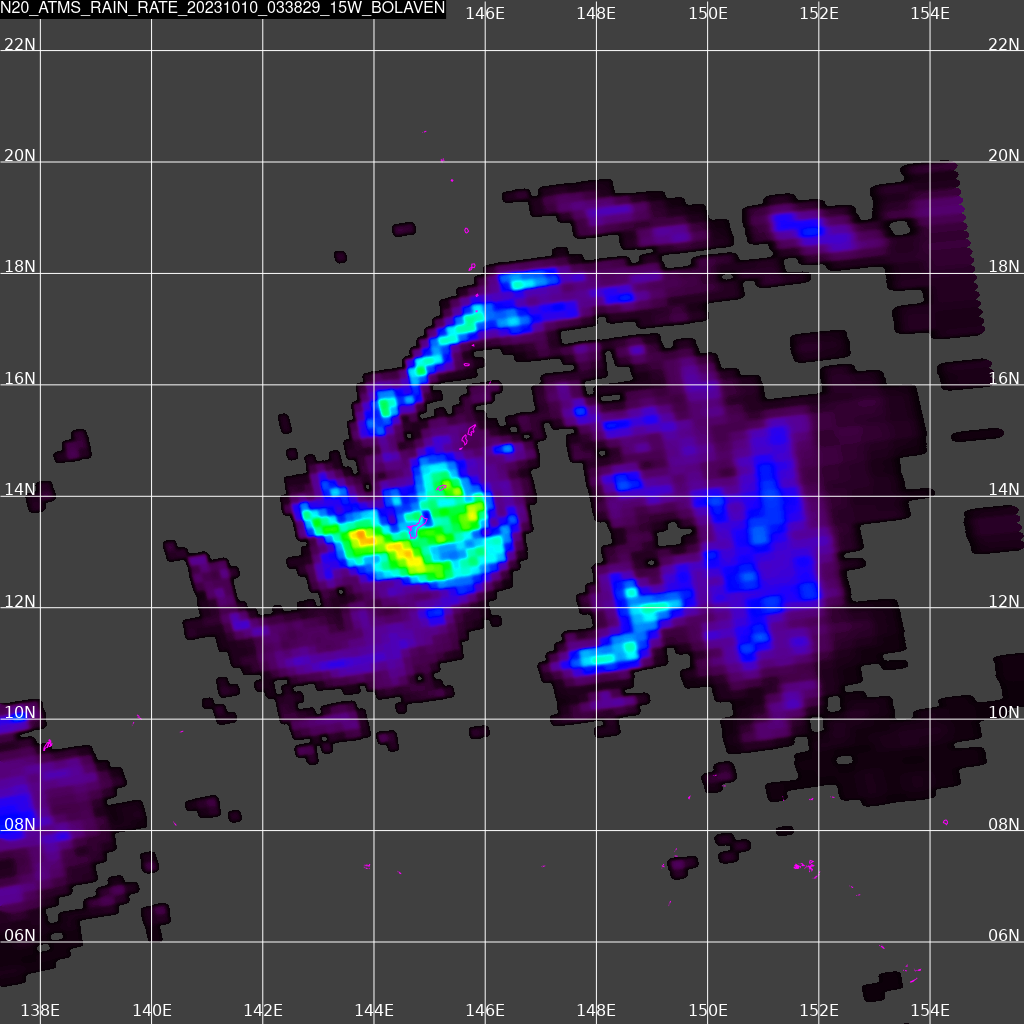
The RCM-1 (Radarsat Constellation Mission 1) satellite overflew STY Bolaven at 0840 UTC on 11 October. The Himawari-9 infrared (10.4 µm) presentation of the storm is excellent with a symmetric storm, distinct eye, and vigorous outer band convection. SAR winds show the strongest convection in the eastern half of the eyewall, where winds of 80 m/s (> 150 knots) are measured. (This website contains views of Bolaven from multiple SAR overpasses) The structure of the SAR winds (here‘s a zoomed-in view) shows a band of weaker winds outside the strongest winds on the east side of the storm. Is an eyewall replacement cycle occurring?
The SSEC/CIMSS Tropical Weather website includes a section on Microwave-based Probabilities of an Eyewall Replacement Cycle (M-PERC). The diagram below (click on it to see the entire figure including column headers) shows probabilities reached a maximum after 0300 on 11 October.
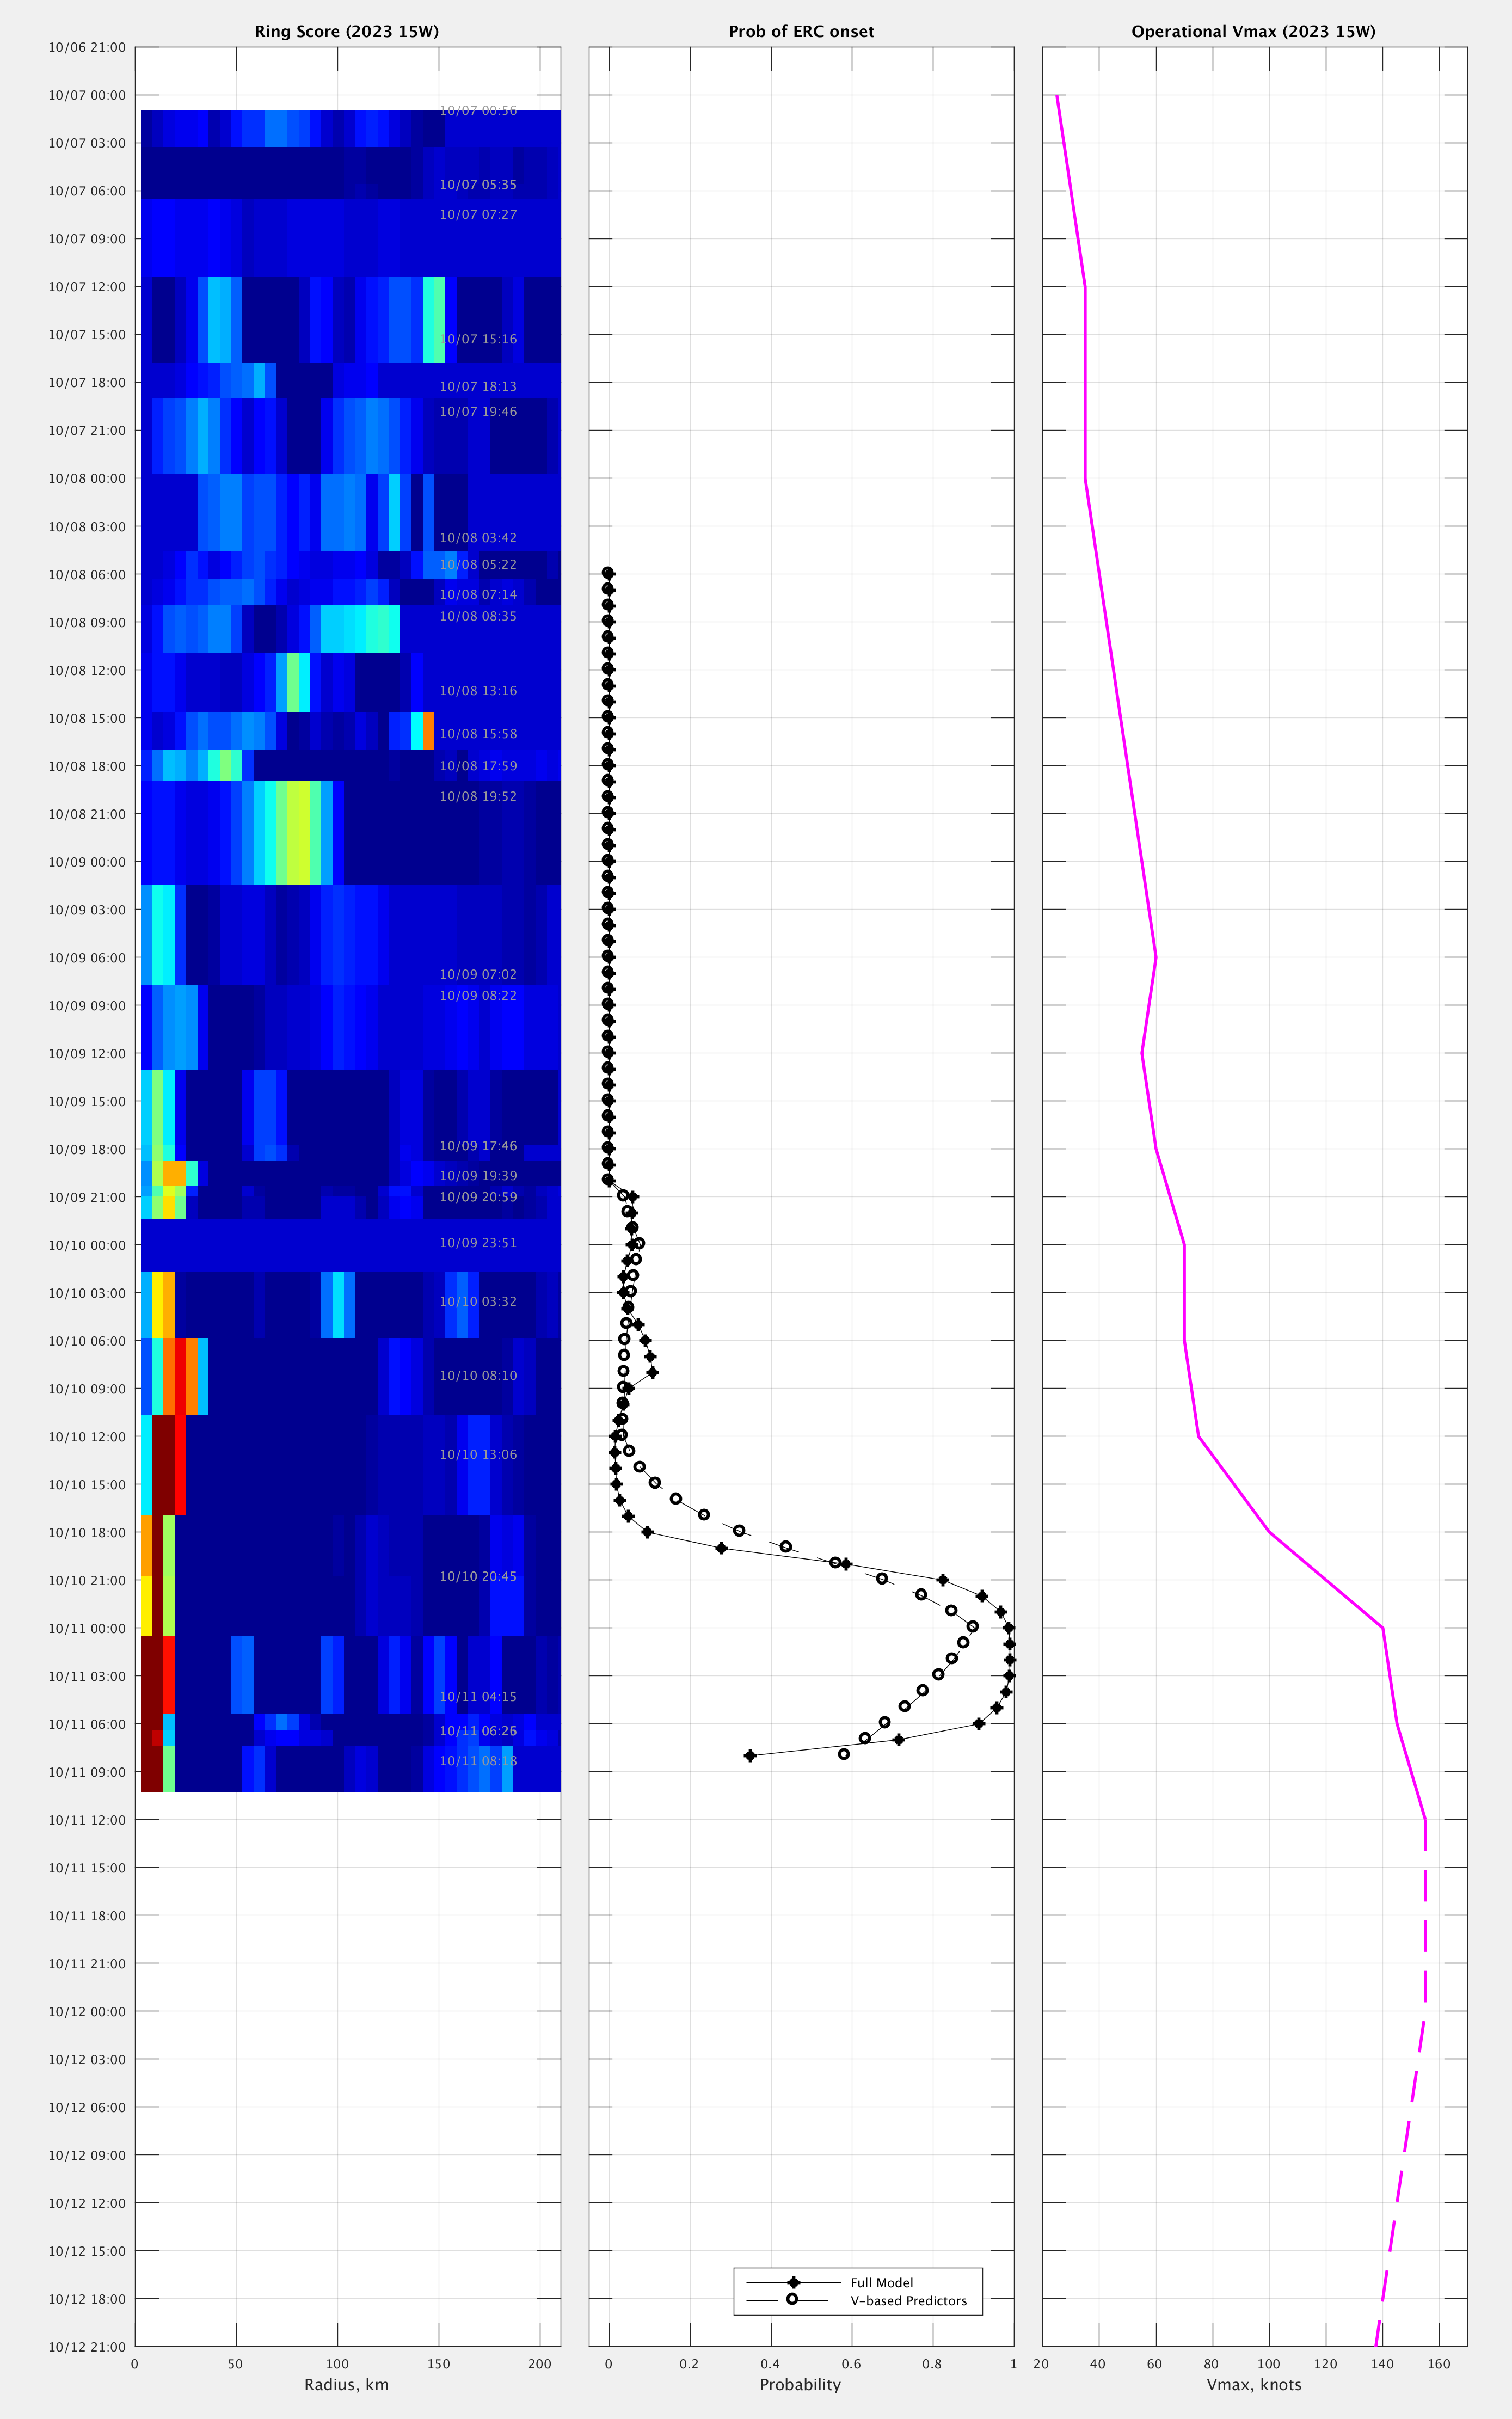
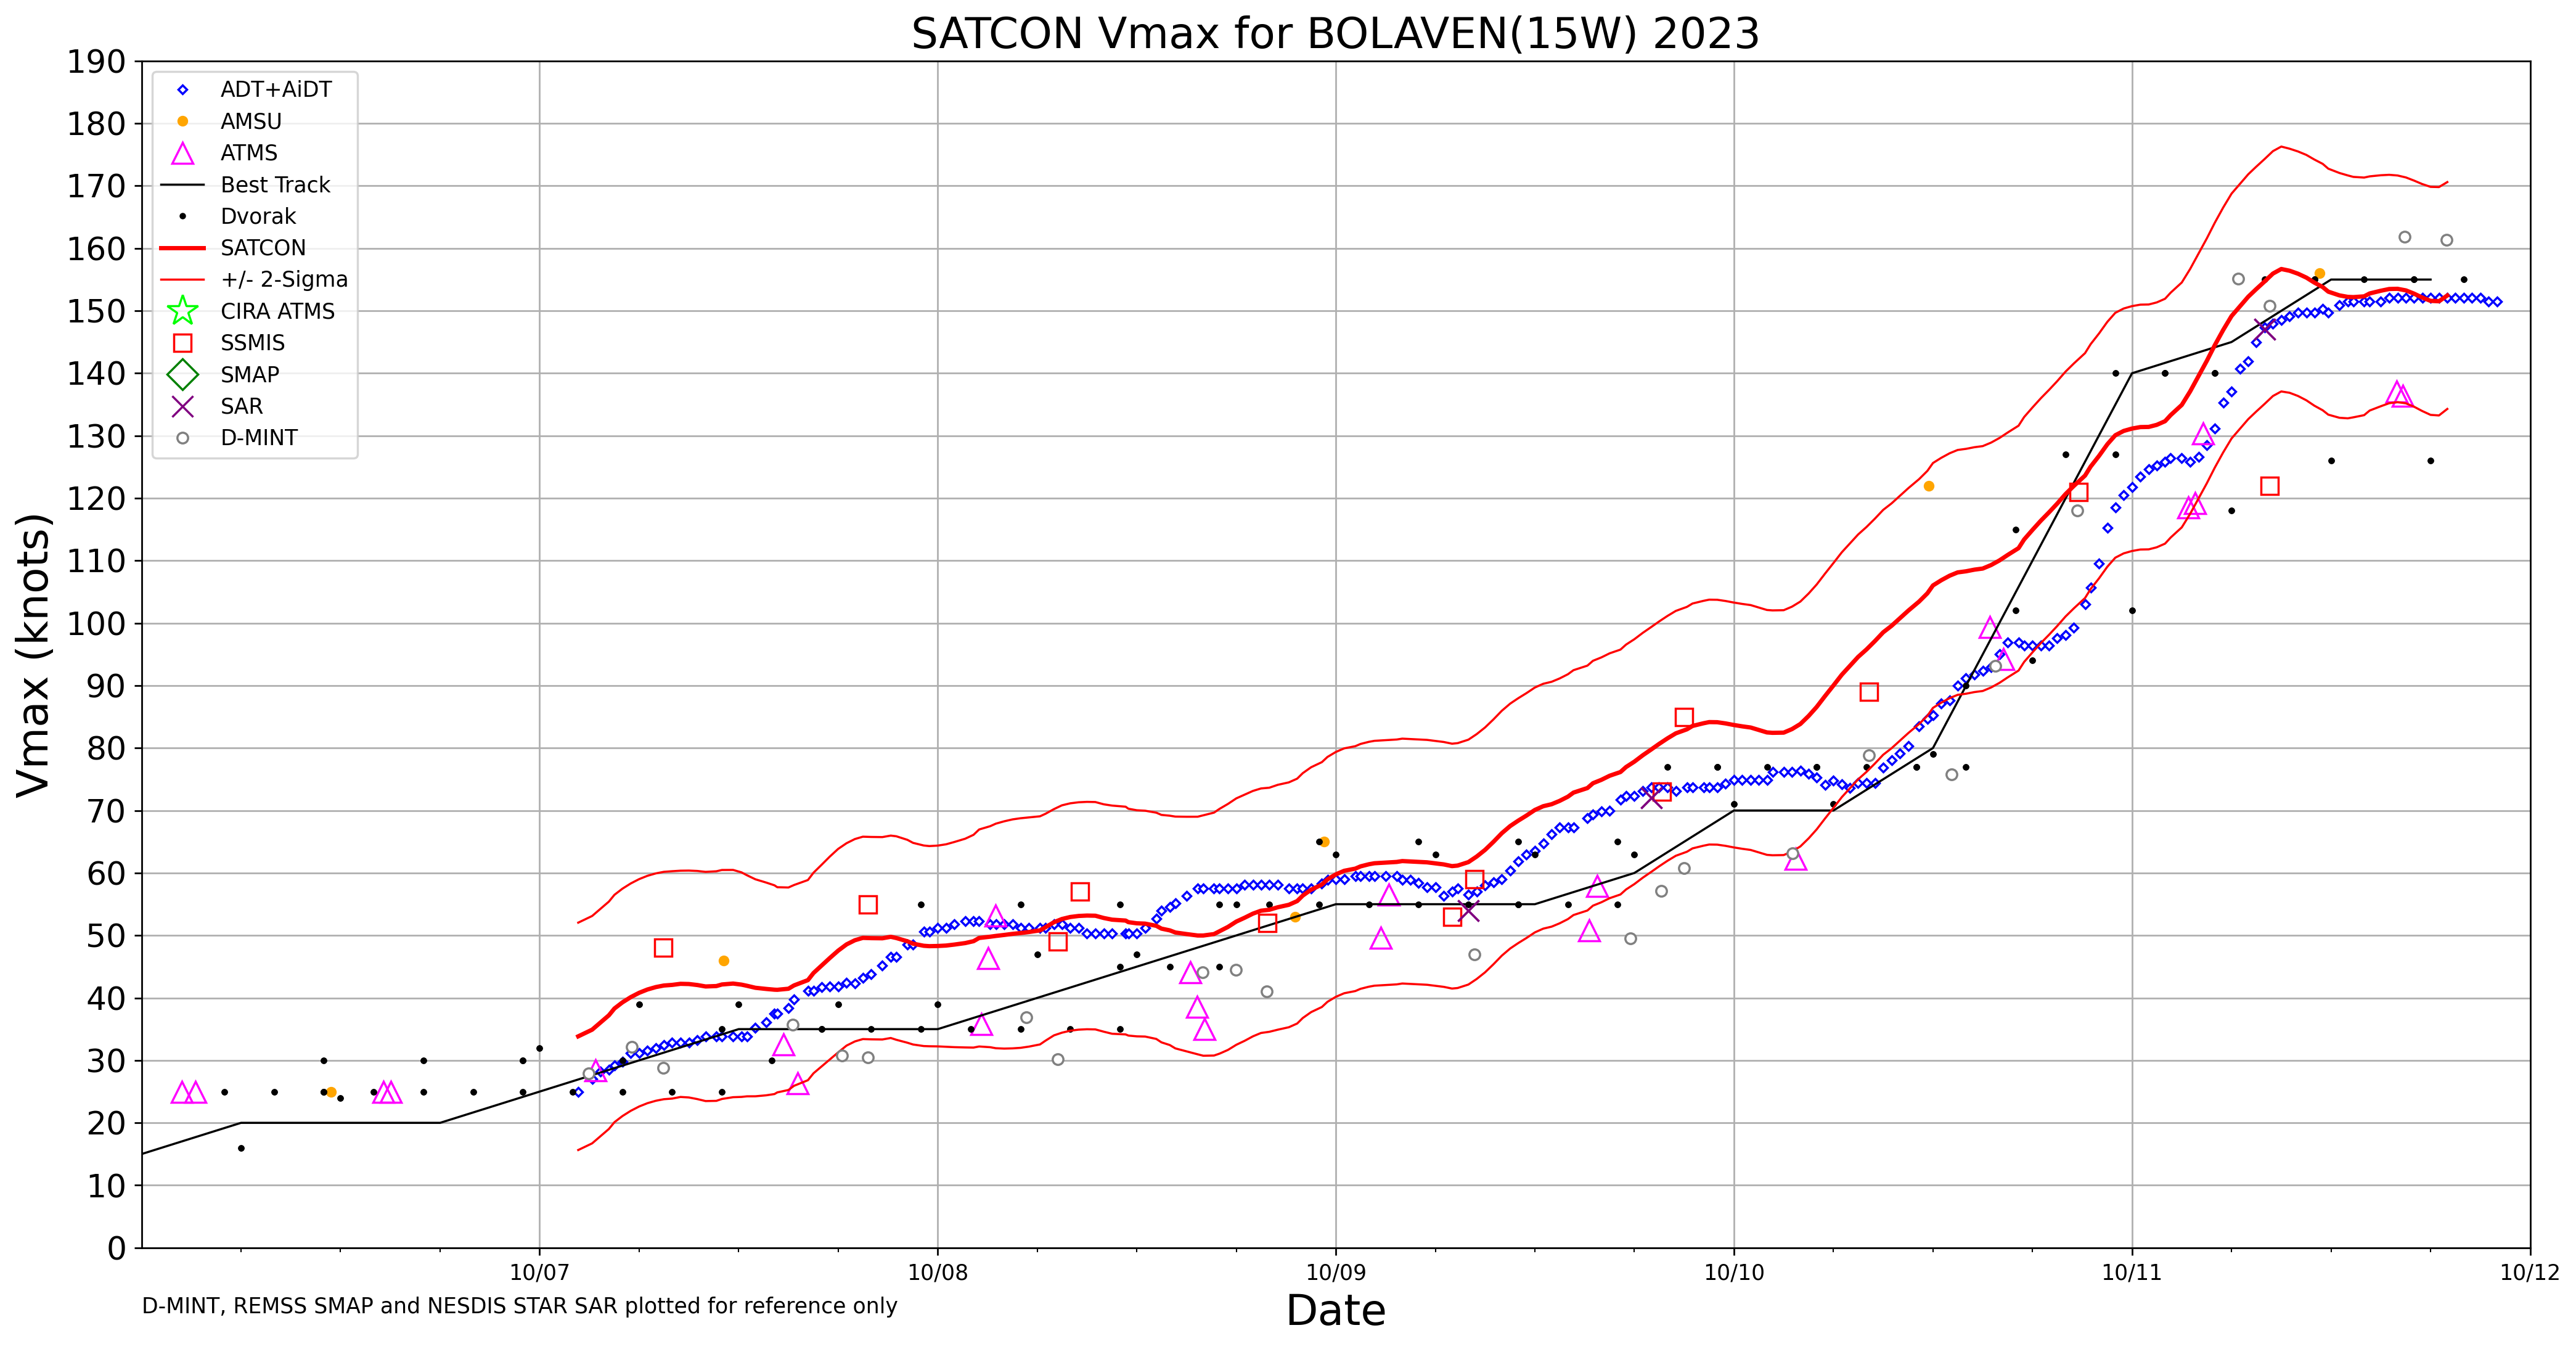
The MIMIC-TC animation below, however, shows winds consistently at/above 145 knots in the latter part of the animation, and no obvious signature of an ongoing eyewall replacement.
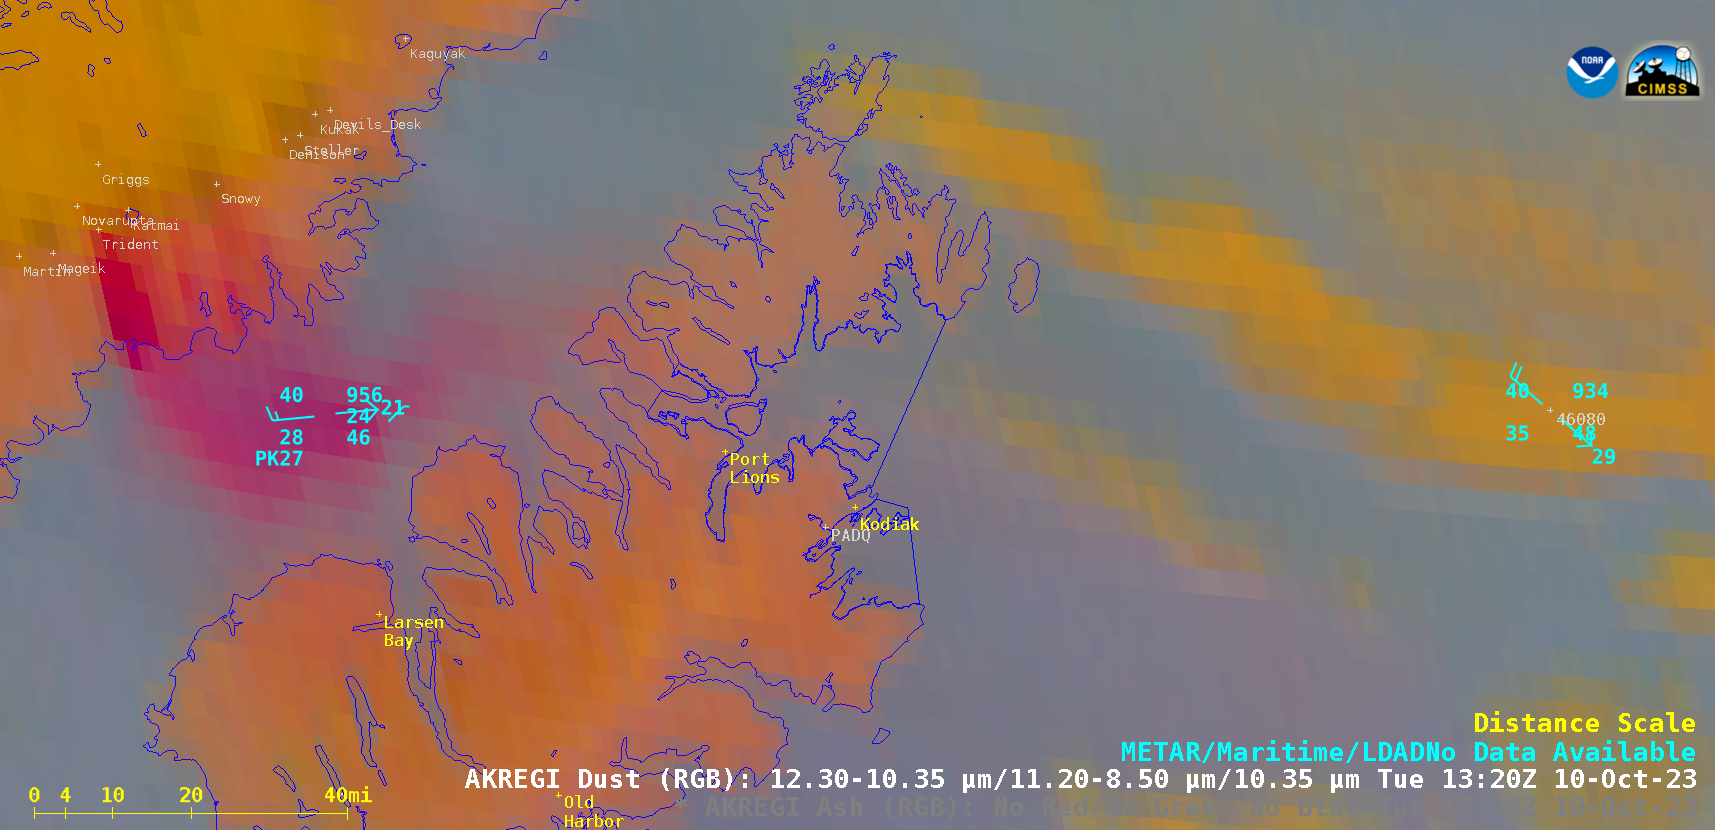
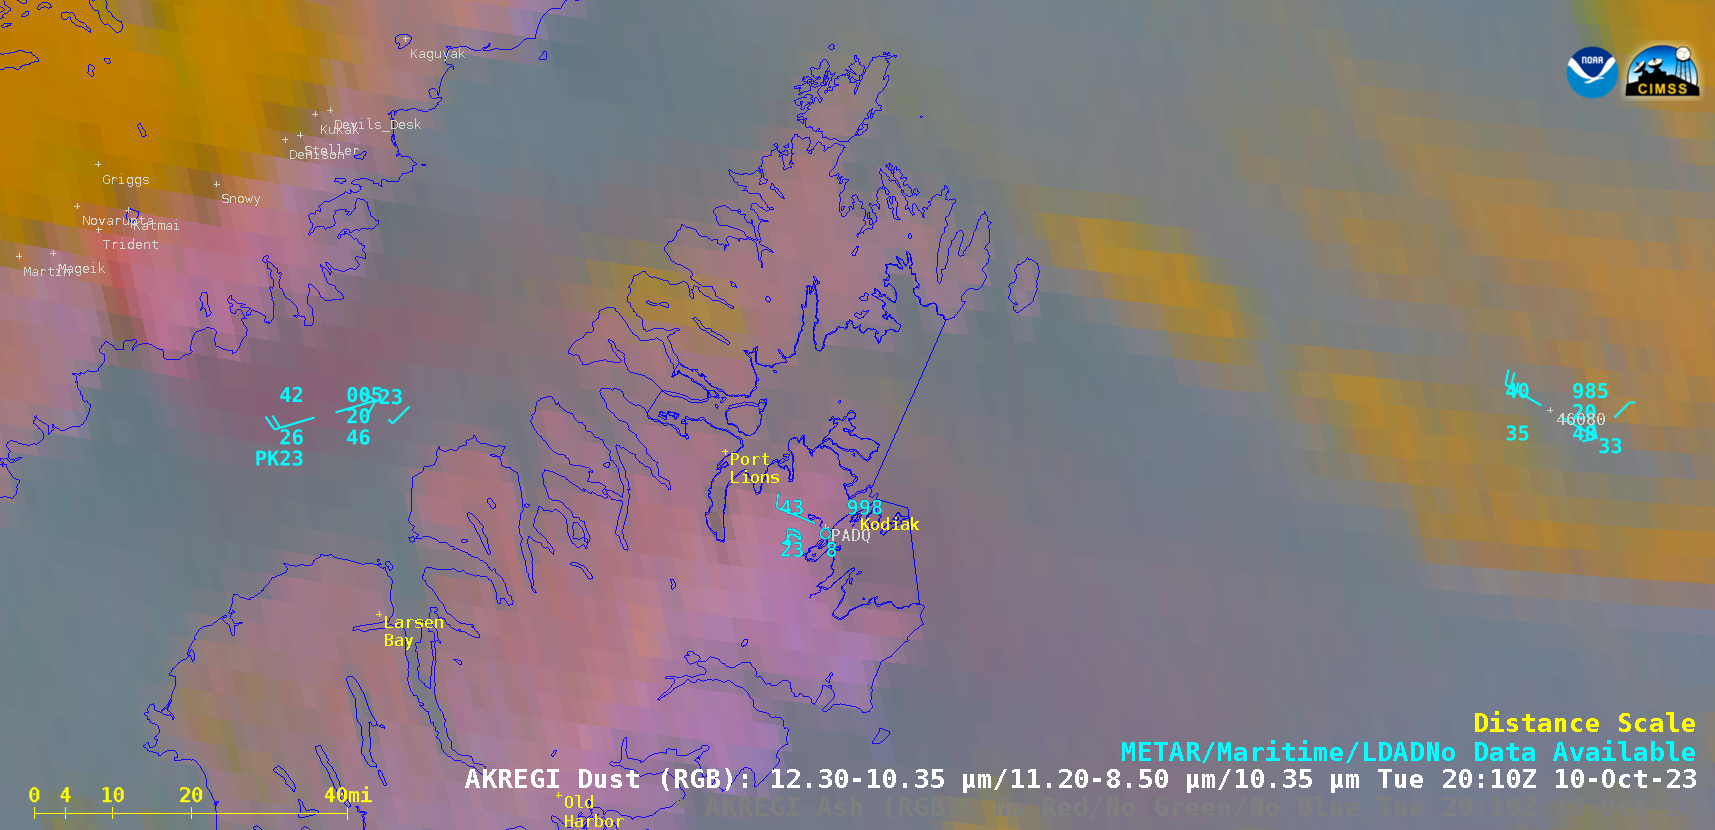
For more information on this storm, refer to the webpages of the Joint Typhoon Warning Center, the RSMC in Tokyo and the CIMSS Tropical Website. Bolaven is forecast to remain at sea as it recurves to the north and east. It is forecast to become a significant mid-latitude extra-tropical cyclone in the Gulf of Alaska by 18 October.
View only this post Read Less

