This website works best with a newer web browser such as Chrome, Firefox, Safari or Microsoft
Edge. Internet Explorer is not supported by this website.
MIMIC Total Precipitable Water (TPW) fields, below, show a band a rich moisture over the northern Indian Ocean between the Equator and 15oN Latitude. By 17 October in the animation, cyclonic motion is diagnosed in the TPW fields between 60o and 70o E Longitude. By 18 October, an invest was... Read More
MIMIC Total Precipitable Water over the Indian Ocean, 0000 UTC 15 October- 0000 UTC 20 October 2023 (Click to enlarge)
MIMIC Total Precipitable Water (TPW) fields, below, show a band a rich moisture over the northern Indian Ocean between the Equator and 15oN Latitude. By 17 October in the animation, cyclonic motion is diagnosed in the TPW fields between 60o and 70o E Longitude. By 18 October, an invest was declared. The toggle below (imagery from the CIMSS/SSEC Tropical Weather Website) shows shear values, Sea-Surface Temperatures, and low-level convergence and upper-level divergence. Shear values are favorable, and a good divergence/convergence couplet over warm waters is apparent.
Infrared Imagery, 1430 UTC on 18 October 2023 overlain with 850-200 mb wind shear values (1200 UTC on 18 October) toggled with a sea-surface temperature analysis and low-level convergence (yellow) and upper-level divergence.
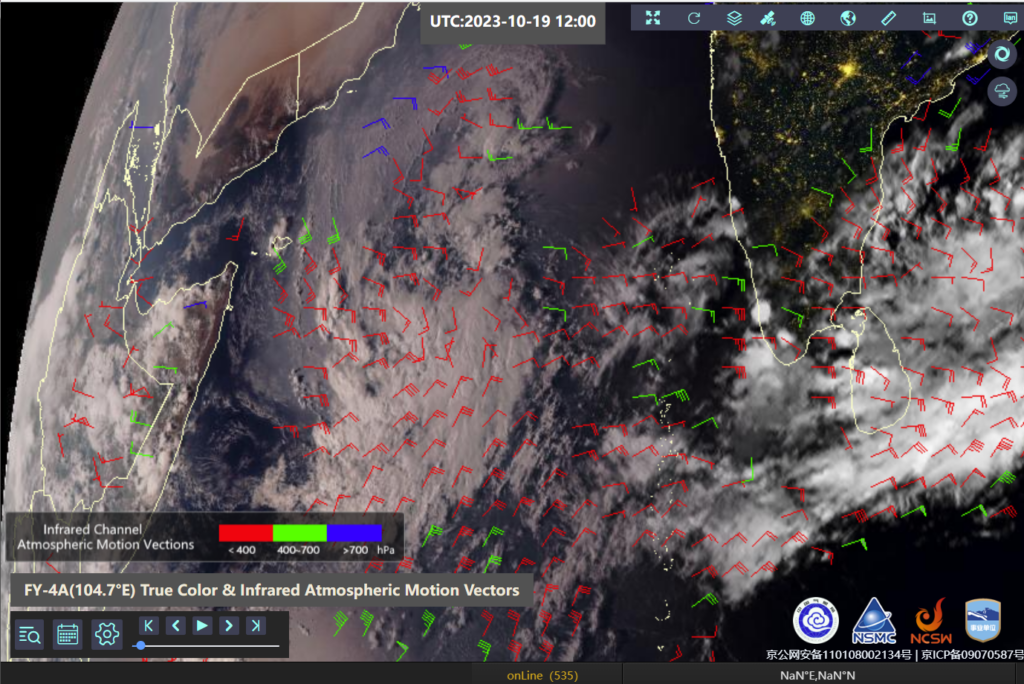
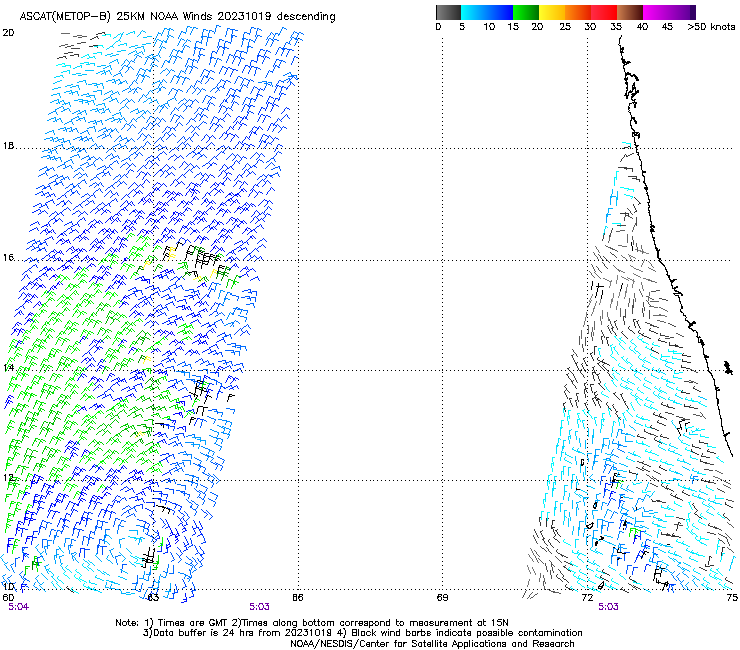
Metop-B overflew the system shortly after 0500 UTC on 19 October (link) and a closed circulation was apparent near 11oN, 63oE. Imagery and winds derived from FY-4A, below, (from this NSMC website) show strong diffluence above the developing system at 1200 UTC on 19 October. The upper-level wind barbs (in red) and mid-tropospheric wind barbs (in green) are nearly parallel, suggesting low shear values.
FY4A True-color imagery and derived atmospheric motion vectors, 1200 UTC on 19 October 2023 (Click to enlarge)
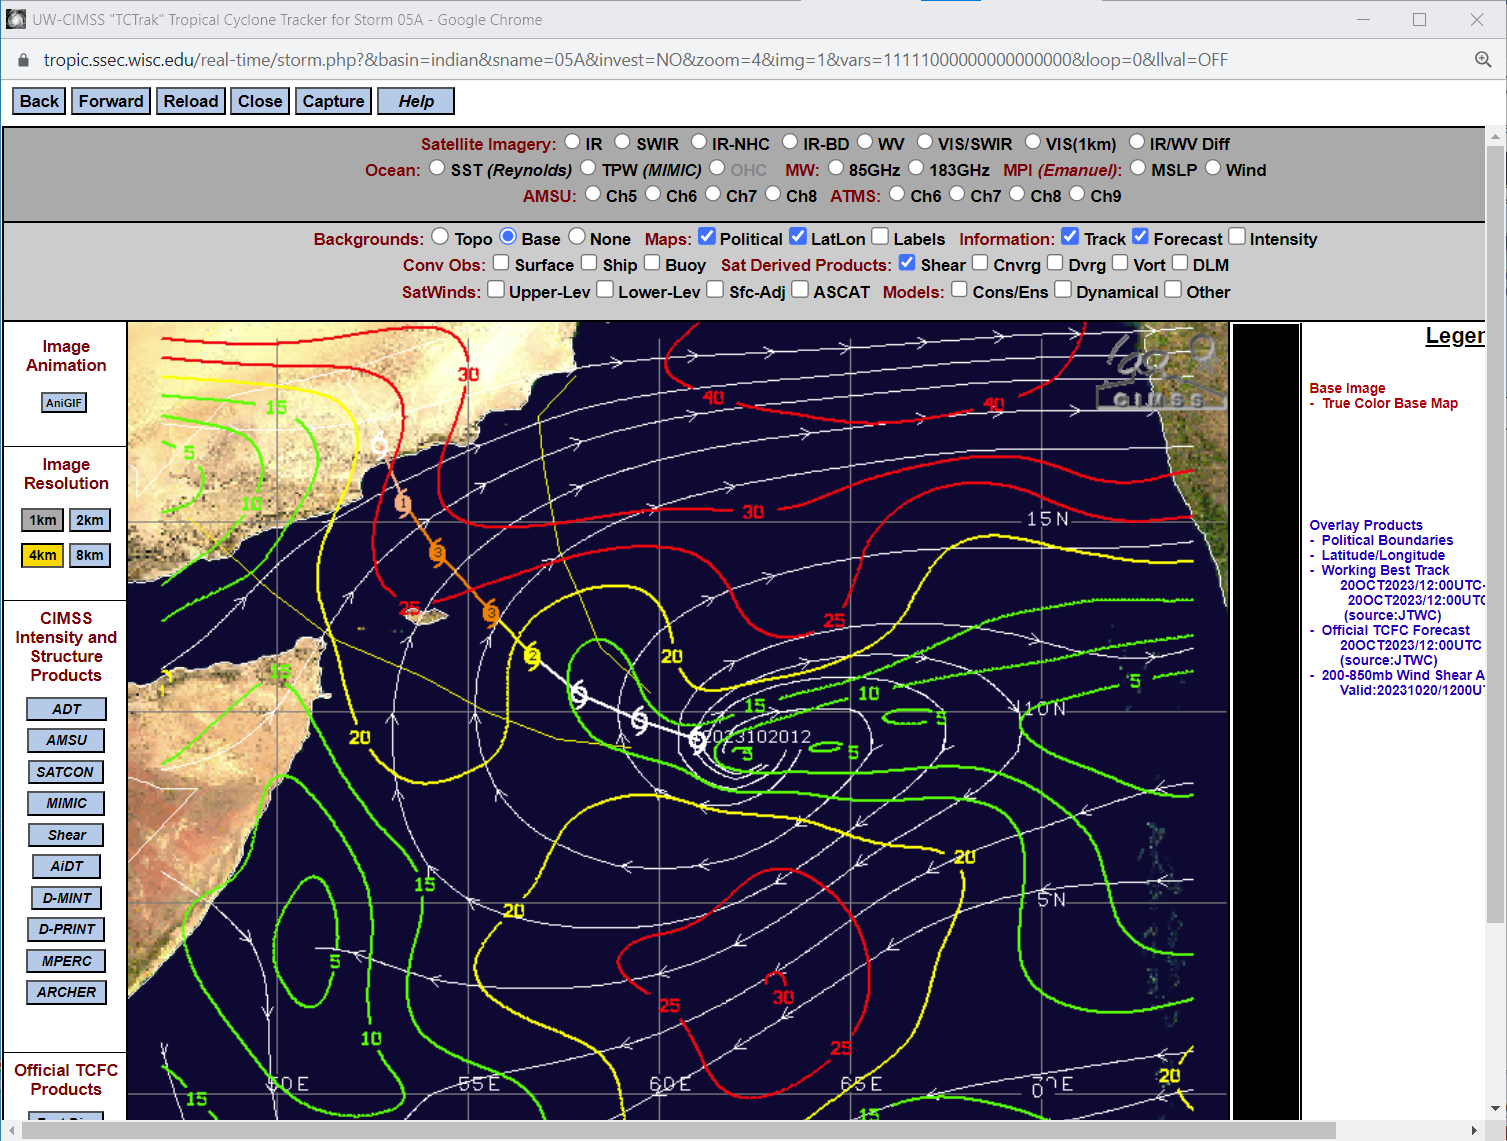
By 1200 UTC on 20 October, below, a storm has formed in the region of low shear, and landfall on the southern shore of the Arabian Peninsula is forecast.
Wind Shear analysis, 1200 UTC on 20 October 2023 (Click to enlarge)
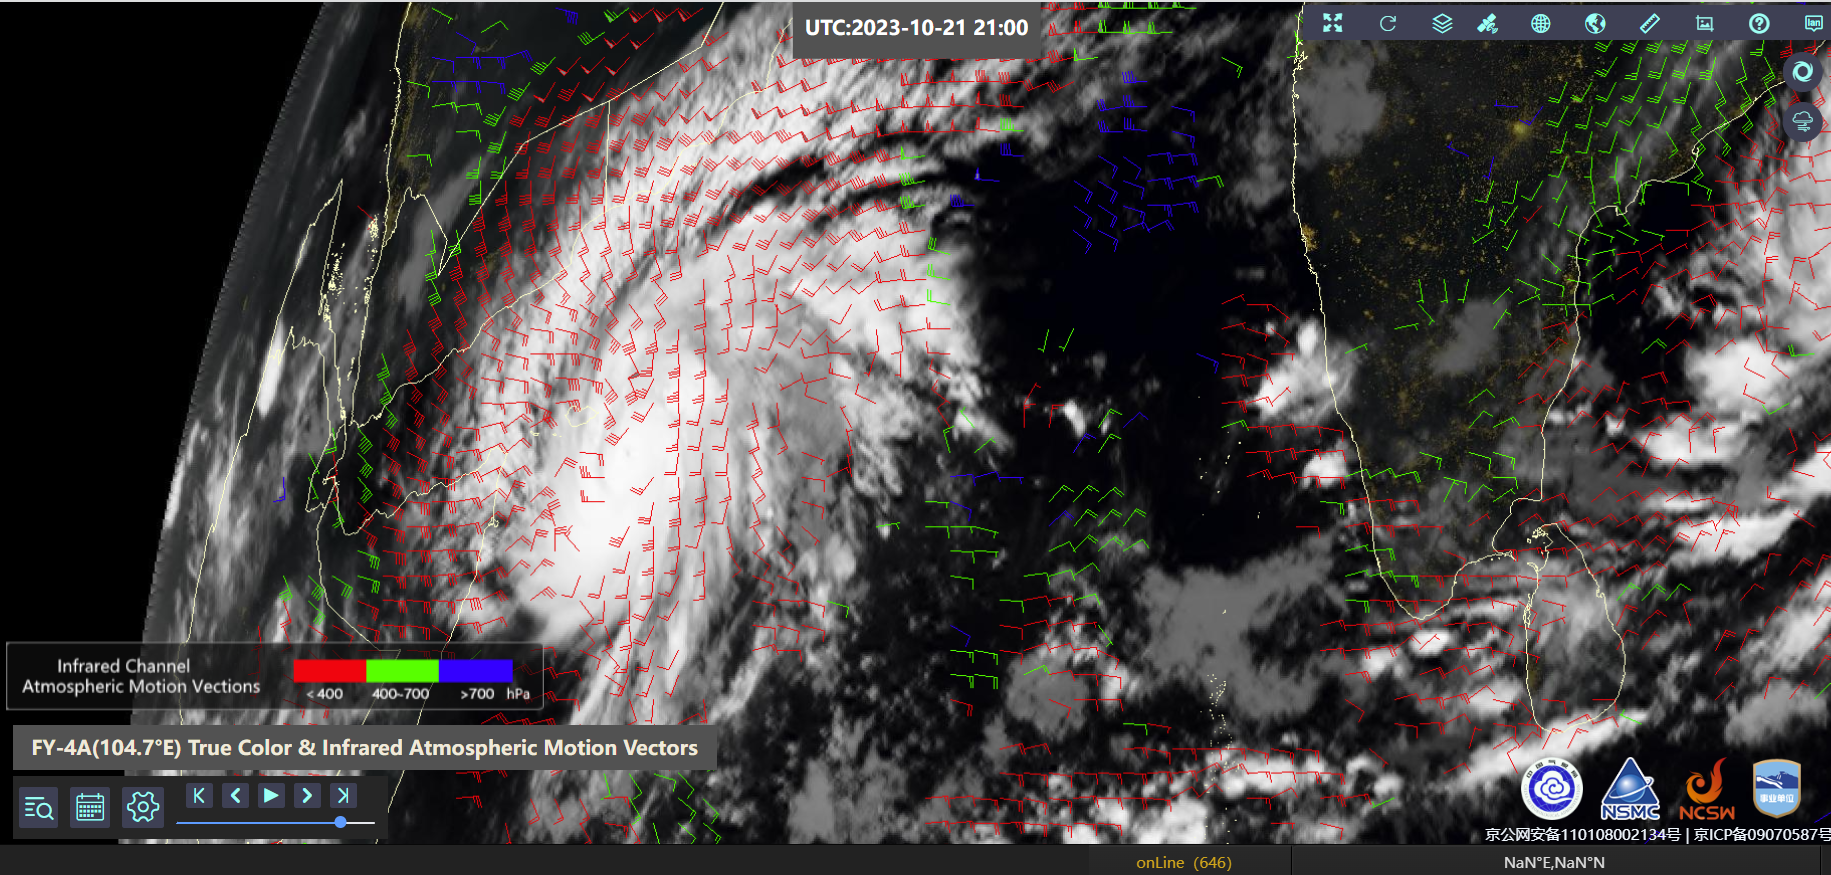
By 2100 UTC on 21 October 2023, below, a well-developed system was present. Satellite-derived winds suggest an outflow jet to the east along the northern perimeter of the storm.
Infrared imagery over Tej, 2100 UTC on 21 October 2023. Derived wind vectors are plotted (Click to enlarge)
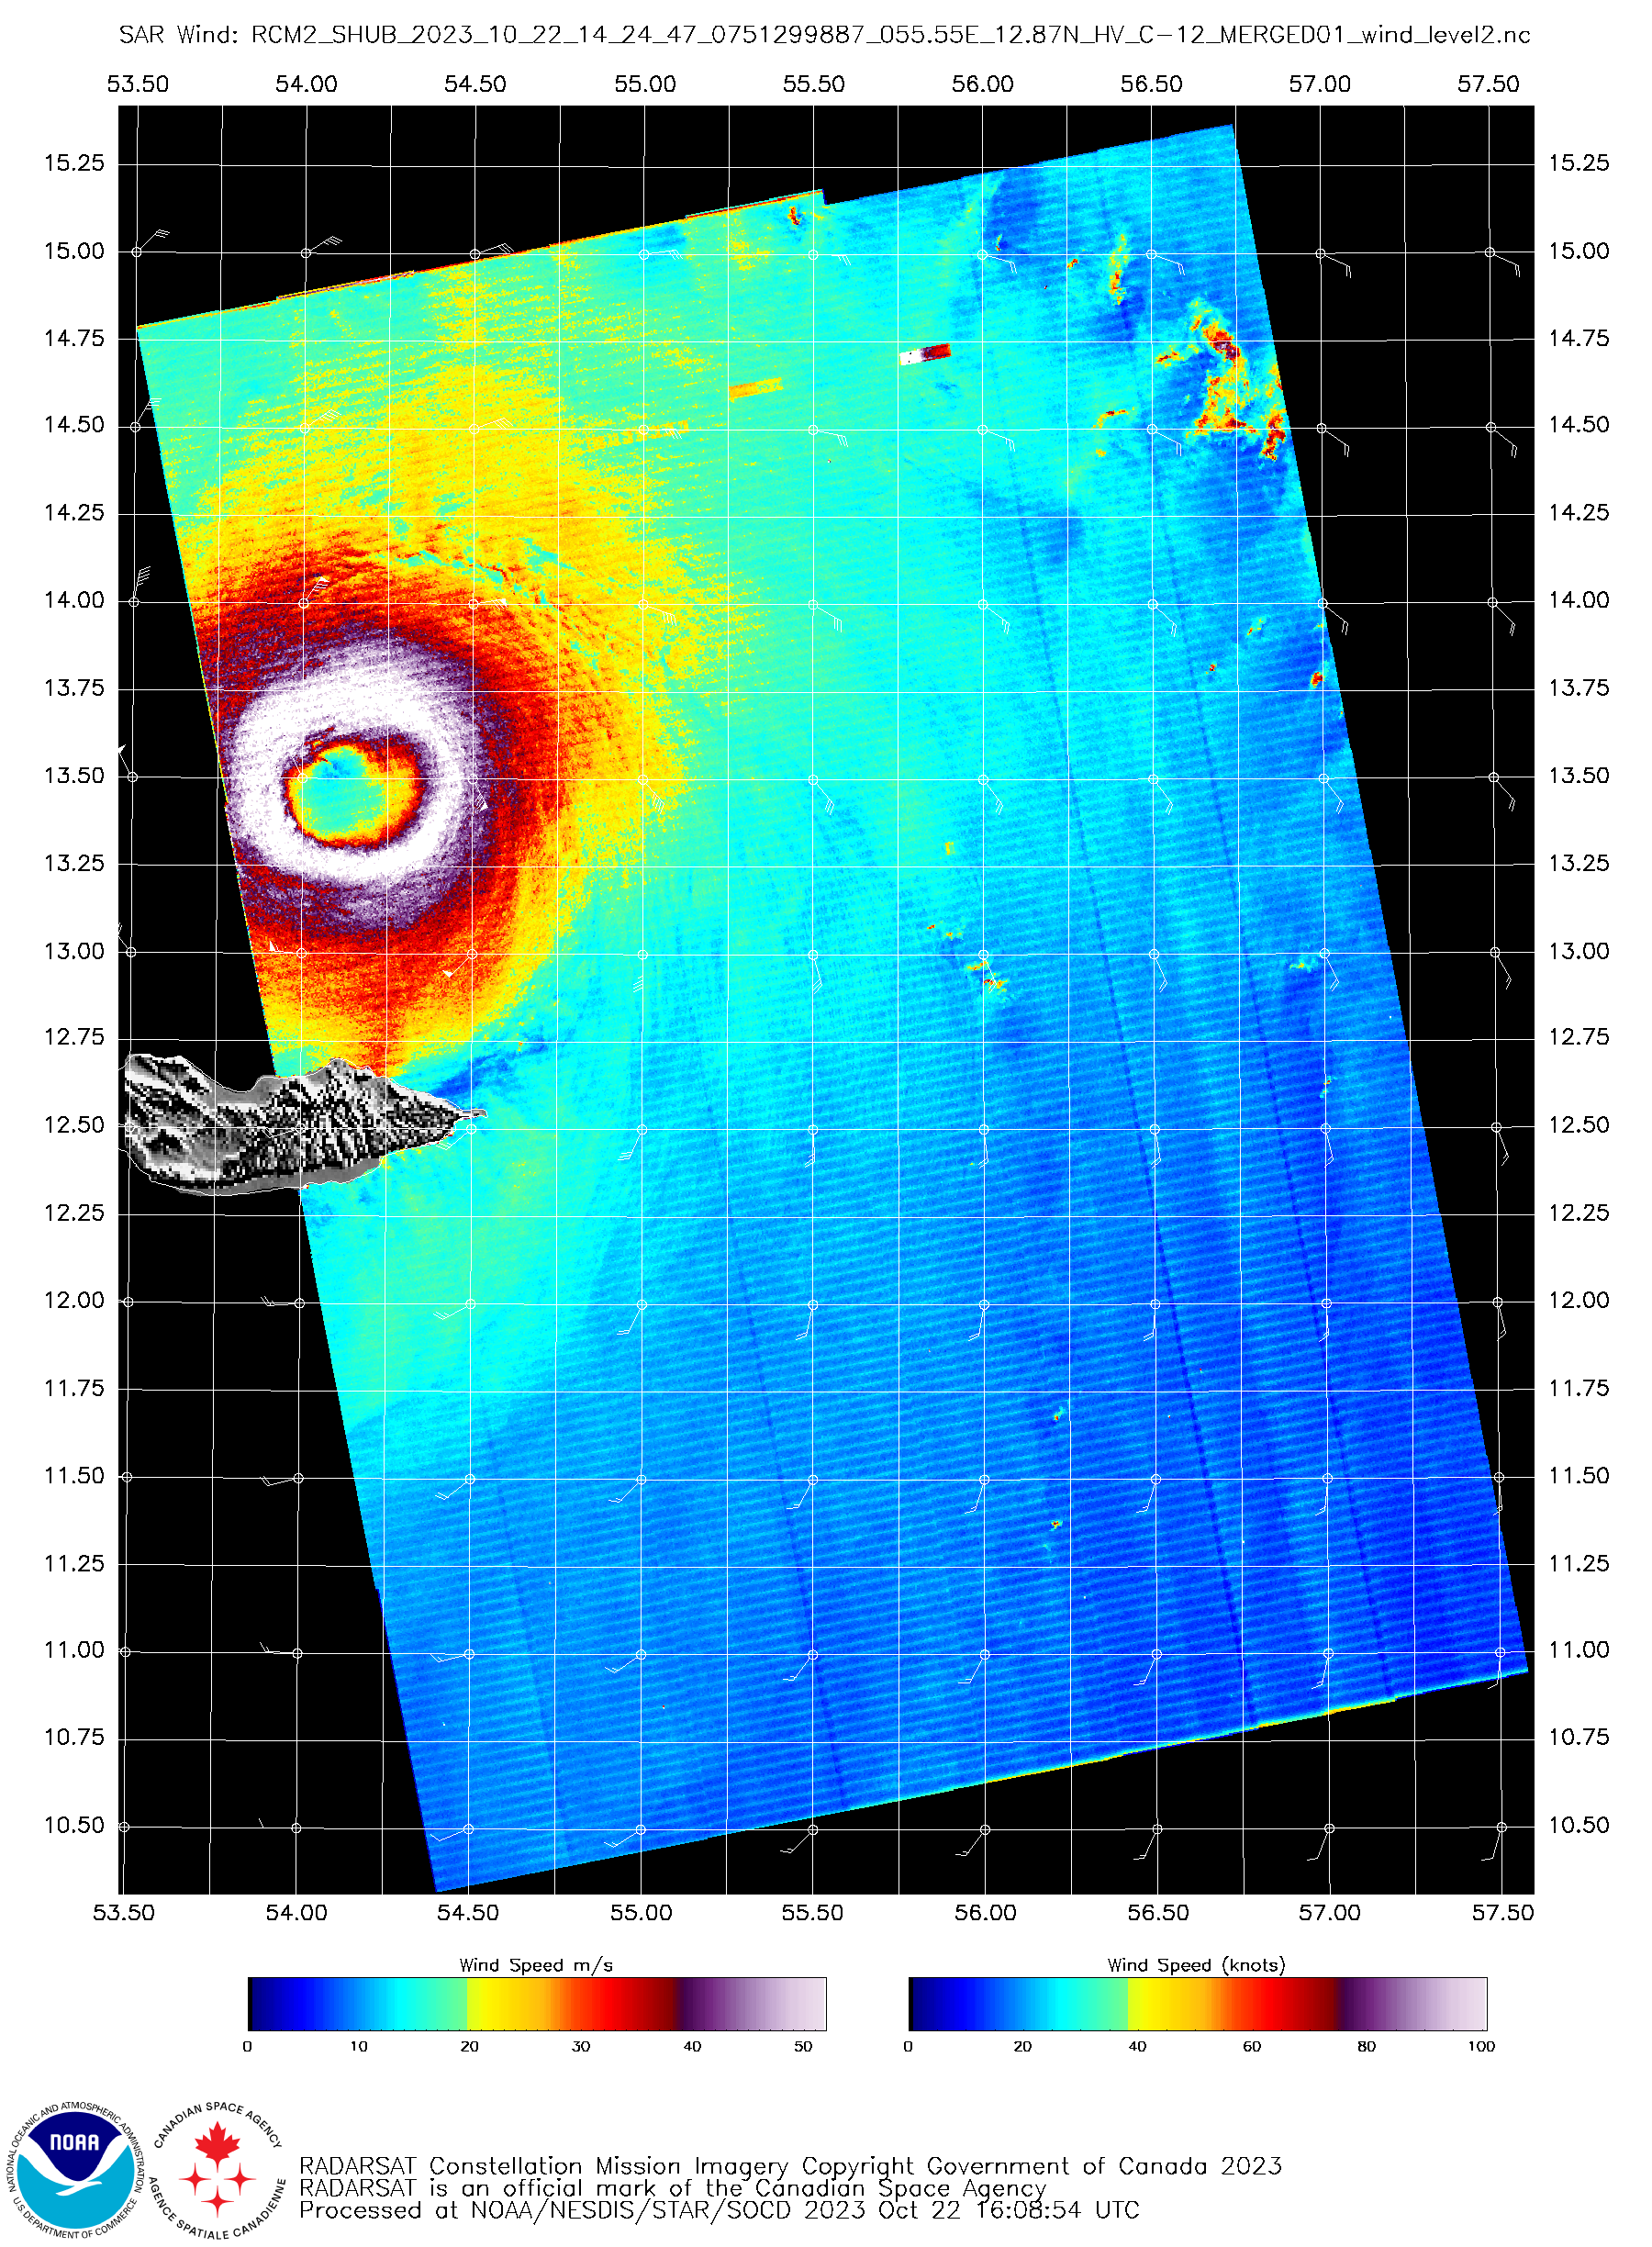
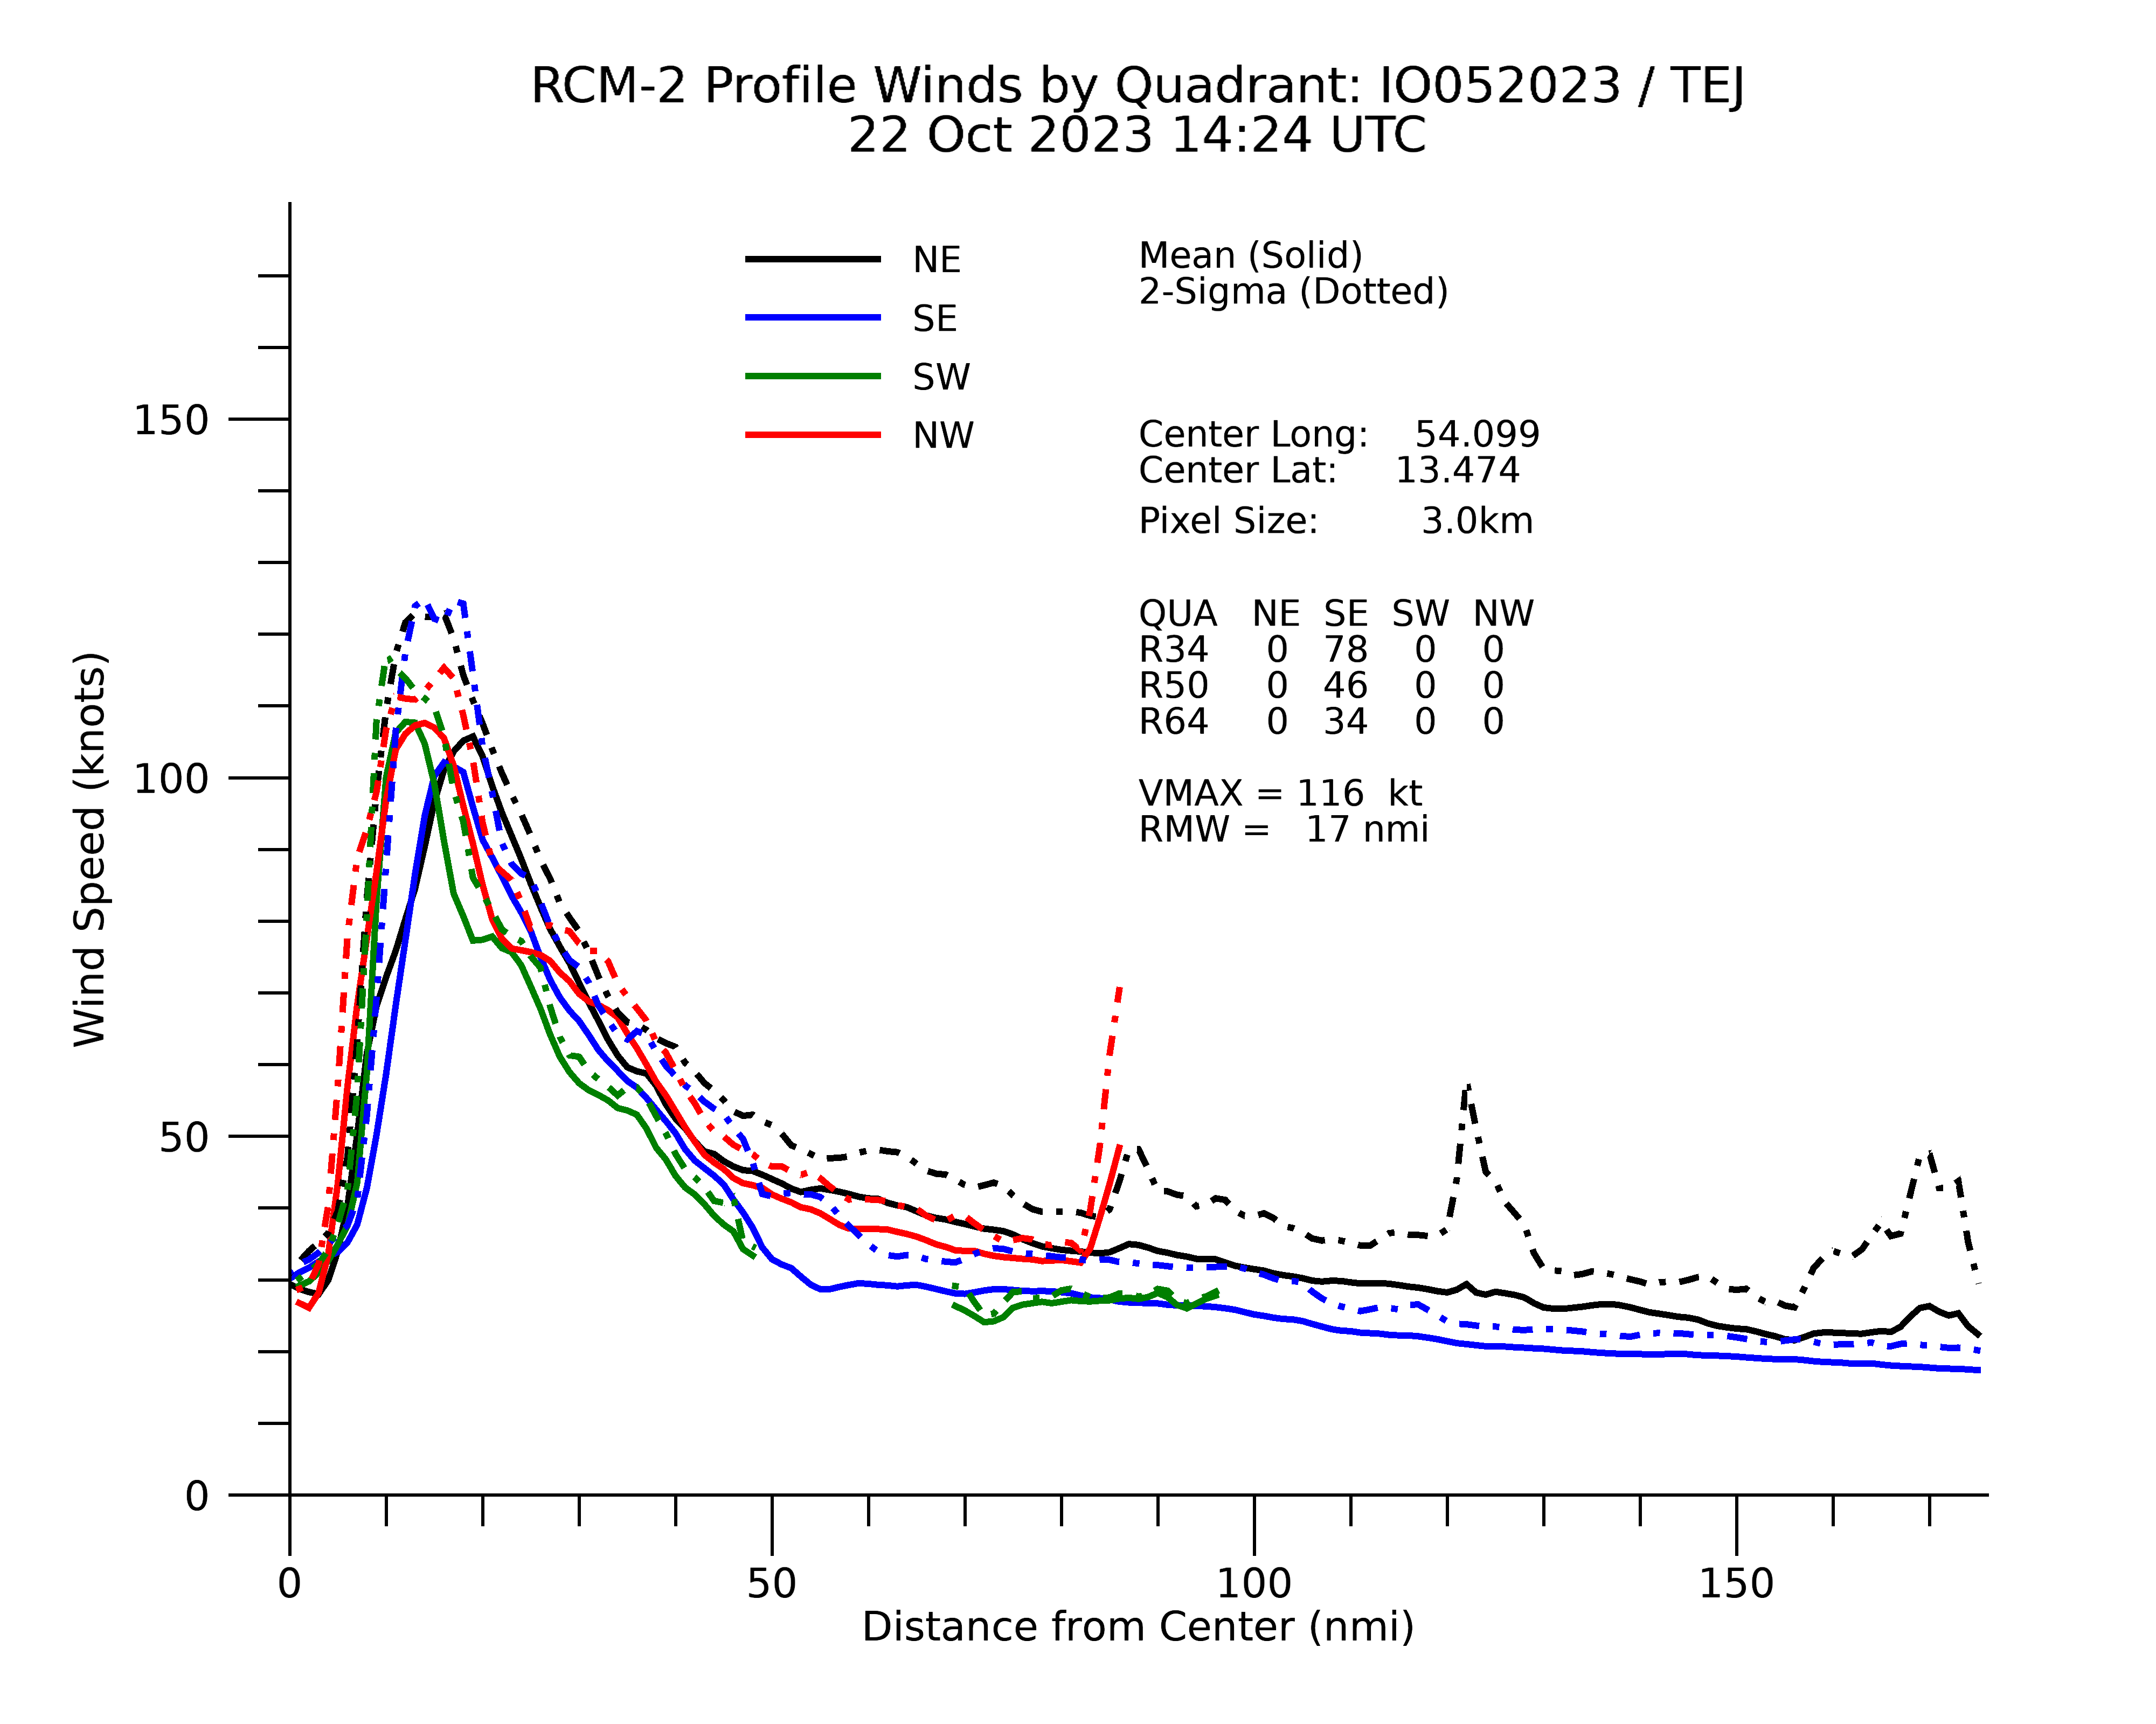
RCM-2 overflew Tej shortly after 1400 UTC on 22 October 2023 (link). The SAR wind analysis, below, shows a well-defined eye structure at that time to the north of Socotra Island. The wind analysis (here) shows peak winds over 100 knots.
RCM2 SAR Wind analysis over Cyclone Tej, 1424 UTC on 22 October 2023 (Click to enlarge)
Strong gap winds accelerating out of the Copper River Valley — located along the coast of southcentral Alaska — were lofting fine particles of glacial silt/sand, and transporting those aerosols southward across the Gulf of Alaska during 20-22 October 2023. 10-minute GOES-18 (GOES-West) Dust Red-Green-Blue (RGB) images created using Geo2Grid (above) displayed the... Read More
GOES-18 Dust RGB images, from 1300 UTC on 20 October to 1340 UTC on 22 October [click to play animated GIF | MP4]
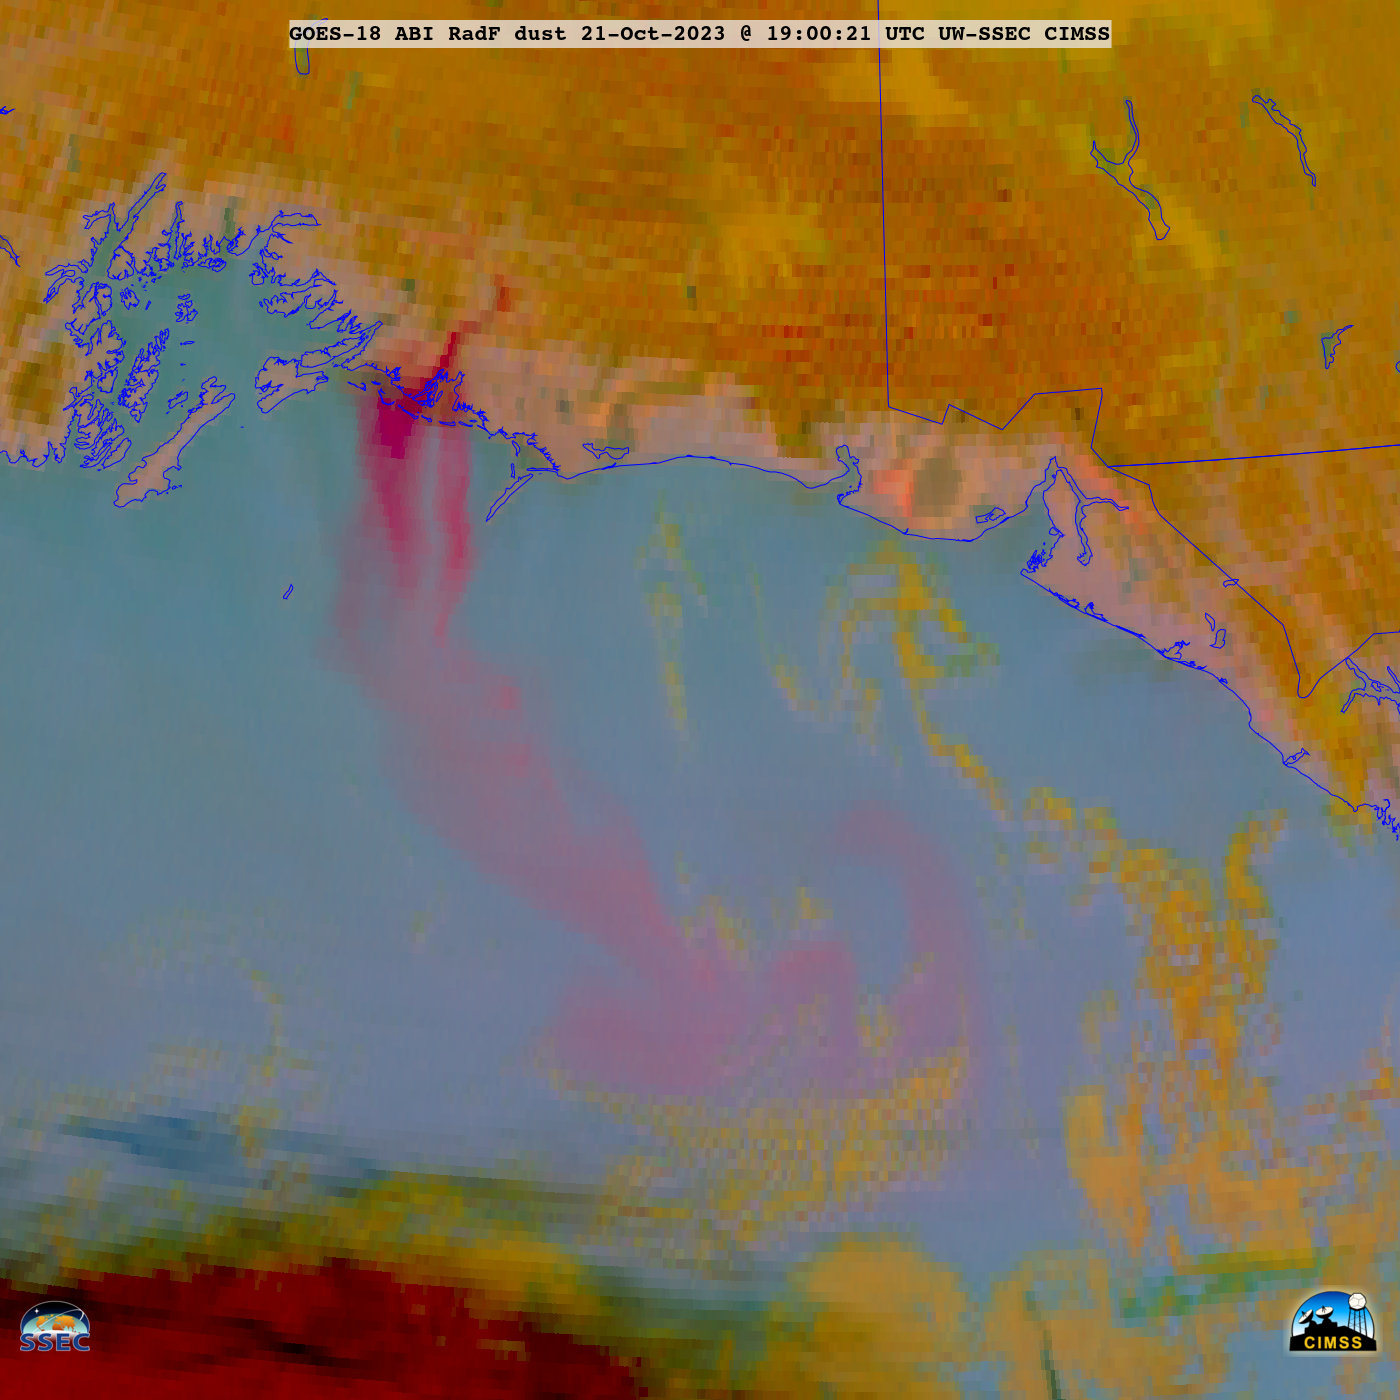
Strong gap winds accelerating out of the Copper River Valley — located along the coast of southcentral Alaska — were lofting fine particles of glacial silt/sand, and transporting those aerosols southward across the Gulf of Alaska during 20-22 October 2023. 10-minute GOES-18 (GOES-West)Dust Red-Green-Blue (RGB) images created using Geo2Grid (above) displayed the plume of airborne silt/dust (shades of pink) during that 48-hour period.
During the daylight hours on 21 October, GOES-18 True Color RGB images (below) showed the long plume as it curled southeastward across the Gulf of Alaska. The hazy plume of blowing silt/dust could be seen moving down the narrow Copper River Valley before emerging from the coast.
GOES-18 True Color RGB images, from 1640 UTC on 21 October to 0130 UTC on 22 October [click to play animated GIF | MP4]
Surface analyses, from 0000 UTC on 20 October to 0600 UTC on 22 October [click to play animated GIF | MP4]
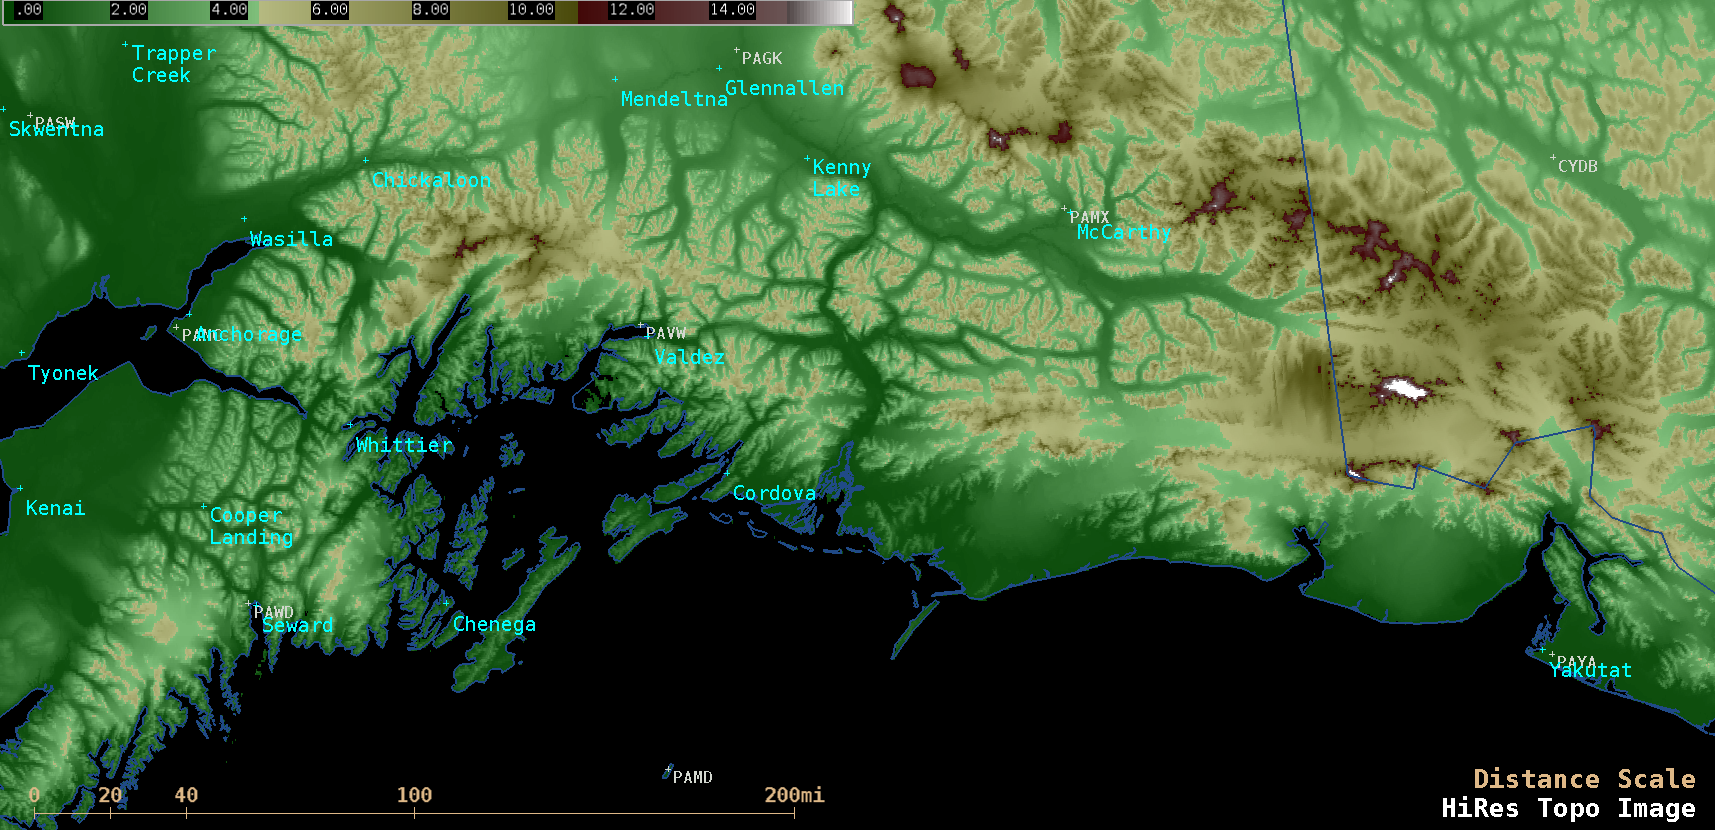
The strong gap wind flow resulted from a tight coastal pressure gradient as a ridge of high pressure began building across southern Interior Alaska (above), which forced surface winds to accelerate down the Copper River Valley (located northeast and east of Cordova, as seen in the topography image below) toward the Gulf of Alaska.
Topography image centered on the Copper River Valley [click to enlarge]
Glacial silt from the riverbed of the Copper River has made it over the Cordova area as seen from the photos below! Credit to the Cordova Telecom Cooperative (left pic looking East from the West side of the Delta) and the FAA (right pic looking Southwest from the airport).#AKwxpic.twitter.com/Au114HULMv
Prior to sunrise on 22 October, the western edge of the plume briefly drifted across Middleton Island (PAMD), where it reduced the surface visibility to 6 miles from 1300-1500 UTC (below).
Plot of surface report data from Middleton Island [click to enlarge]
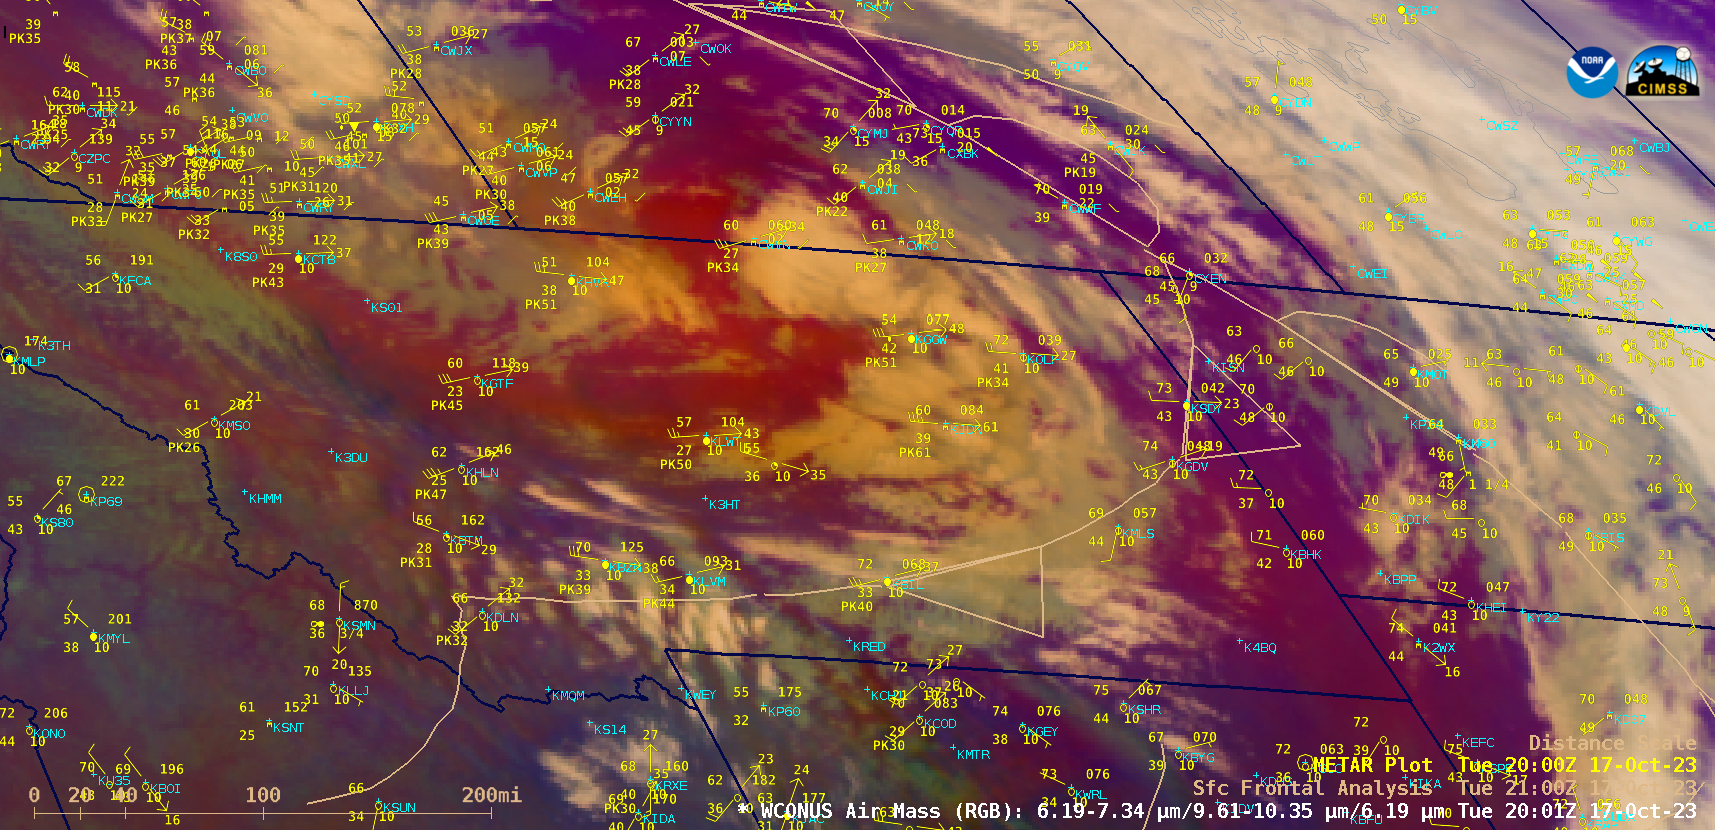
GOES-18 (GOES-West) Air Mass RGB images (above) showed the progression of a strong cold front — associated with a deepening Alberta Clipper type of midlatitude cyclone — which produced strong winds across parts of central/eastern Montana and western North Dakota / South Dakota during the afternoon and evening hours on 17 October 2023. Notable... Read More
GOES-18 Air Mass RGB images from 1401 UTC on 17 October to 0401 UTC on 18 October, with hourly METAR surface reports plotted in yellow and 3-hourly Frontal Analyses plotted in beige [click to play animated GIF | MP4]
GOES-18 (GOES-West)Air Mass RGB images (above) showed the progression of a strong cold front — associated with a deepening Alberta Clipper type of midlatitude cyclone — which produced strong winds across parts of central/eastern Montana and western North Dakota / South Dakota during the afternoon and evening hours on 17 October 2023. Notable METAR site peak wind gusts included 61 knots (70 mph) at Jordan MT (KJDN) and Buffalo SD (K2WX), and 60 knots (69 mph) at Dickinson, ND (KDIK); in addition, a mesonet station at Beach ND recorded a peak wind gust of 66 knots (76 mph).
It's getting windy out west. Showers are bringing down gusty winds from above the surface. Froid, Beach, Sentinal Butte and Beach have all had gusts above 60 mph in last hour. Beach "winning" with 76 mph gust. @NWSBismarck has just issued a High Wind Warning for the area. #ndwxpic.twitter.com/NMhZ511hMh
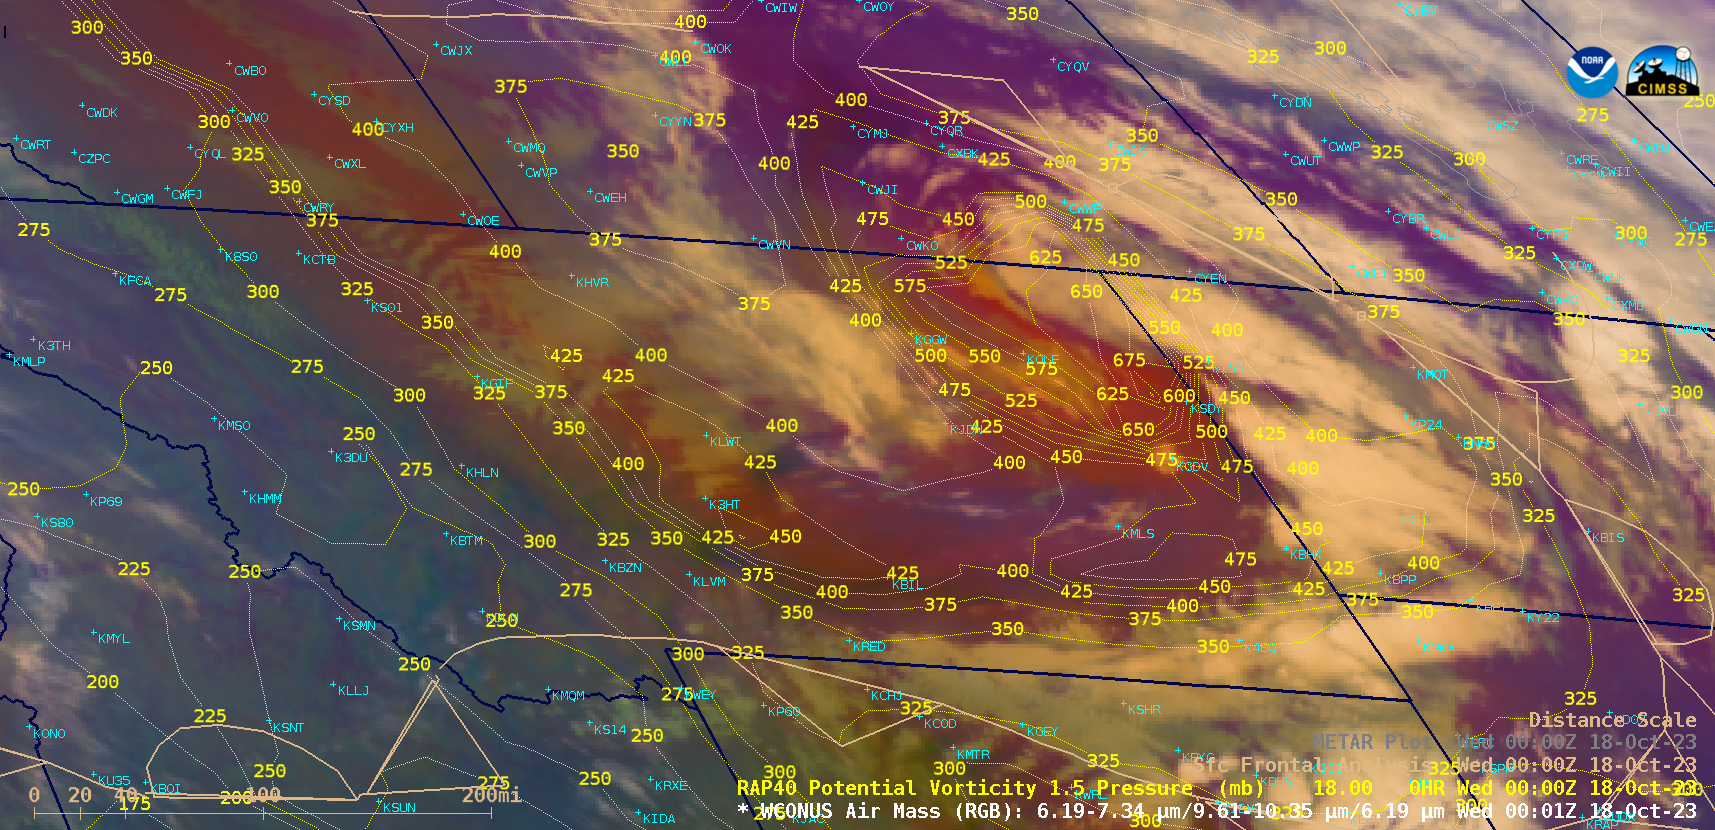
GOES-18 Air Mass RGB image at 0001 UTC on 18 October, with contours of RAP40 model PV1.5 Pressure plotted in yellow [click to enlarge]
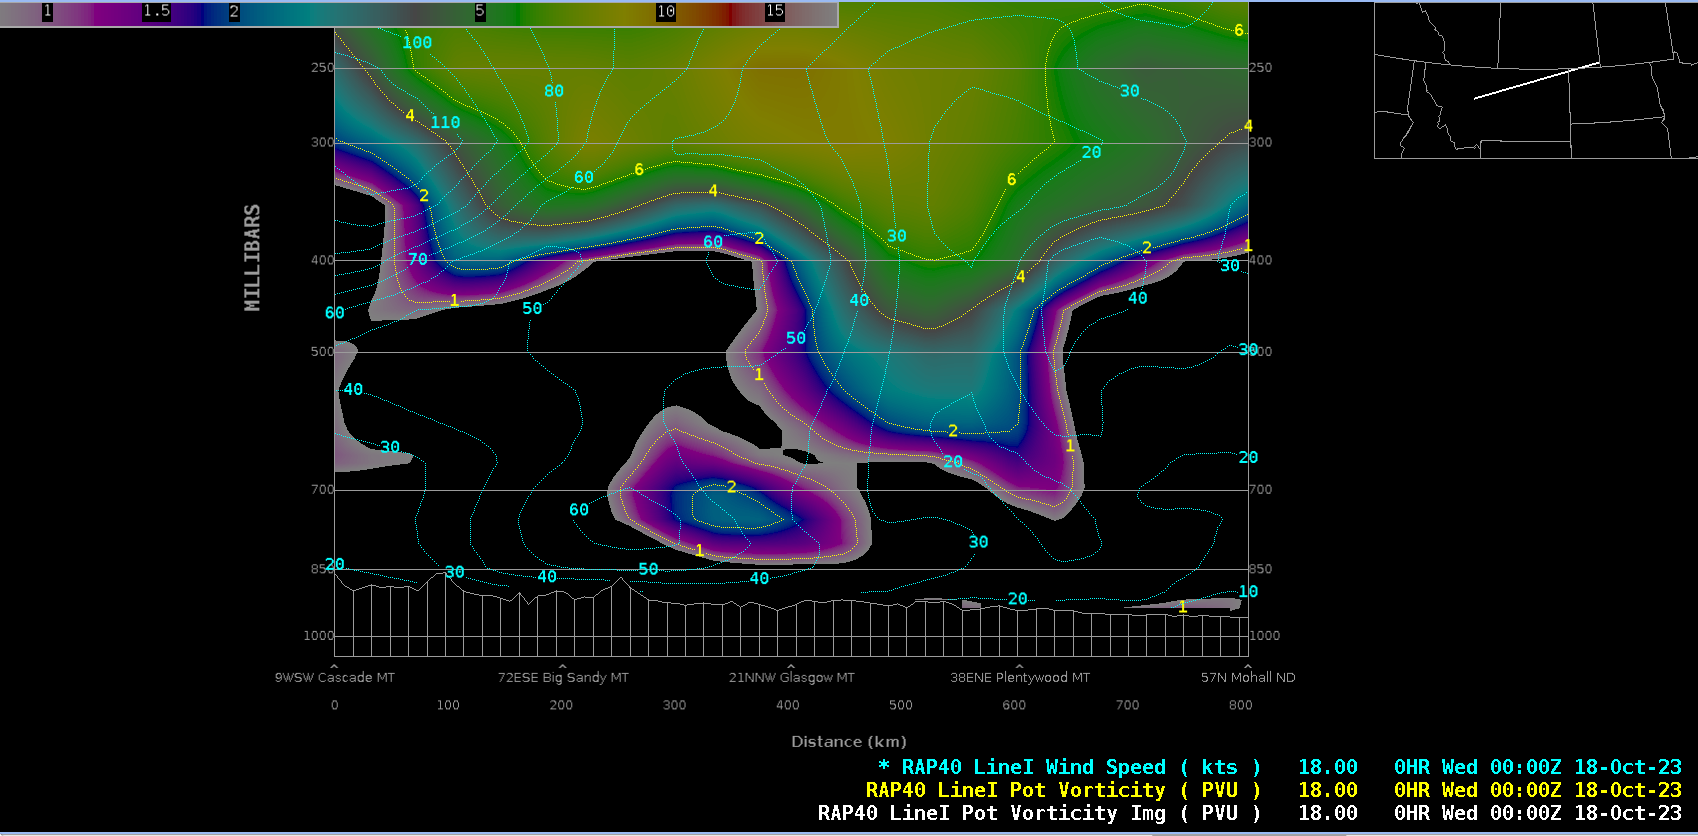
The brighter shades of orange-red in the Air Mass RGB imagery highlighted dry, ozone-rich air indicative of the lower tropopause associated with this disturbance. Contours of the “dynamic tropopause” — taken to be the pressure of the RAP40 model PV1.5 surface — portrayed the tropopause extending down to the 650 hPa pressure level over far northeastern Montana (above). A SW-to-NE oriented cross section from western Montana to the US/Canada border (below) also showed the pronounced lowering of stratospheric values of Potential Vorticity (greater than 1.5 PVU) over northeastern Montana.
Cross section of RAP40 model Potential Vorticity and Wind Speed along Line I-I’, at 0000 UTC on 18 October [click to enlarge]
GOES-18 Mid-level Water Vapor (Band 09, 6.9 µm) images, with plots of Band 09 Derived Motion Winds at 0101 UTC and 0116 UTC on 18 October [click to enlarge]
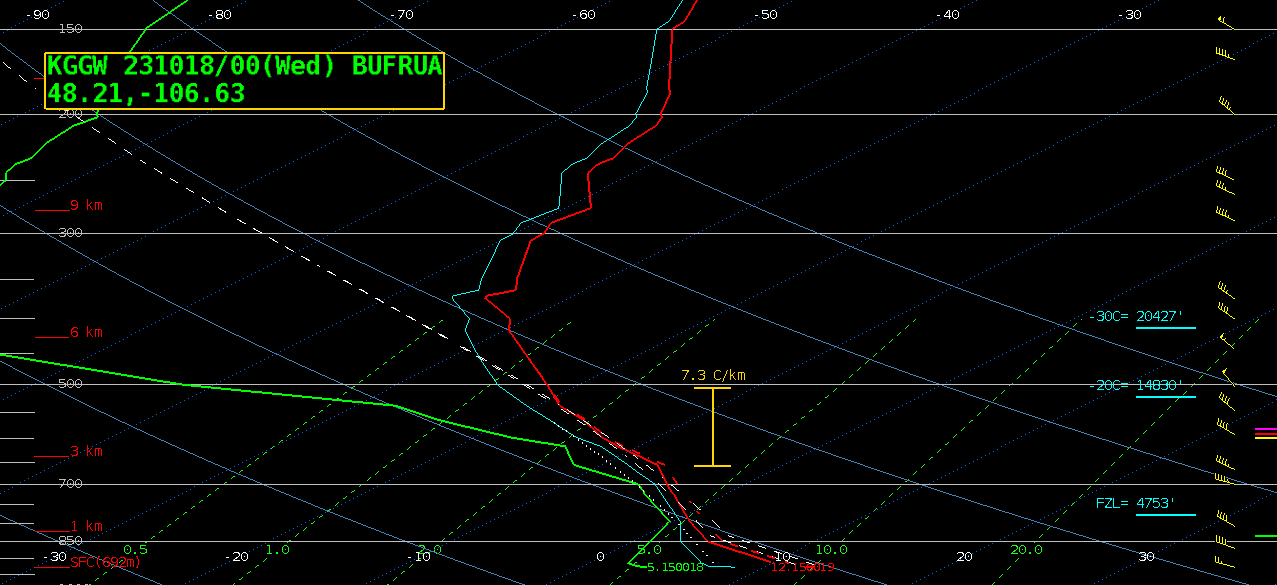
2 examples of GOES-18 Mid-level Water Vapor (6.9 µm) imagery with plots of associated Derived Motion Winds(above) showed speeds greater than 50 knots. A plot of rawinsonde data from Glasgow, Montana at 0000 UTC on 18 October (below) depicted steep mid-level (7.3 C/km) and boundary layer (near dry adiabatic) temperature lapse rates, which were aiding the downward transport of momentum (strong winds) from the middle troposphere to the surface. The aforementioned low tropopause was also evident in the temperature profile, near 370 hPa (which had descended dramatically since 1200 UTC) — with very dry air above 500 hPa.
Plot of rawinsonde data from Glasgow, Montana at 0000 UTC on 18 October [click to enlarge]
GOES-R Satellites (GOES-16 as GOES-East and GOES-18 as GOES-West) provide single-channel observations, such as the clean window infrared image above that can be used to identify features. In the example above, a mid-level cloud deck stretches southeastward from the Samoan islands that surround 170oW Longitude. Higher clouds with with embedded... Read More
GOES-18 Clean Window (Band 13, 10.3 µm) infrared imagery, hourly from 0600-1100 UTC, 17 October 2023 (Click to enlarge)
GOES-R Satellites (GOES-16 as GOES-East and GOES-18 as GOES-West) provide single-channel observations, such as the clean window infrared image above that can be used to identify features. In the example above, a mid-level cloud deck stretches southeastward from the Samoan islands that surround 170oW Longitude. Higher clouds with with embedded convection are apparent in the northeastern quadrant of the animation, with a noticeable convective feature forming from 1000 to 1100 UTC. A useful Level 2 product to include in a Clean Window infrared image is the Total Precipitable Water: this is a clear-sky only product and thus gives information where the Band 13 image is returning surface information. The animation below has TPW underlain under the Band 13 image and the default AWIPS enhancement for TPW has been altered: the driest value is 0.5 (inches) rather than 0.0. The TPW distribution allows a viewer to note that the cloud band to the southeast of the Samoan Islands is aligned with a moisture gradient. That deep convective complex is developing near the southern gradient of that deepest moisture. The driest atmosphere is south of 20oS in the image below.
GOES-18 Clean Window (Band 13, 10.3 µm) infrared imagery along with Total Precipitable Water (TPW), hourly from 0600-1100 UTC, 17 October 2023 (Click to enlarge)
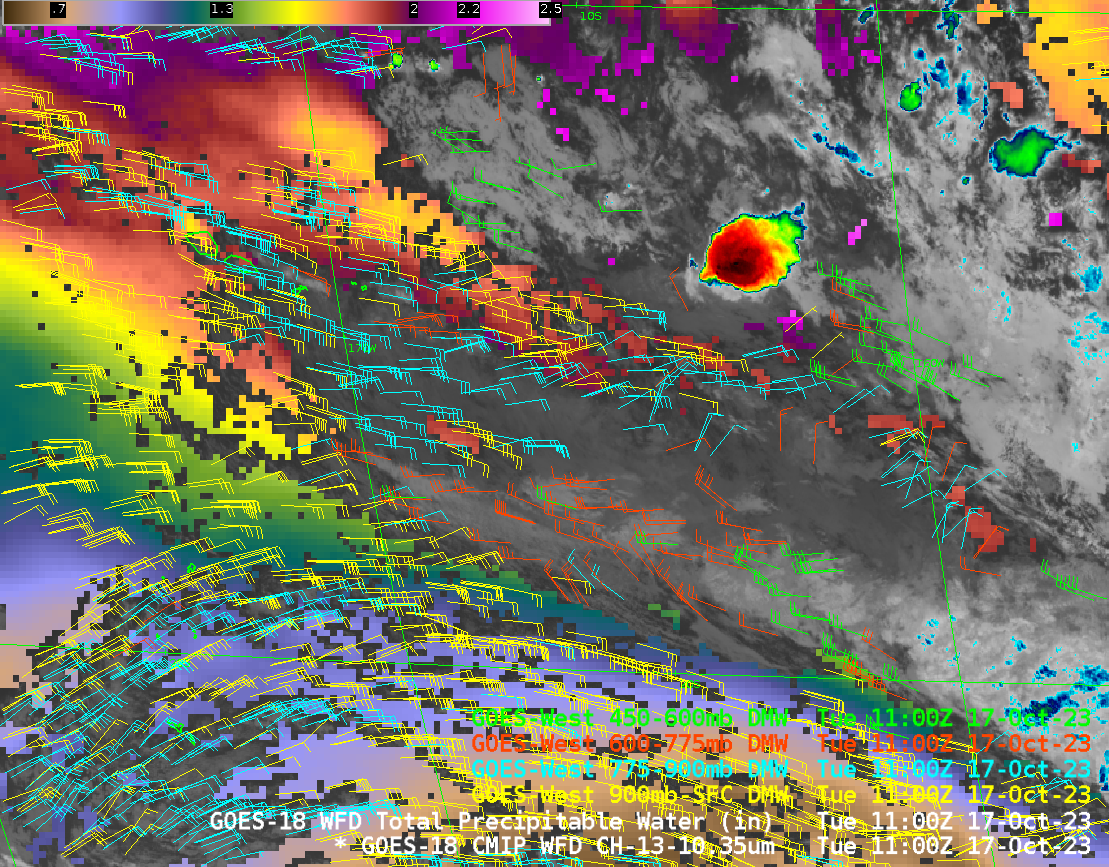
Derived Motion Wind vectors are another Level 2 product, and they can be plotted as a function of pressure, as shown below. This added information provides useful context to the infrared imagery. At lower levels (surface-900 mb), cloud motion is brisk and from the east and southeast at 20-25 knots. From 775-900 mb, motion is more easterly; derived vectors have appeared on top of the cloud band that stretches southeastward from the Samoan islands. The convection that develops between 1000 and 1100 UTC is within a region of cyclonic winds. Between 600-775 mb, winds are more westerly, and the convection that is developing between 1000 and 1100 UTC is within a region of diffluence associated with anticyclonic motion. Winds from 450-600 mb also show diffluence in the region where convection developed.
GOES-18 Clean Window (Band 13, 10.3 µm) infrared imagery, and Total Precipitable Water hourly from 0600-1100 UTC, 17 October 2023; Derived Motion Wind vectors are plotted as well, from 450-600 mb (upper left), 600-775 mb (lower left), 775-900 mb (upper right) and 900mb – surface (lower right) (Click to enlarge)
The animation below shows the derived winds all plotted on top of each other. AWIPS will also plot vectors such that the wind barb color is a function of wind speed. Low-level winds at this time are mostly derived from the 3.9 µm imagery. High-level winds are derived from Water Vapor channels and from 11.2 µm imagery.
GOES-18 Clean Window (Band 13, 10.3 µm) infrared imagery, and Total Precipitable Water hourly from 0600-1100 UTC, 17 October 2023; Derived Motion Wind vectors are plotted as well, from 450-600 mb (green) 600-775 mb (dark orange), 775-900 mb (cyan) and 900mb – surface (yellow) (Click to enlarge)
The pronounced shift in wind direction with height is also apparent from the 1200 UTC 17 October 2023 Rawinsonde from Pago Pago, below (from this link).
SkewT/Log P temperature/moisture plot at Pago Pago, American Samoa, 1200 UTC 17 October 2023 (Click to enlarge) Note the pronounced wind shift between 800 and 600 mb!
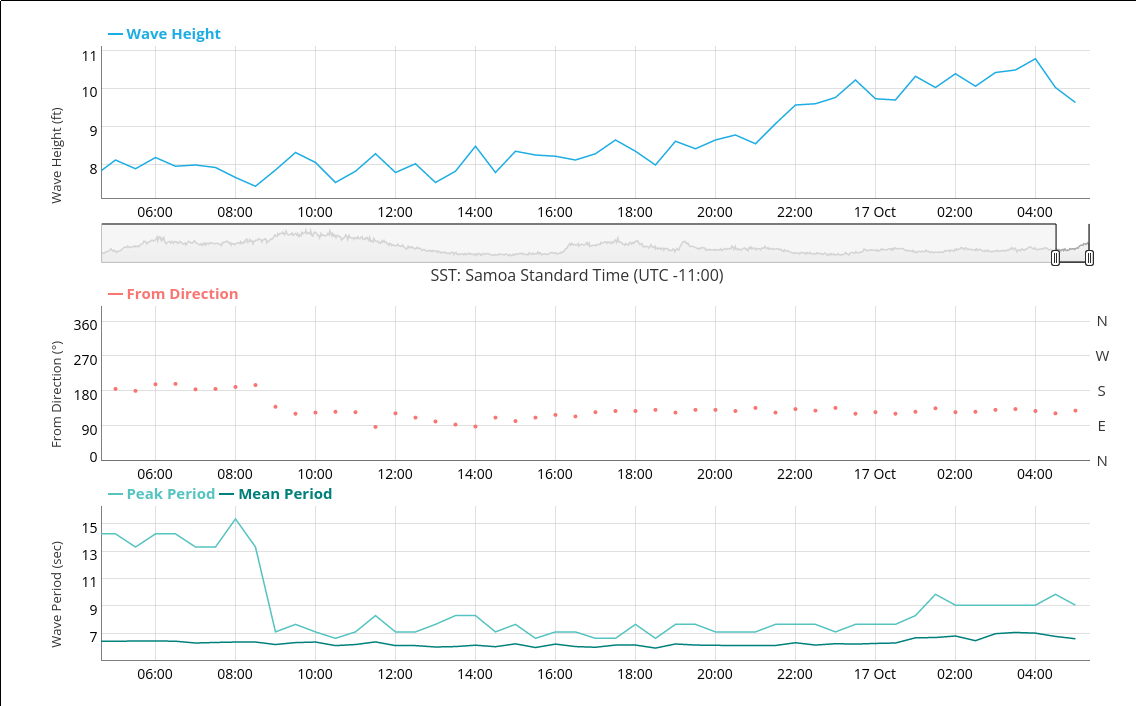
The persistent winds have raised seas around American Samoa. The buoy at Aunu’u below shows seas climbing to above 10 feet before sunrise American Samoa Time on the 17th. One other recent change that has happened is the cessation of the very long-period southerly swell that had persisted for several days through yesterday.
Wave Heights, Wave Direction, and Peak Periods, 0600 SST 16 August – 0400 SST 17 August 2023 (Click to enlarge)
In this environment with persistent winds, Tutuila experienced rain activity that was unforecast by numerical models. Night Microphysics RGB imagery, below, from the CSPP Geosphere site, show the evolution of cloud lines from light violet to violet with a reddish tint as clouds grow in height and start to precipitate.
Nighttime Microphysics RGB, 0500 – 1310 UTC on 17 October 2023
_______________
GOES-18 Cloud Top Height derived product, from 0500 UTC to 1520 UTC on 17 October (courtesy Scott Bachmeier, CIMSS) [click to play animated GIF | MP4]
Two other GOES-18 Level 2 derived products that helped to further characterize the rain-producing cloud lines were Cloud Top Height(above) and Cloud Top Phase(below). As cloud-top heights increased and reached colder temperatures, their cloud-top phase changed from water (cyan) to supercooled (light green) then to mixed supercooled/ice (darker green). Note that not all of the hourly METAR surface reports were plotted by AWIPS: at 0820 UTC and 0850 UTC, heavy rain reduced the surface visibility to 1.0 and 0.5 mile, respectively, at Pago Pago International Airport on Tutuila Island, American Samoa (plot | text).
GOES-18 Cloud Top Phase derived product, from 0500 UTC to 1520 UTC on 17 October (courtesy Scott Bachmeier, CIMSS) [click to play animated GIF | MP4]
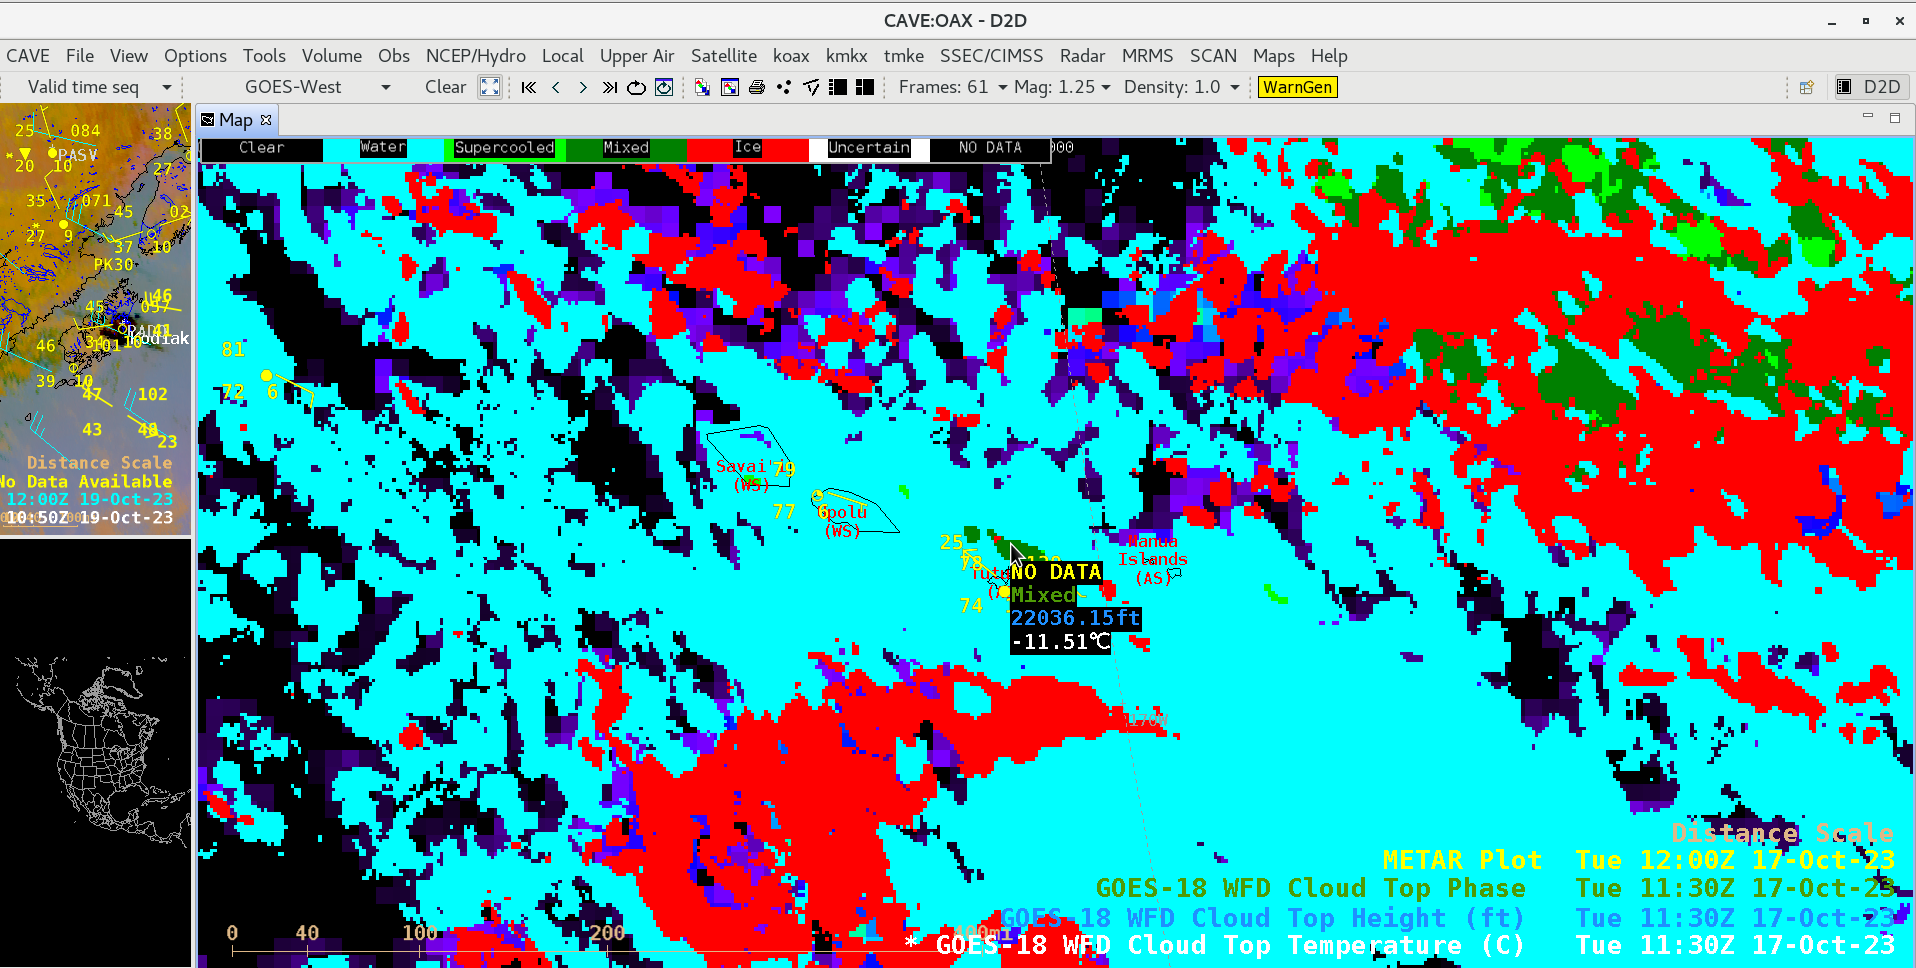
Cursor sampling of GOES-18 Cloud Top Phase, Cloud Top Height and Cloud Top Temperature at 1130 UTC — when the maximum height of the cloud line in the vicinity of Tutuila was 22036 ft — is shown below.
Cursor sample of GOES-18 Cloud Top Phase (green), Cloud Top Height (blue) and Cloud Top Temperature (white) Level 2 derived products at 1130 UTC on 17 October, just north of Tutuila (courtesy Scott Bachmeier, CIMSS) [click to enlarge]


