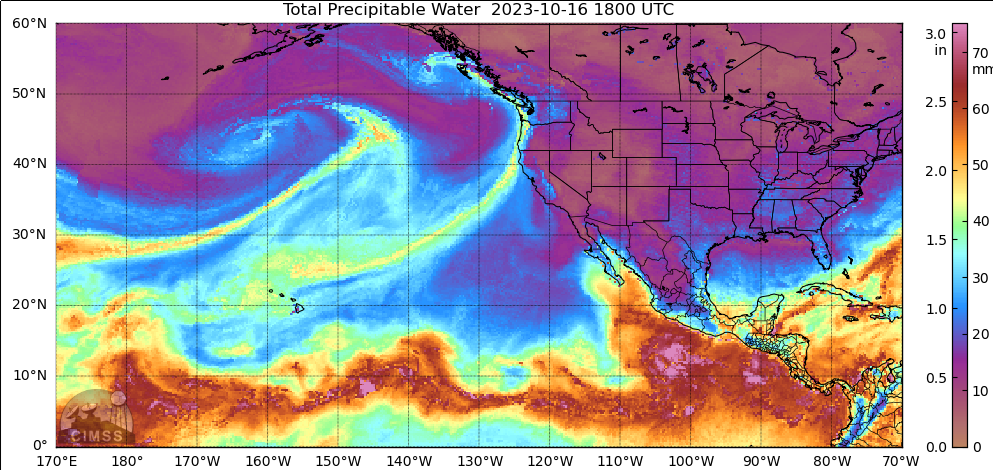
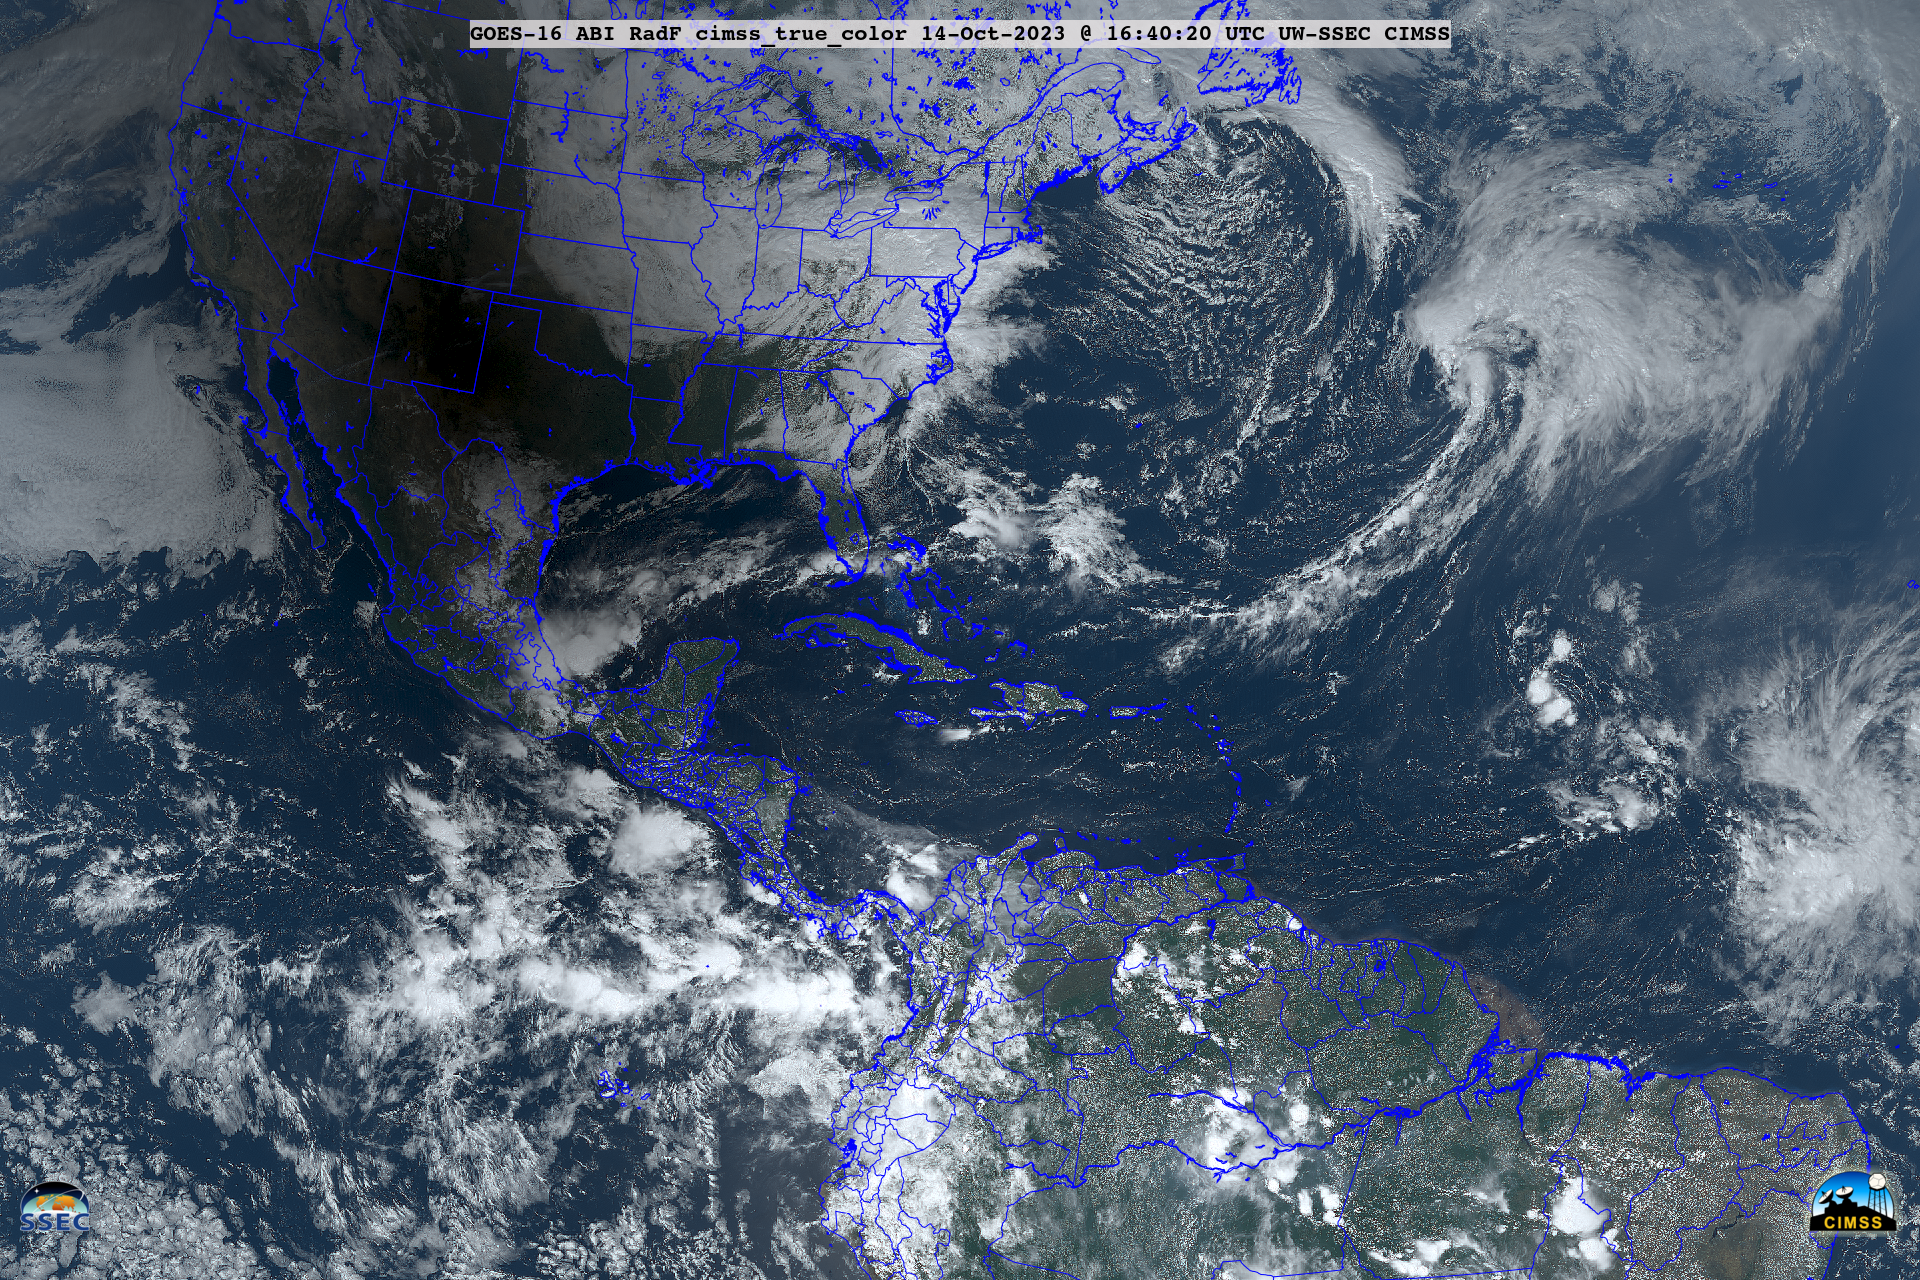
MIMIC Total Precipitable Water fields, above, (archived here), show the motion of Typhoon Bolaven as it evolved from a strong typhoon west of 150o E Longitude on 10 October to a potent extratropical cyclone approaching 150oW Longitude on 16 October 2023, at which later time a long filament of tropical moisture continued to accompany the system. True Color imagery from the CSPP Geosphere site, below, shows the elongated system with the cold front stretching to the west-southwest.
MIMIC TPW fields over the eastern Pacific at 1800 UTC on 16 October, below, show two different moist airstream; one is affecting the Pacific Northwest of the USA (and southwestern Canada) at 1800 UTC. The moisture with the remains of Bolaven is approaching from the west. The GFS model initialized on 1200 UTC on 16 October suggests the next 72 hours will be wet along Coastal British Columbia with widespread rainfalls of 4-6″ (link, from this site) .
________________

GOES-18 Air Mass RGB images, from 0600 UTC on 14 October to 2100 UTC on 16 October (courtesy Scott Bachmeier, CIMSS) [click to play animated GIF | MP4]
GOES-18 Air Mass RGB images from 14-16 October (above) showed the period during which Typhoon Bolaven made its extratropical transition to a Hurricane Force Low on 14 October and then to an expansive Storm Force Low on 16 October (surface analyses from OPC). The brighter shades of orange-red in the RGB imagery depicted a Potential Vorticity anomaly associated with this strong storm system.
At 2100 UTC on 16 October, a cross section of AK-NAM40 model Potential Vorticity and Wind Speed along Line J-J’ (below) highlighted a well-defined tropopause fold, descending into the middle troposphere below the core of a 130-140 knot jet stream (the jet axis was situated along the southern periphery of the storm).
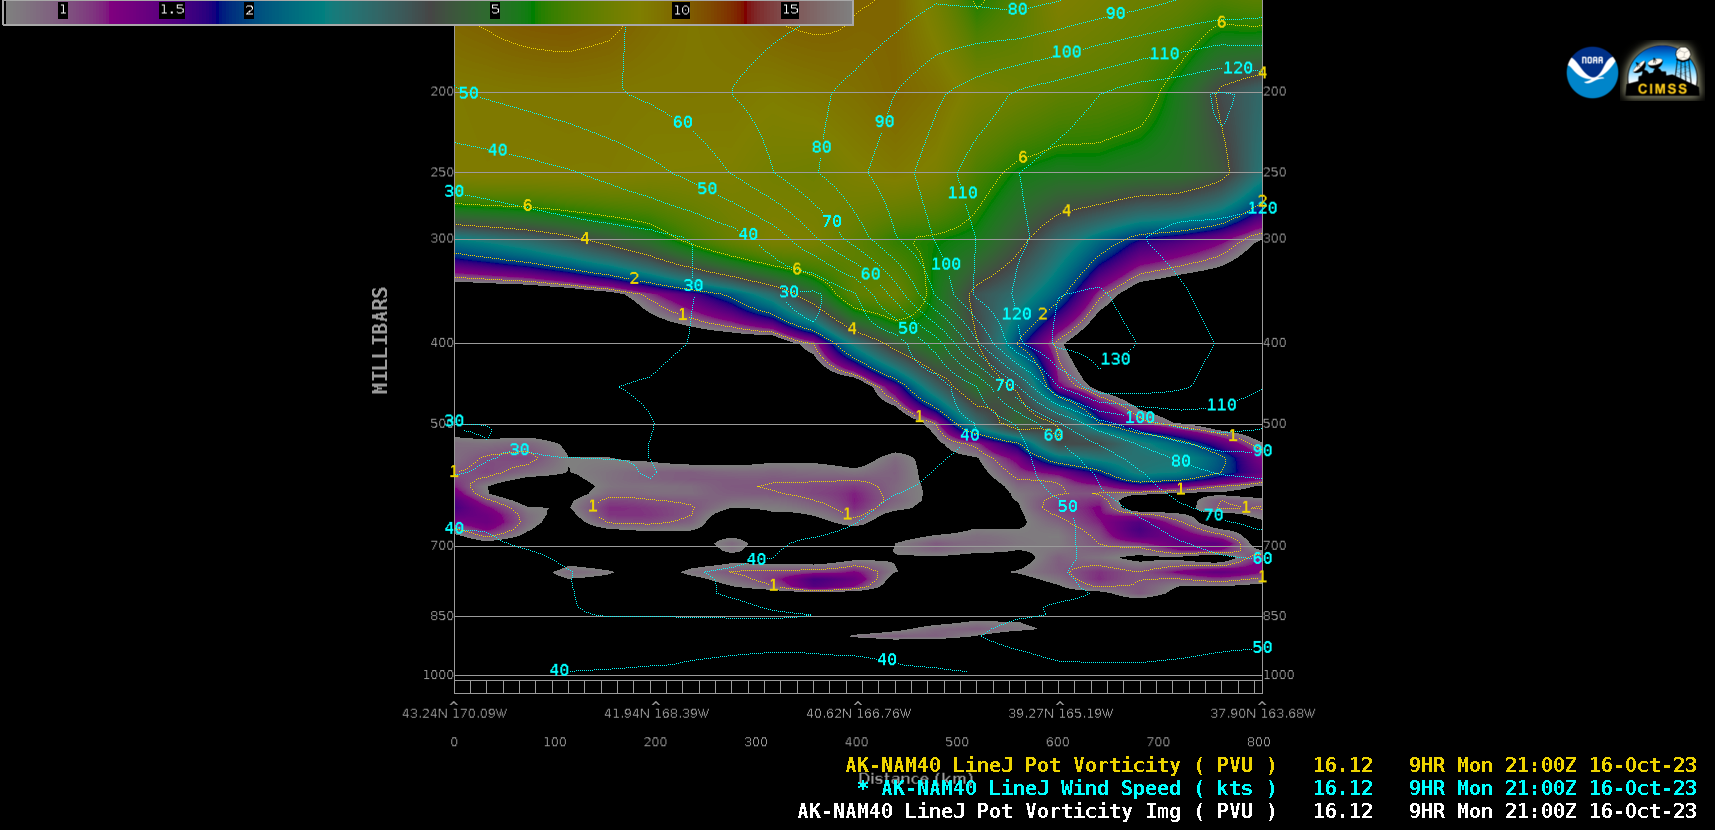
Cross section along Line J-J’, showing AK-NAM40 model Potential Vorticity and Wind Speed [click to enlarge]
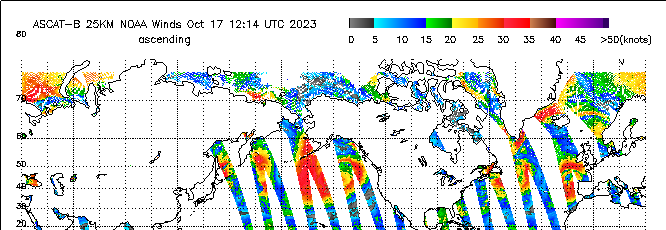
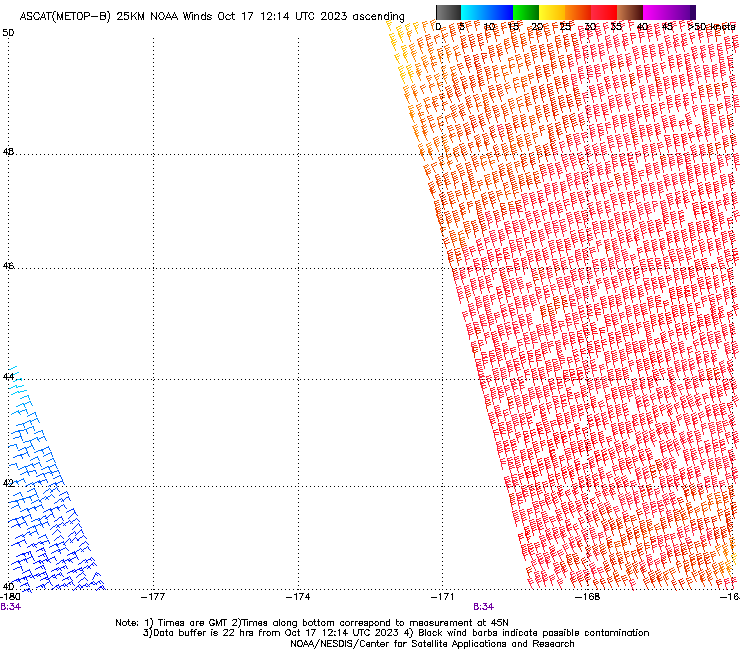
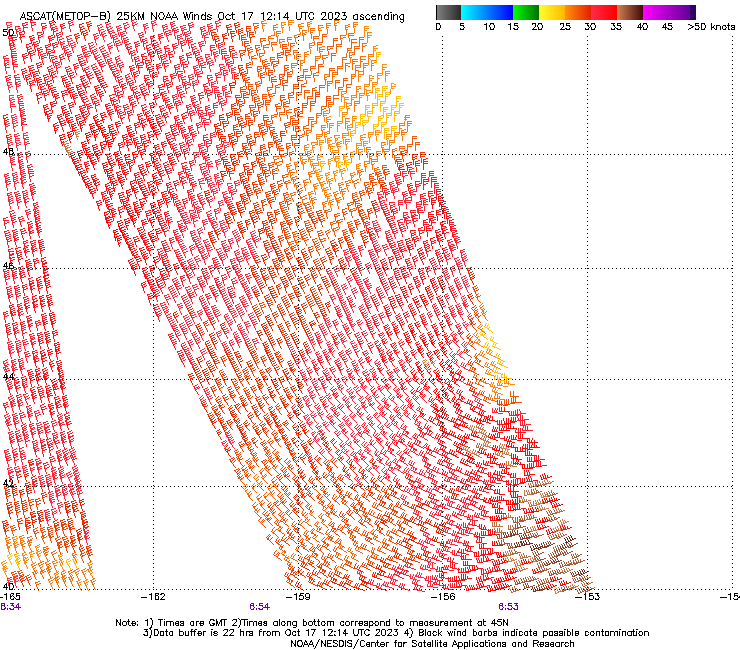
The storm has generated a particularly large wind field, as shown below (from this website). Between 0650 and 0834 UTC, when Metop-B (twice) overflew the area, the Advanced Scatterometer detected a very large region of 30-35 knot winds (red in the enhancement), with peak winds near 45 knots near 40oN, 153oW.
View only this post Read Less

