
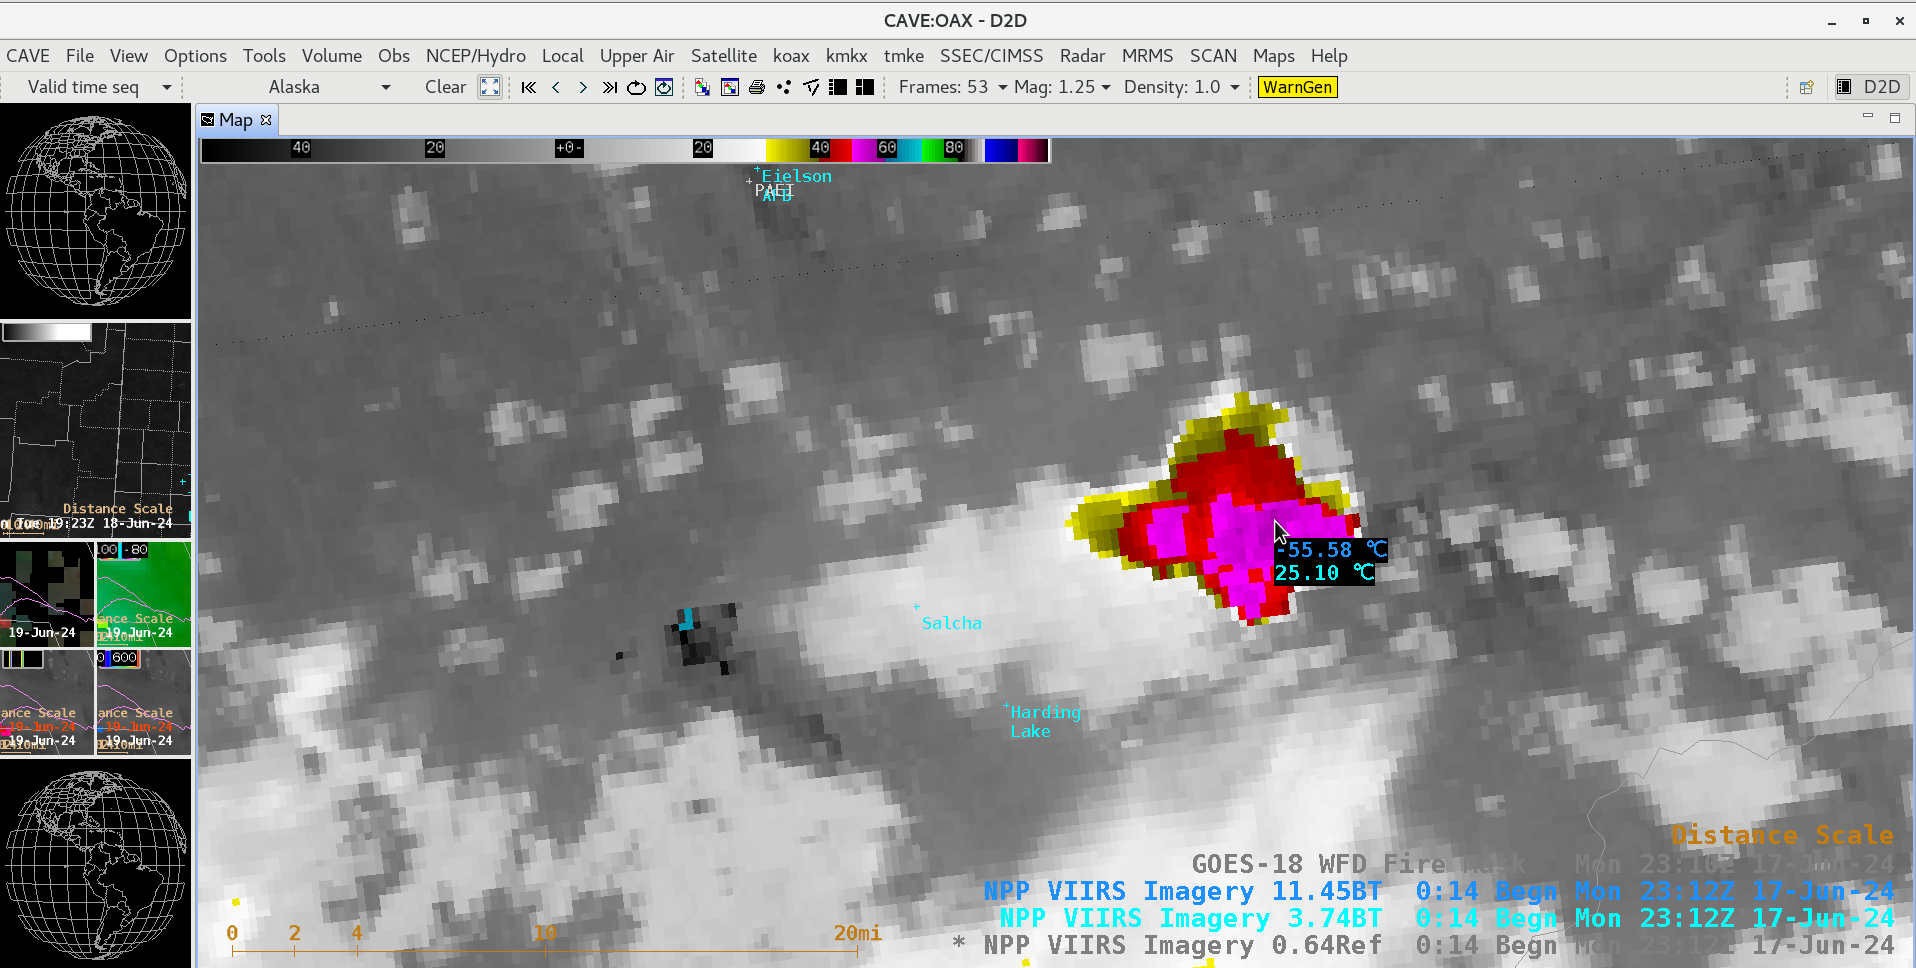
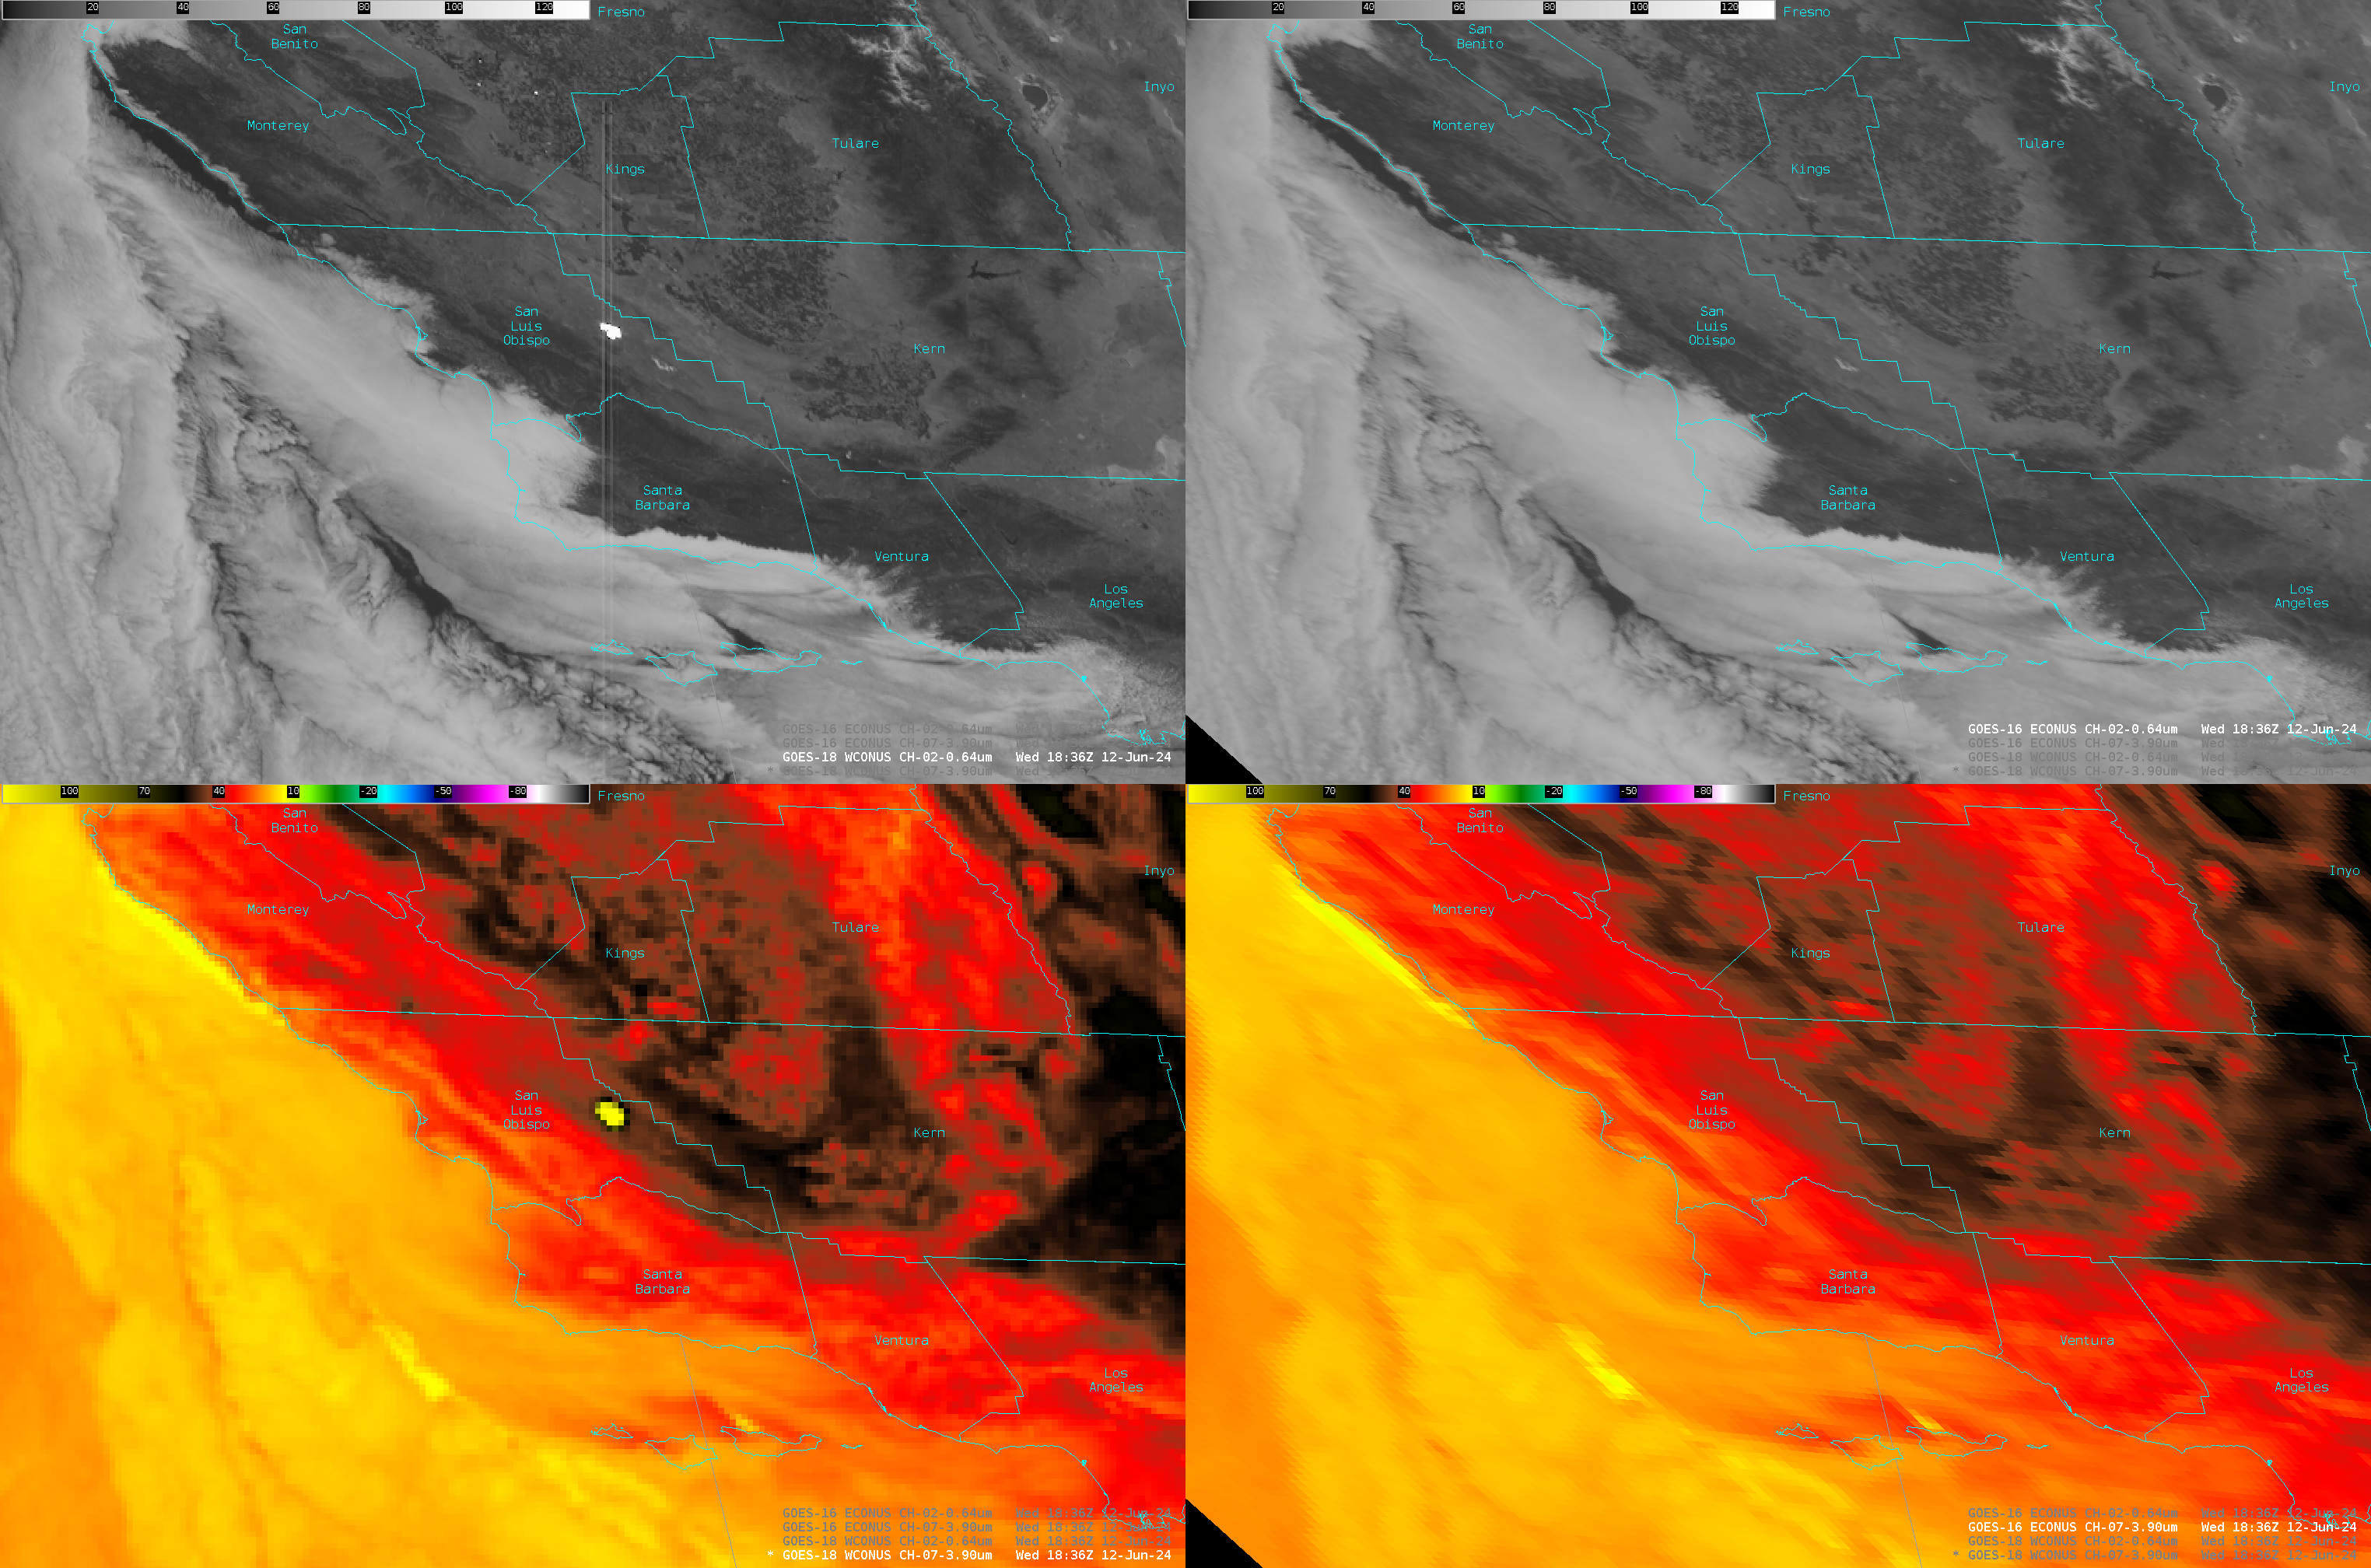
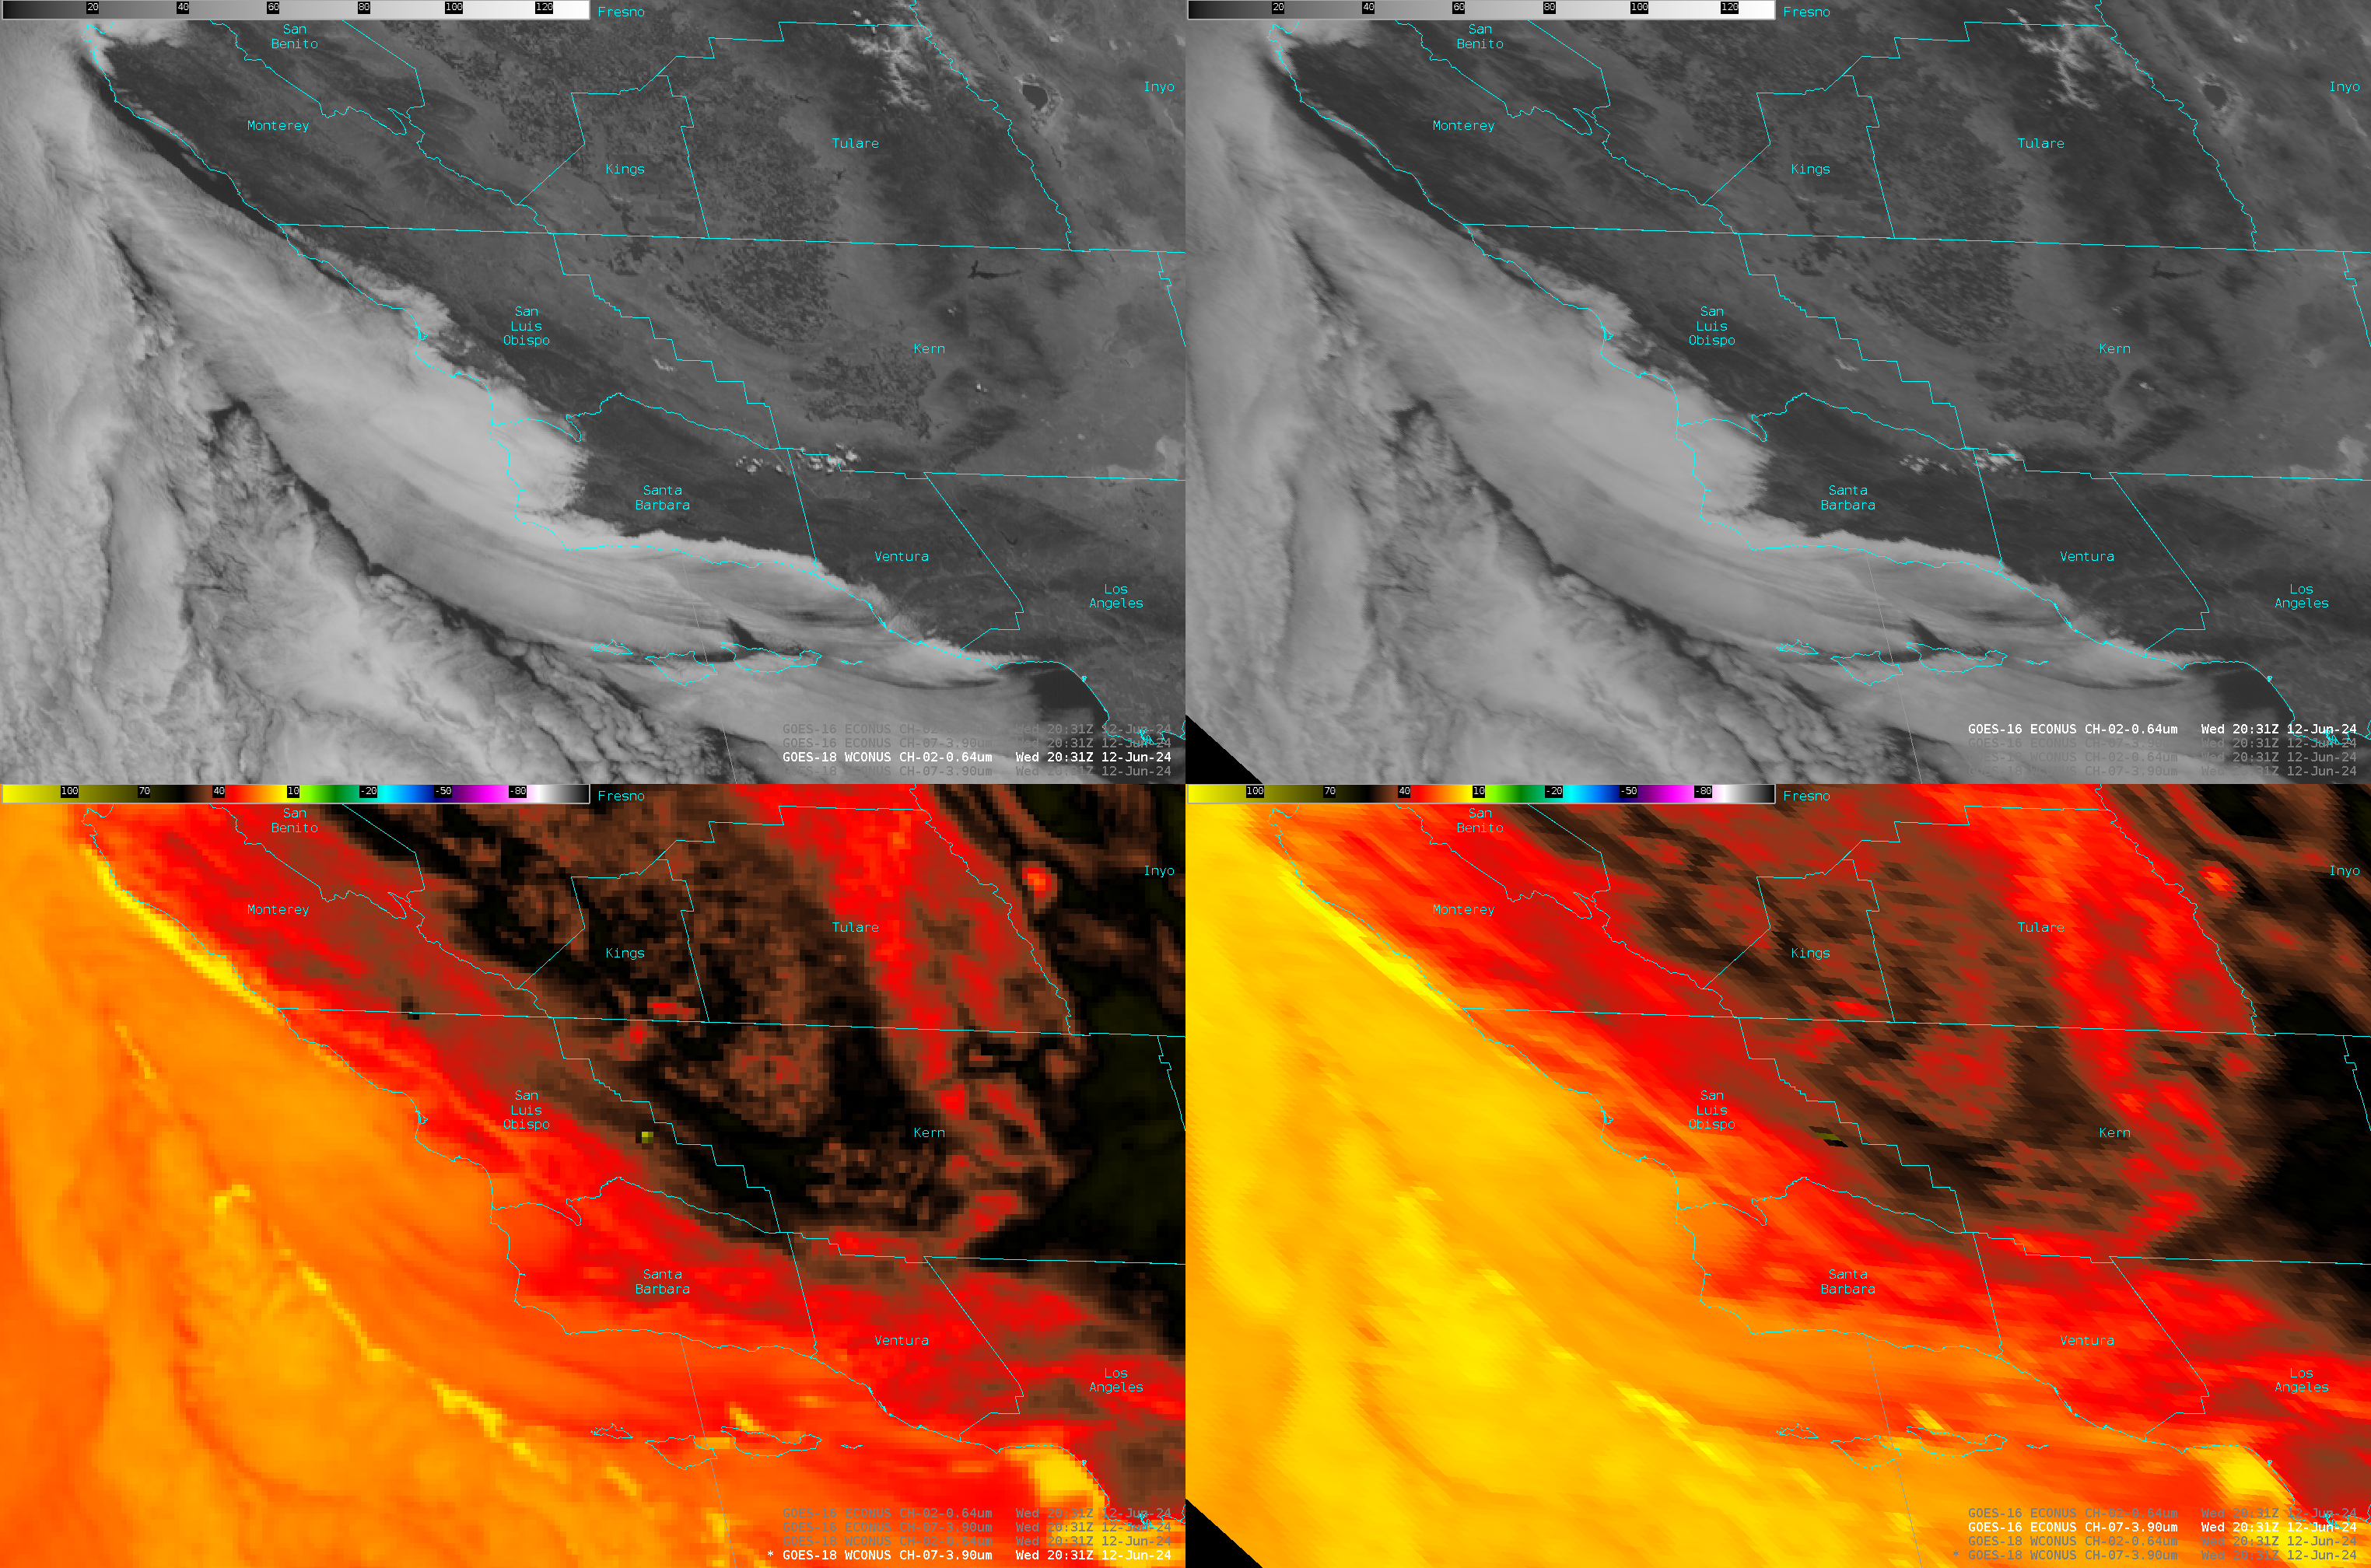
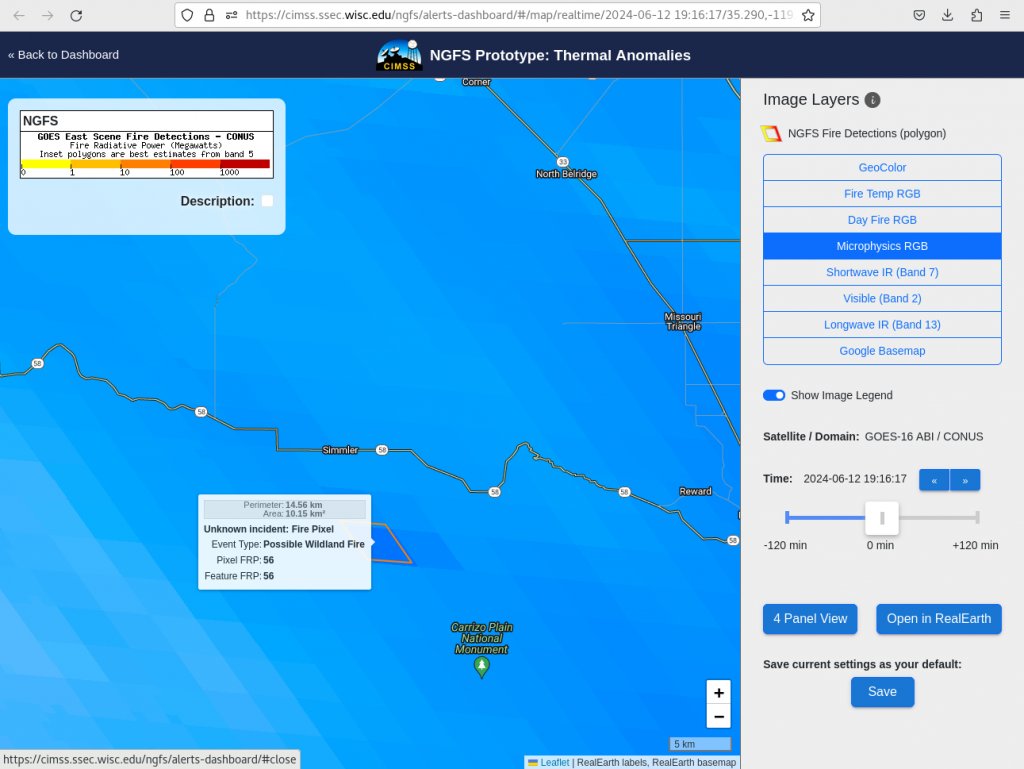
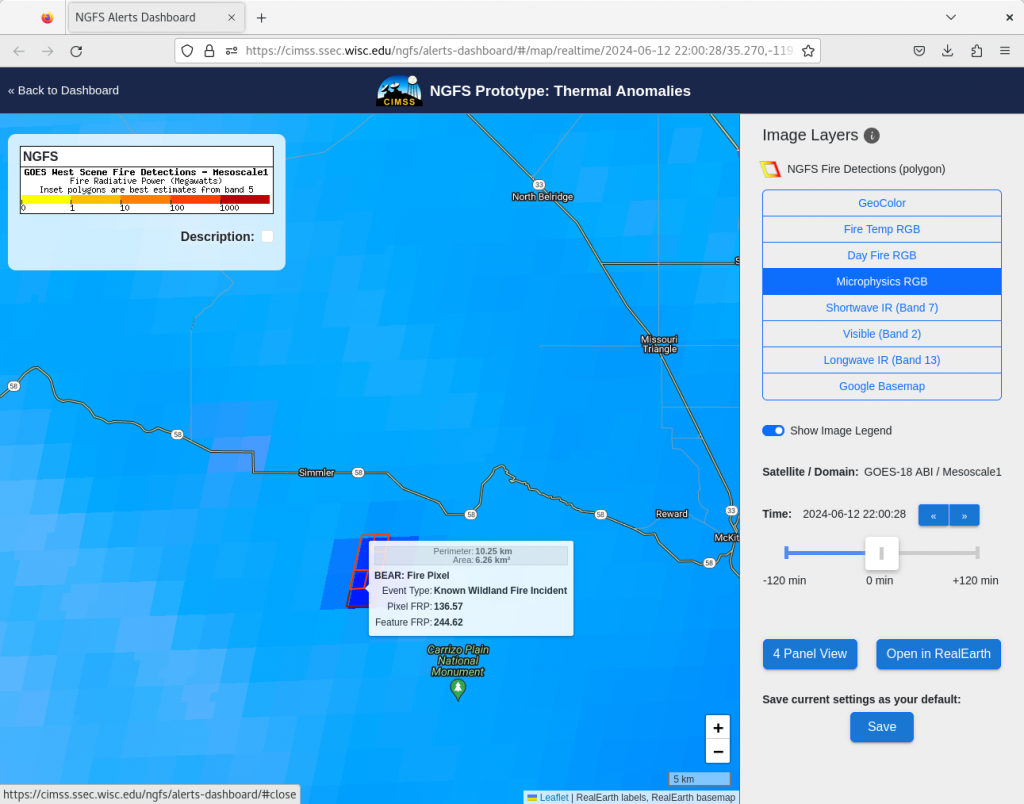
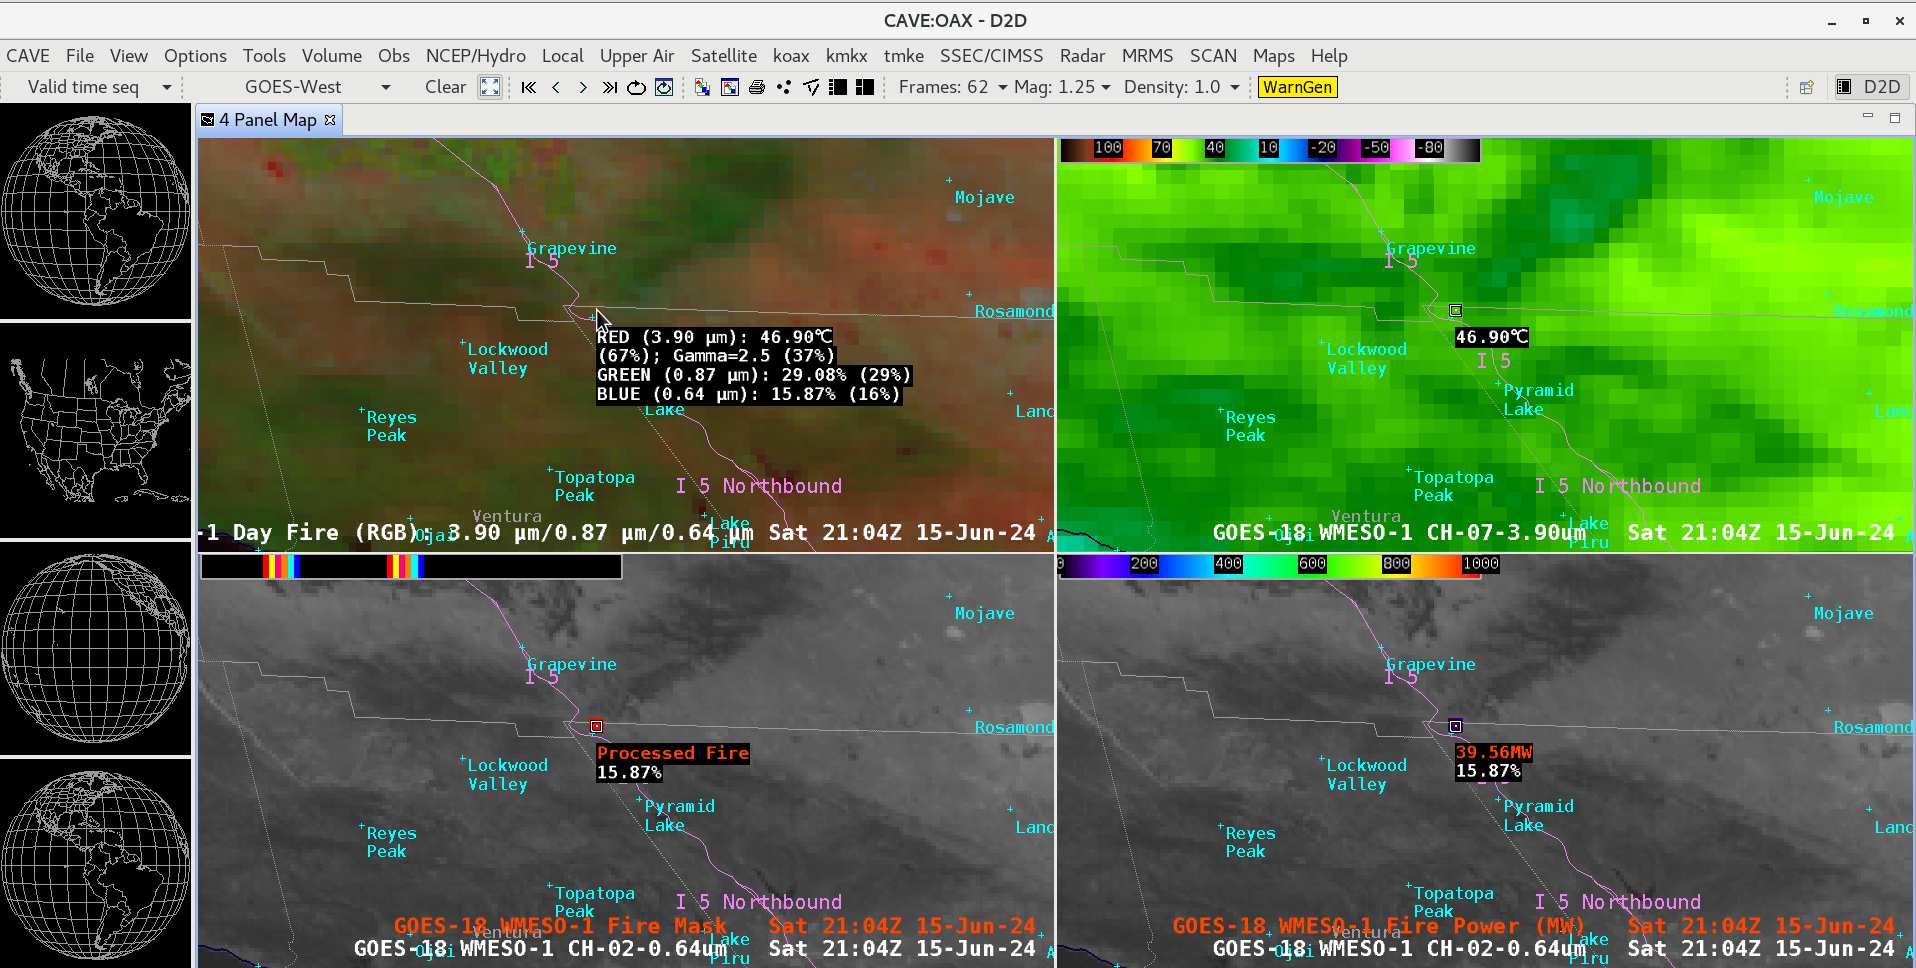
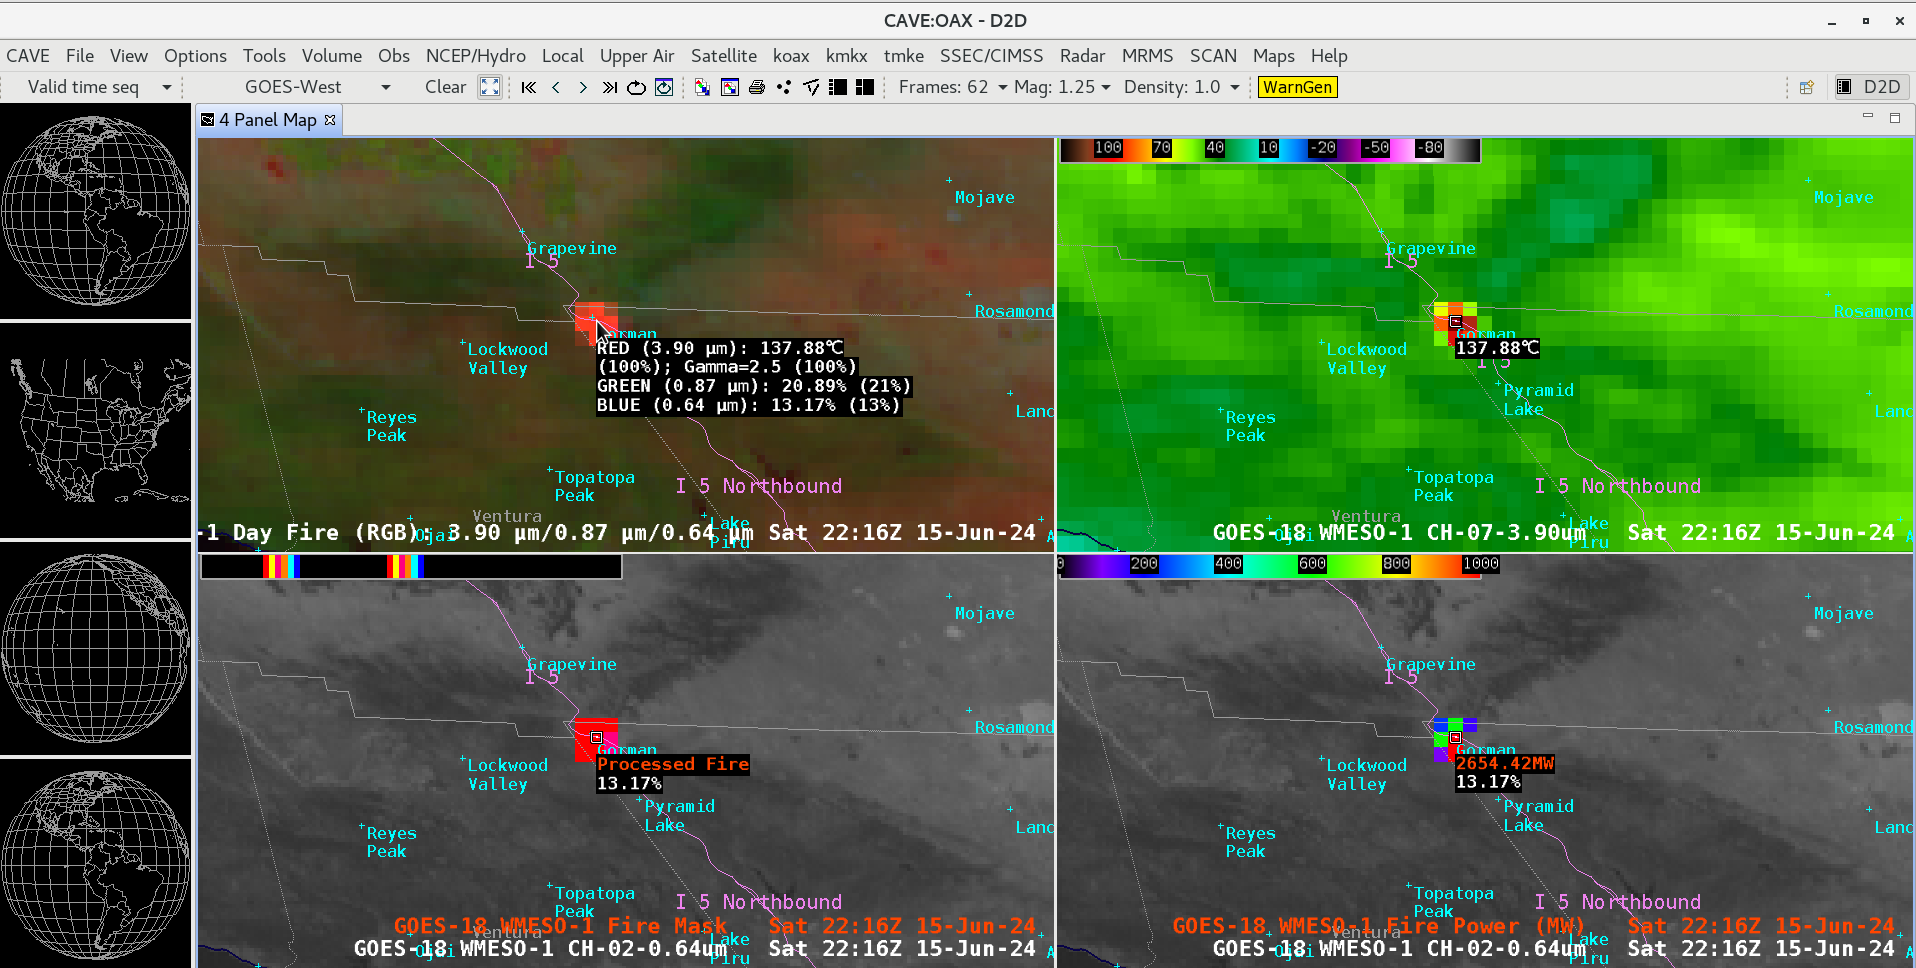
1-minute Mesoscale Domain Sector GOES-18 (GOES-West) Day Fire RGB, Shortwave Infrared (3.9 µm), and “Red” Visible (0.64 µm) images with overlays of the Fire Power and Fire Mask derived product (2 components of the GOES Fire Detection and Characterization Algorithm FDCA) (above) displayed signatures of the Post Fire, which reportedly started around 2052 UTC on 15 June 2024 near Gorman, California (in far northwest... Read More
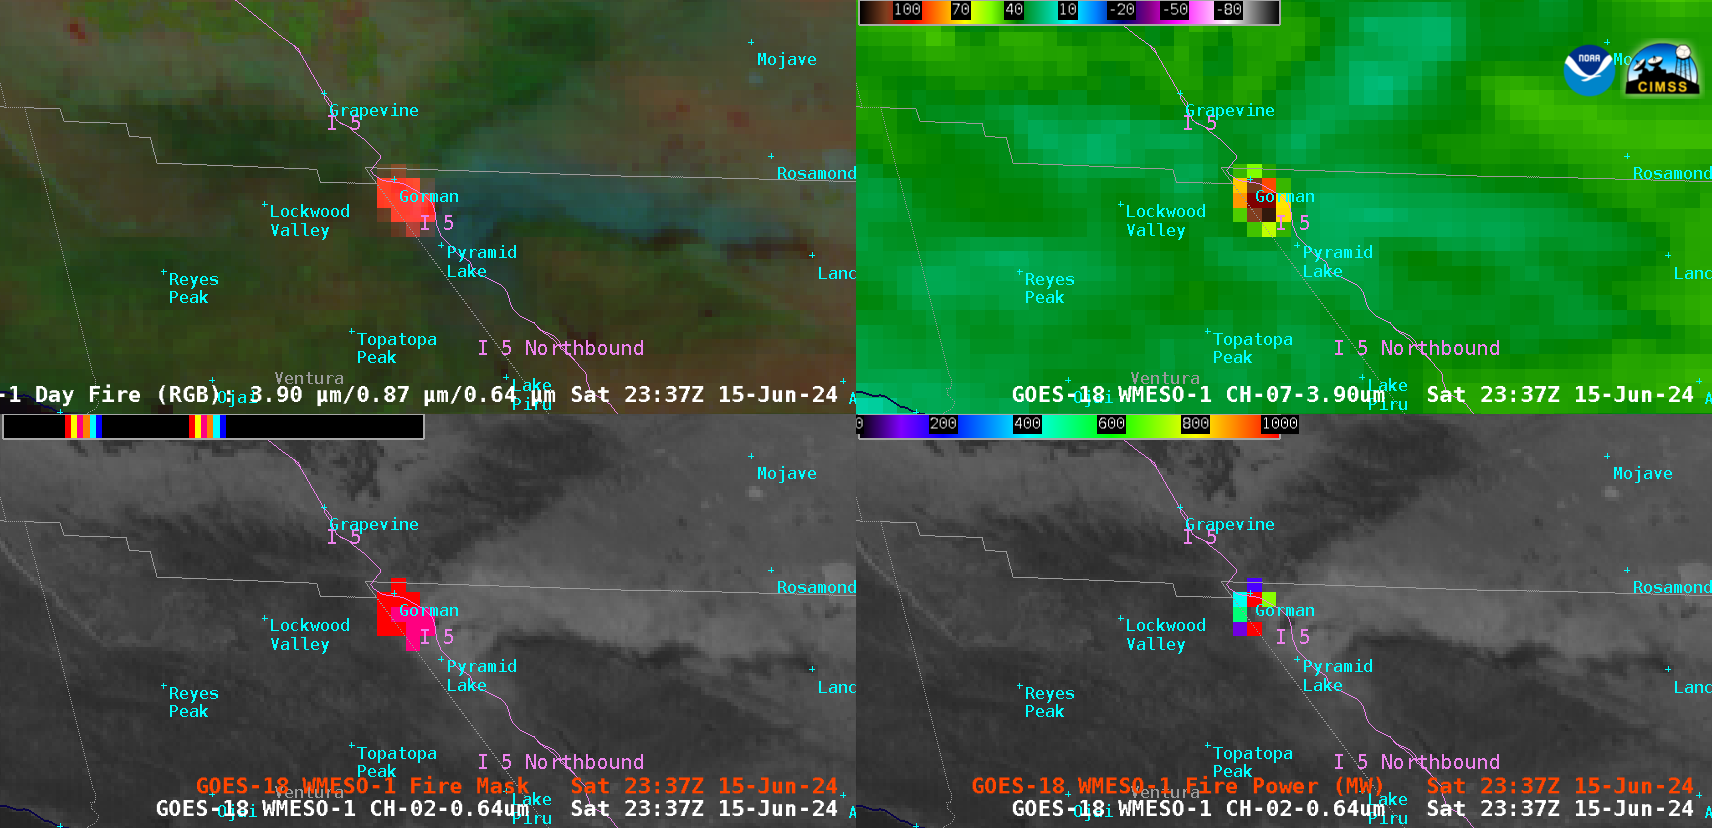
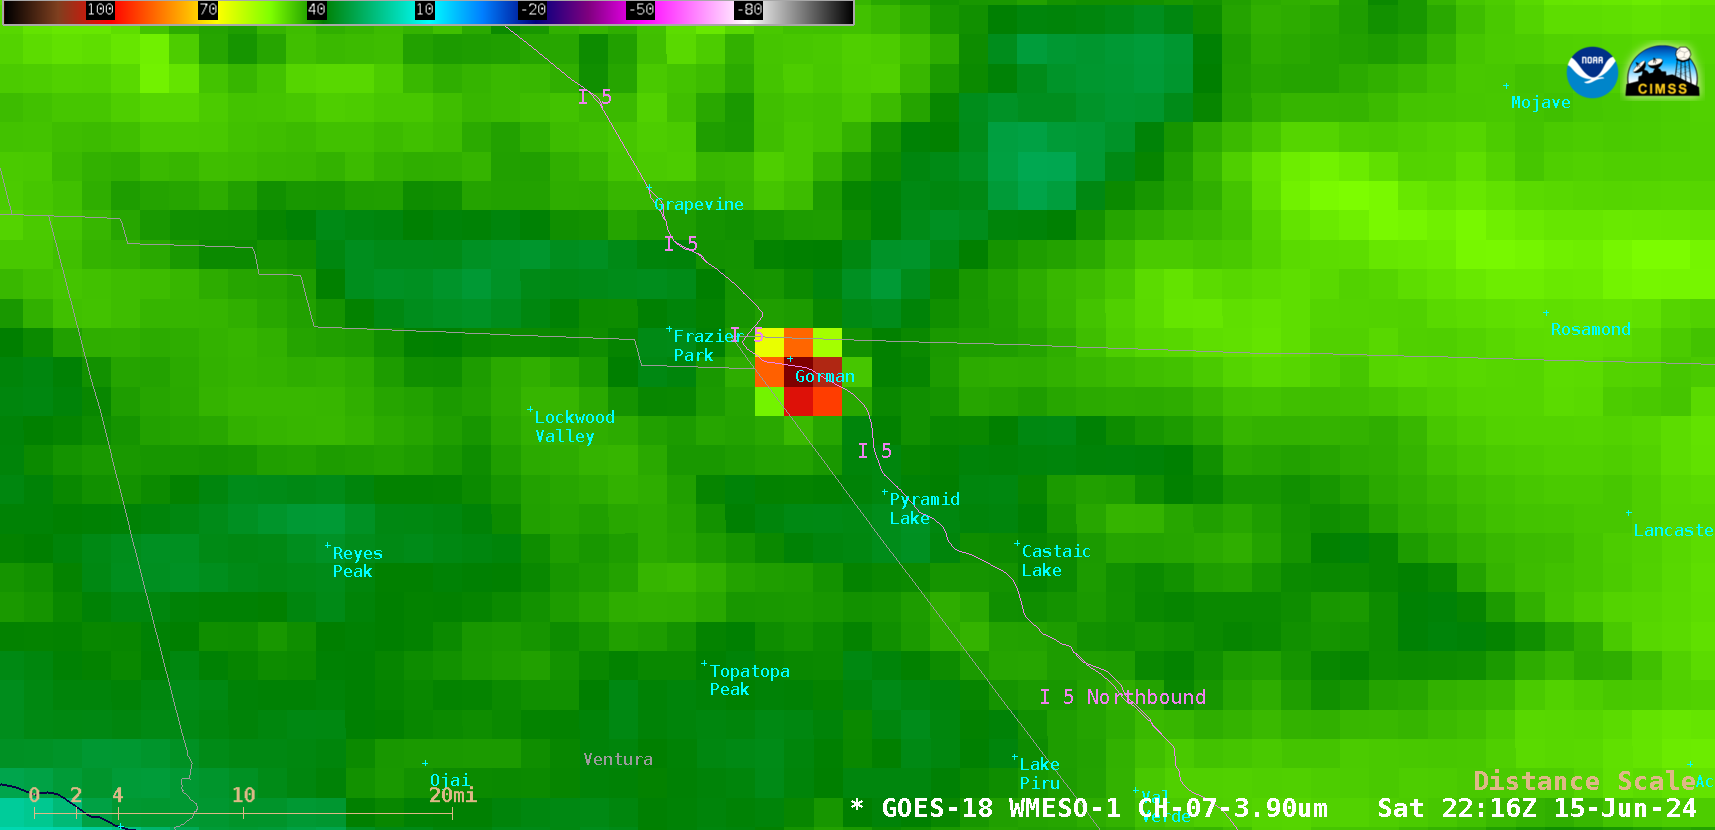
GOES-18 Day Fire RGB (top left), Shortwave Infrared (3.9 µm, top right), and “Red” Visible (0.64 µm) images with overlays of the Fire Mask (bottom left) and Fire Power derived products (bottom right), from 2057 UTC on 15 June to 0200 UTC on 16 June; Interstate 5 is plotted in violet [click to play animated GIF | MP4]
1-minute
Mesoscale Domain Sector GOES-18
(GOES-West) Day Fire RGB, Shortwave Infrared (
3.9 µm), and “Red” Visible (
0.64 µm) images with overlays of the Fire Power and Fire Mask derived product (2 components of the GOES Fire Detection and Characterization Algorithm
FDCA)
(above) displayed signatures of the
Post Fire, which reportedly started around 2052 UTC on
15 June 2024 near Gorman, California (in far northwest Los Angeles County). The initial GOES-18 fire detection occurred at
2104 UTC — and the 3.9 µm Shortwave Infrared brightness temperature first reached 137.88ºC (the saturation temperature of GOES-18
ABI Band 7 detectors) at
2216 UTC. The wildfire caused evacuations to be ordered for areas just west of Interstate 5.
1-minute GOES-18 True Color RGB images (source) from 2130 UTC on 15 June to 0149 UTC on 16 June (below) showed the transport of dense smoke from the wildfire. Note the occasional pyrocumulus jumps near the fire source region.
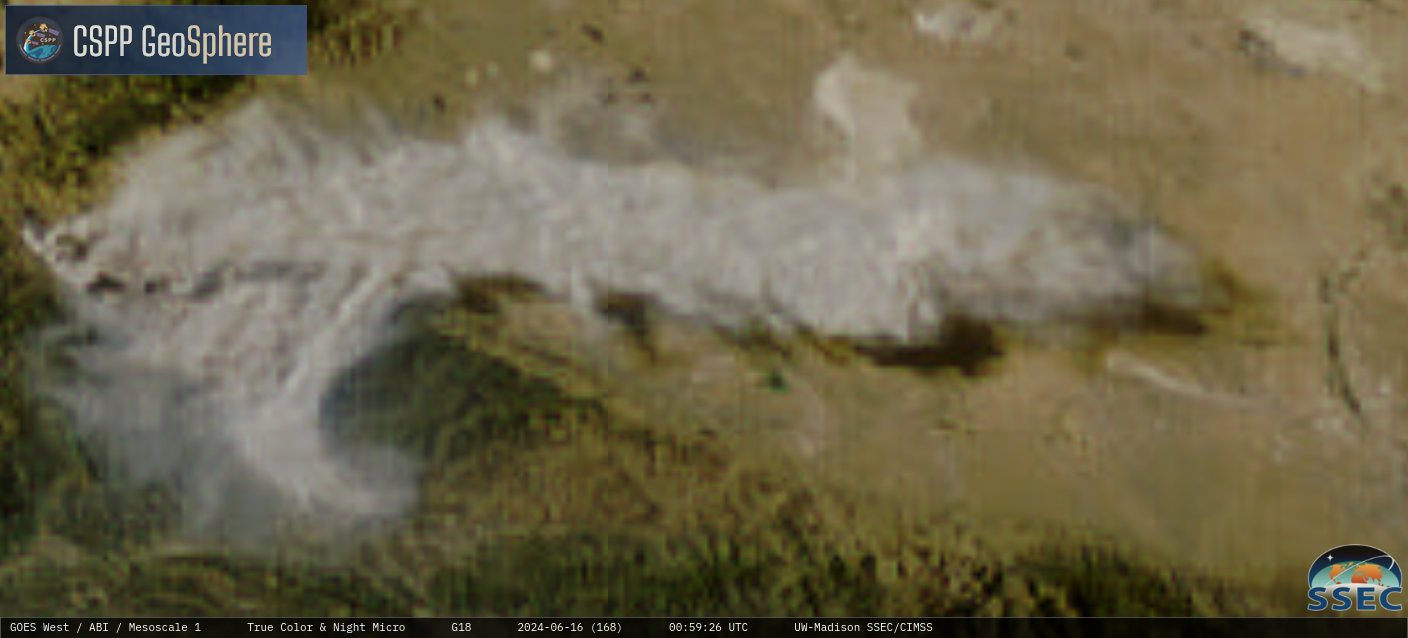
1-minute GOES-18 True Color RGB images, from 2130 UTC on 15 June to 0149 UTC on 16 June [click to play MP4 animation]
1-minute GOES-18 Day Fire RGB images
(below) included plots of METAR surface reporting sites. Although the smoke plume passed directly over
KSDB and
KWJF, the bulk of the smoke remained aloft (at altitudes between 2000-8000 ft, therefore casting a shadow onto the ground below) and did not significantly reduce the surface visibility at either site.
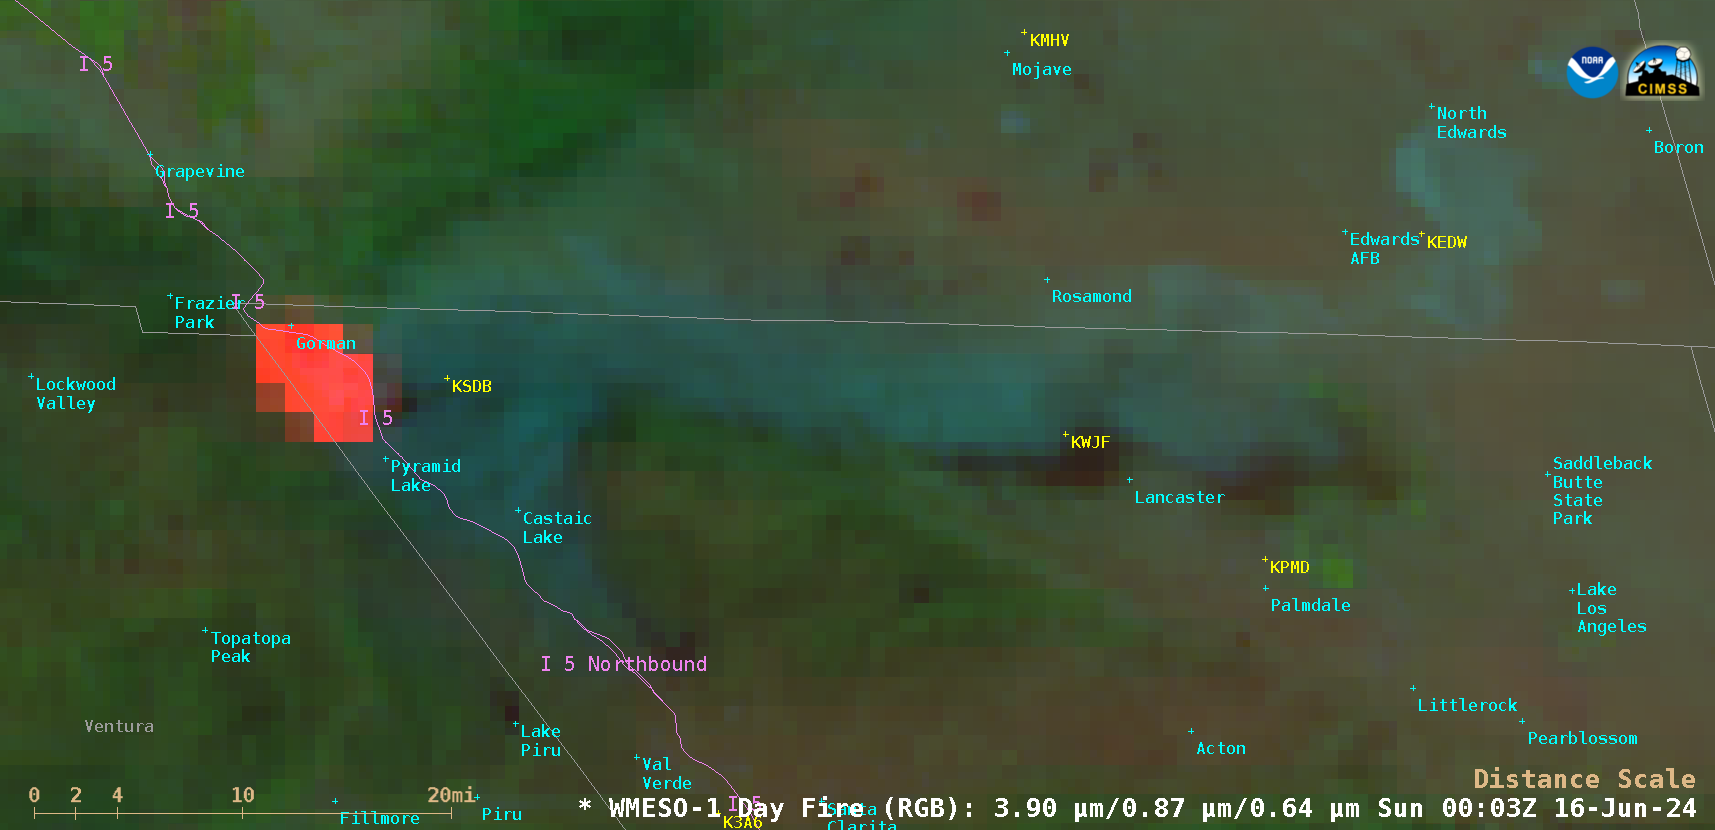
1-minute GOES-18 Day Fire RGB images with METAR sites plotted in yellow, from 2200 UTC on 15 June to 0200 UTC on 16 June [click to play animated GIF | MP4]
A NOAA-21 VIIRS Day/Night Band image valid at 0944 UTC (2:44 AM local time) on 16 June
(below) displayed the bright nighttime glow of the Post Fire (between Gorman and Pyramid Lake).
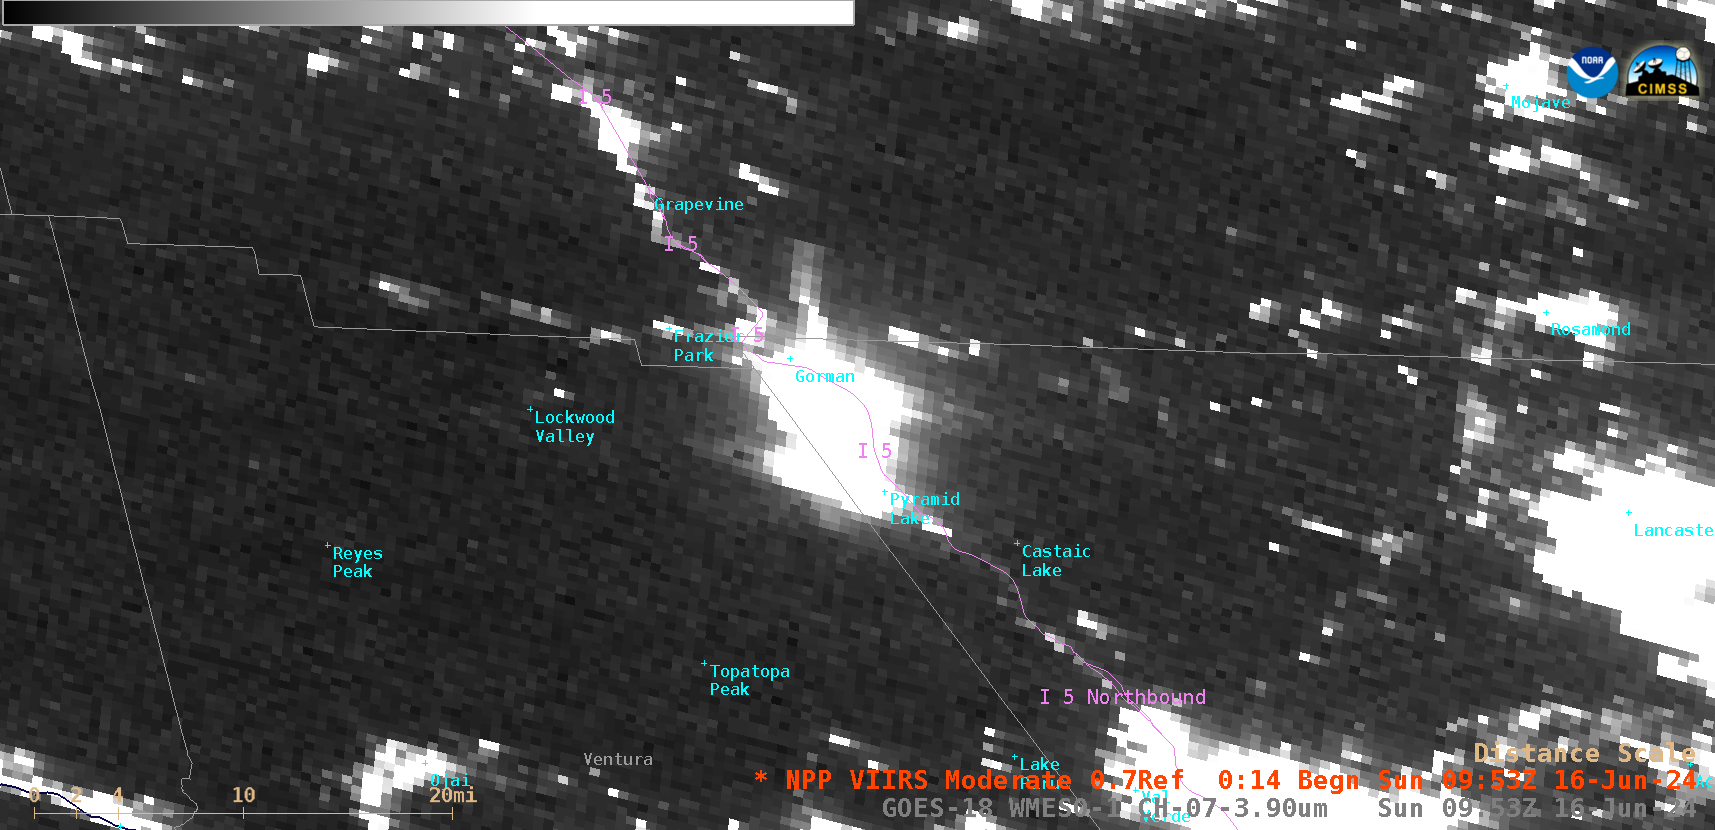
NOAA-21 VIIRS Day/Night Band (0.7 µm) image valid at 0944 UTC on 16 June [click to enlarge]
A 27-hour animation of 1-minute GOES-18 Shortwave Infrared (3.9 µm) images
(below) showed the diurnal behavior of the Post Fire thermal signature as it continued to burn south-southeastward along the Interstate 5 corridor.
1-minute GOES-18 Shortwave Infrared (3.9 µm) images, from 2100 UTC on 15 June to 2359 UTC on 16 June [click to play animated GIF | MP4]
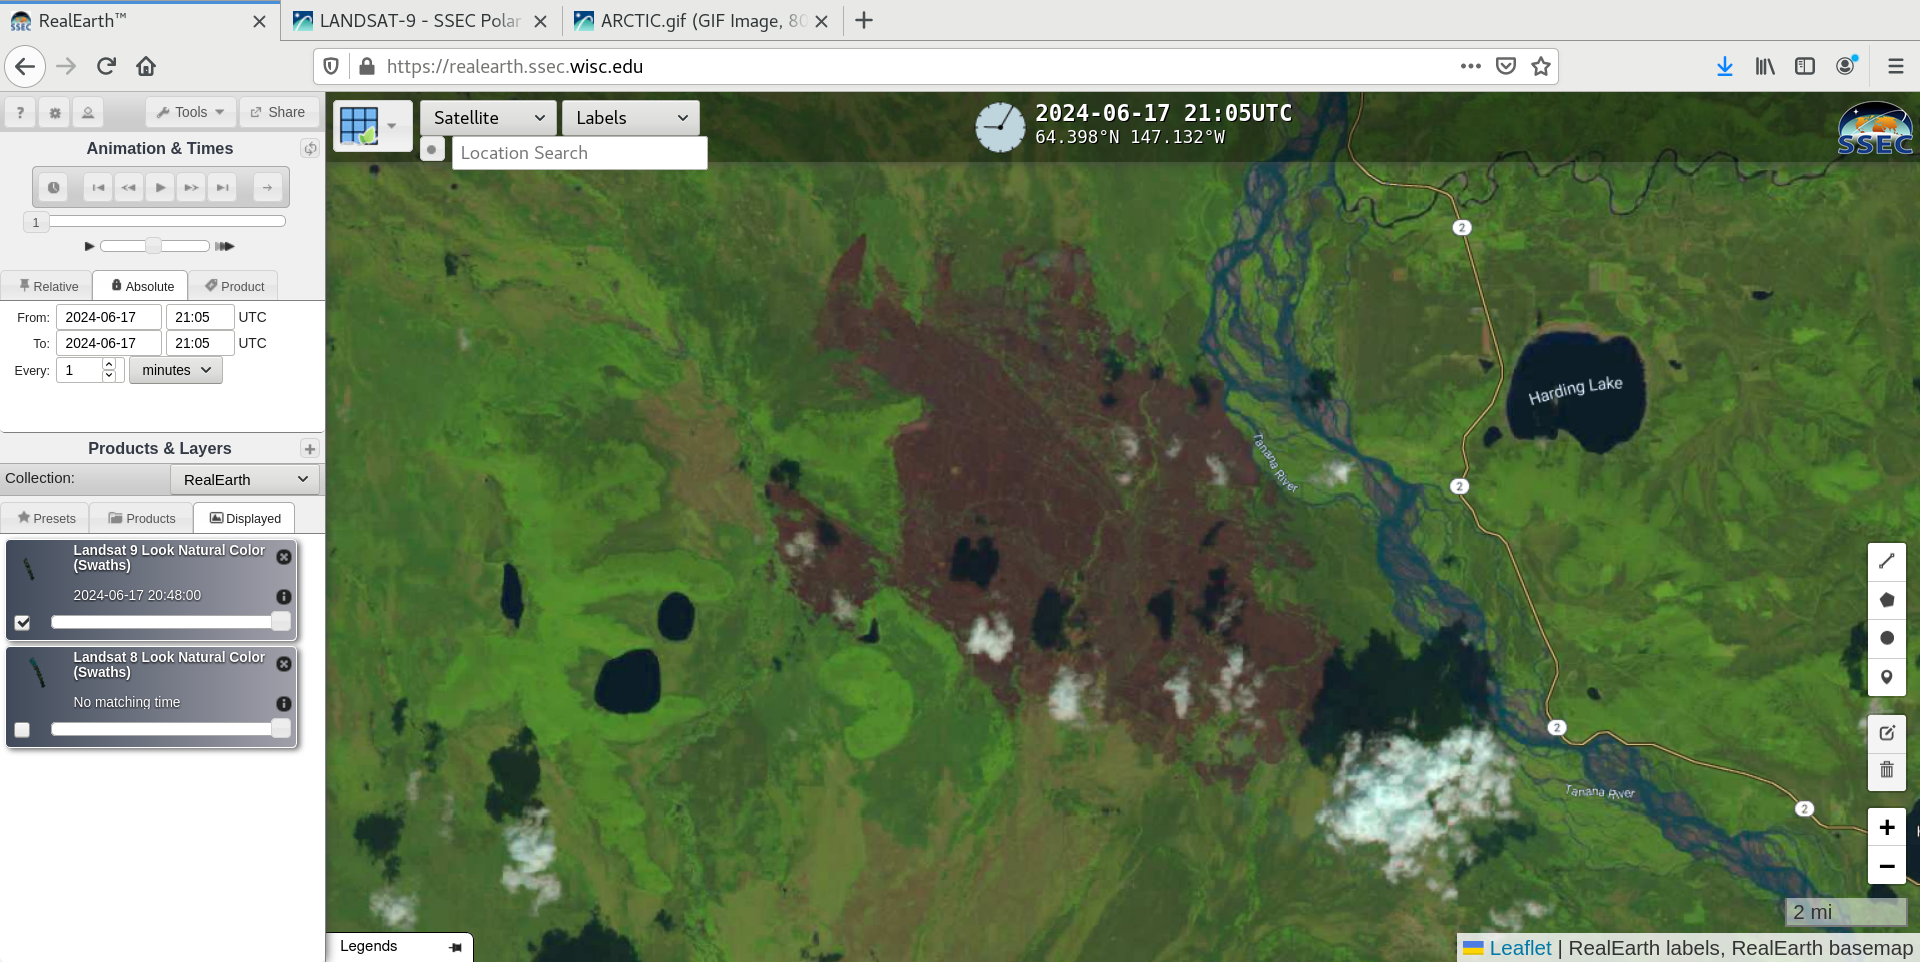
In a toggle between NOAA-20 VIIRS True Color and False Color RGB images (
source) at 2014 UTC on 16 June
(below), the Post Fire burn scar appeared as shades of gray to reddish-orange — while an active fire front along the southern edge (from which a smoke plume was emanating) exhibited brighter shades of pink.
NOAA-20 VIIRS True Color and False Color RGB images at 2014 UTC on 16 June [click to enlarge]
View only this post
Read Less


