
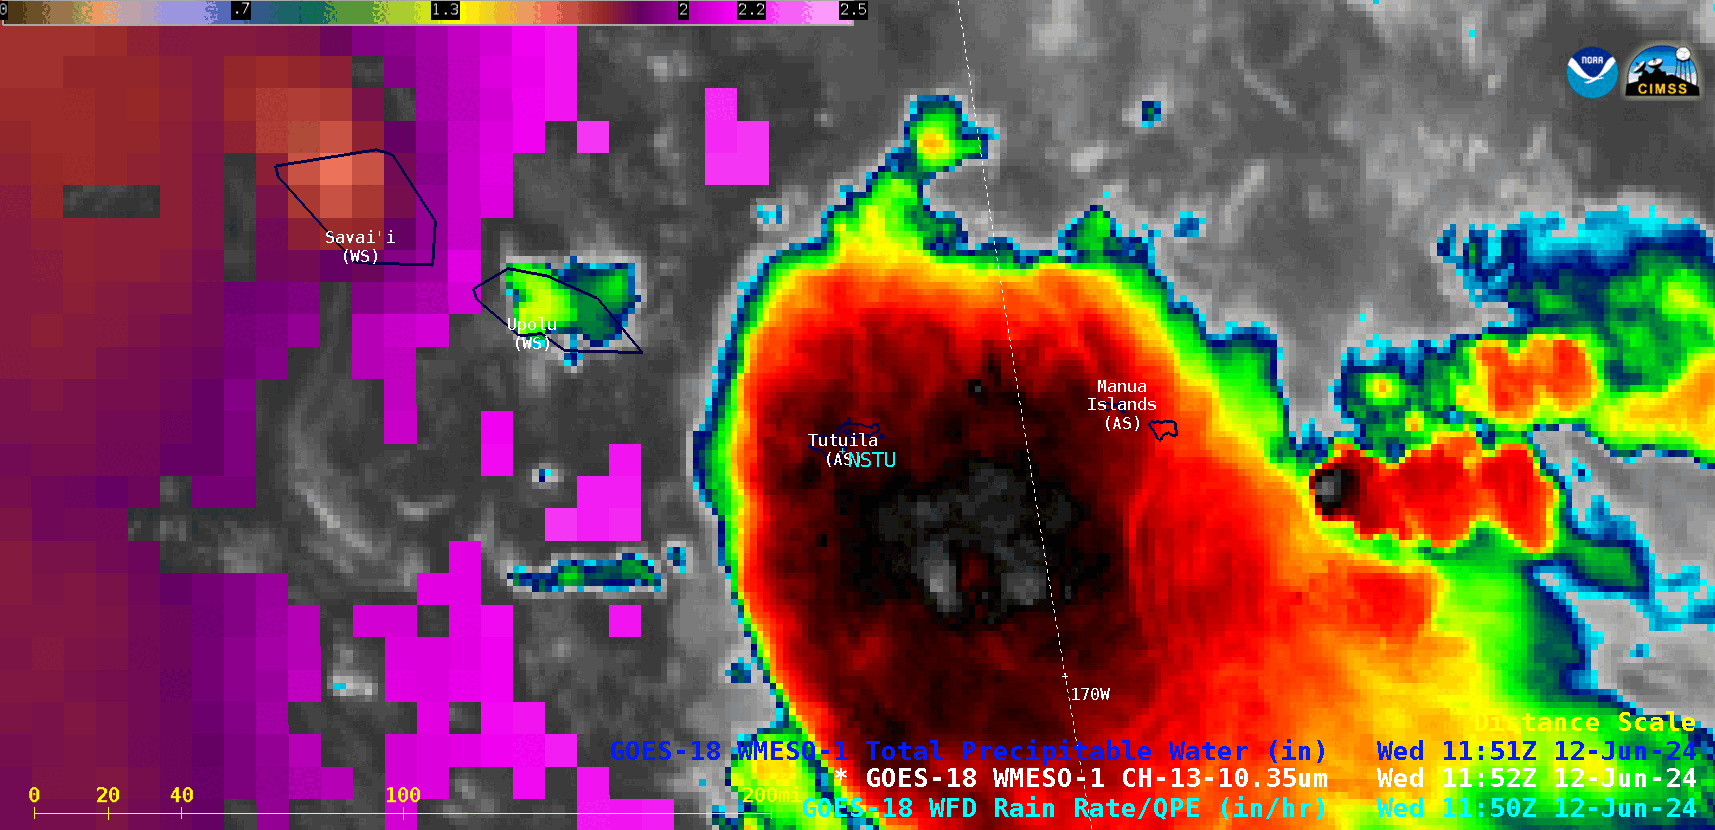
1-minute Mesoscale Domain Sector GOES-18 (GOES-West) “Clean” Infrared Window (10.3 µm) images (above) displayed areas of convection that moved across the islands of American Samoa on 12 June 2024 (1-minute imagery was requested by NWS Pago Pago to monitor the approach of thunderstorms capable of producing heavy rainfall and potential flooding — and since they lack radar coverage, 1-minute satellite... Read More
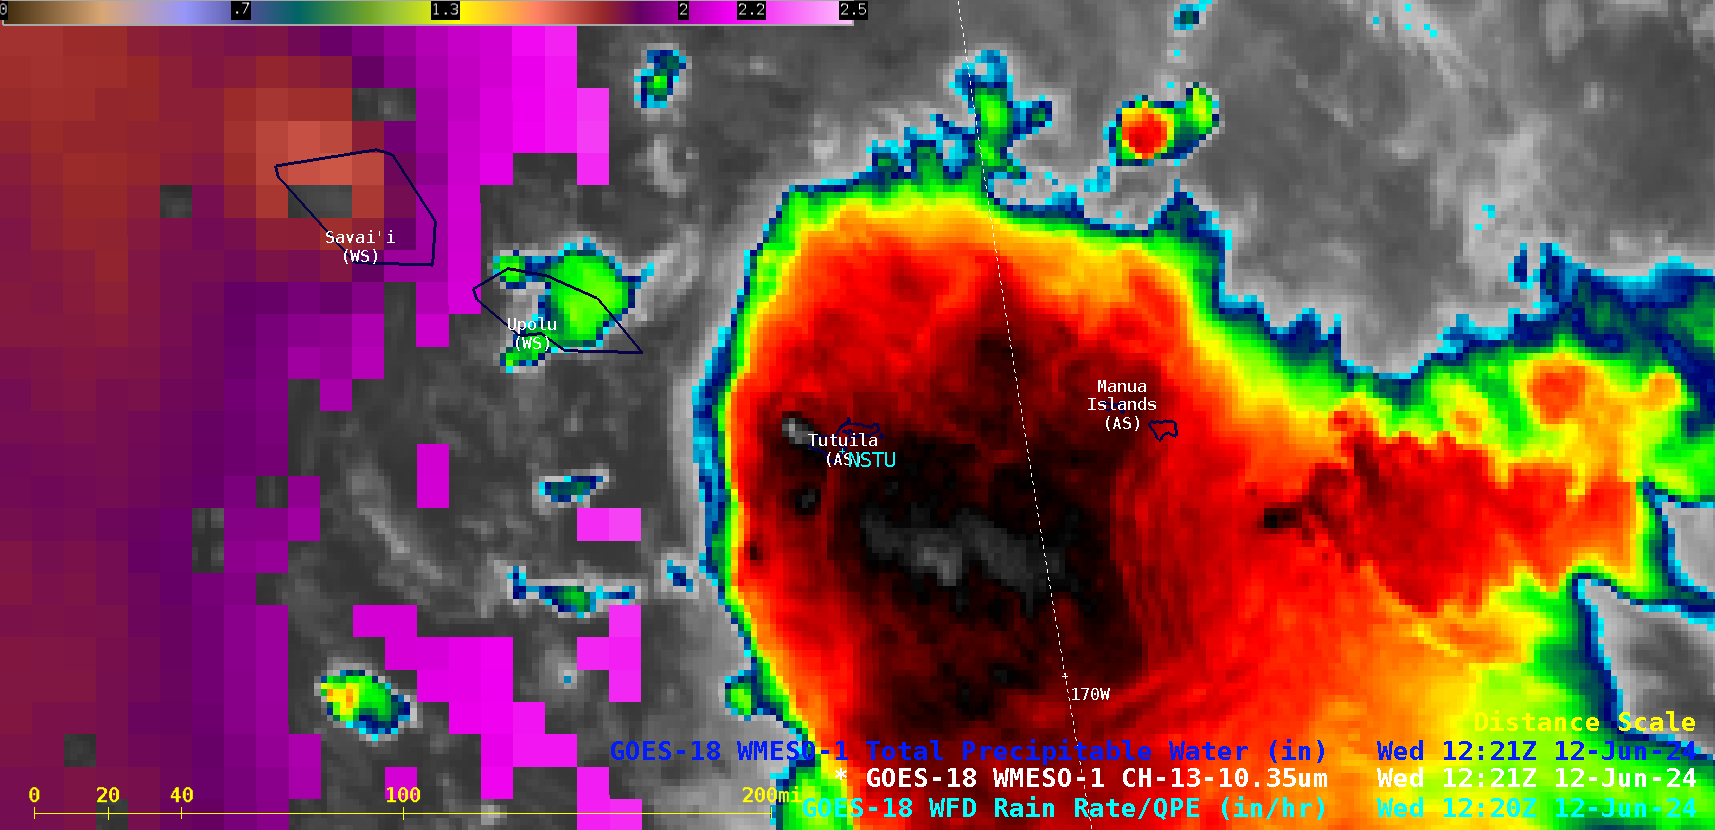
1-minute GOES-18 “Clean” Infrared Window (10.3 µm) images combined with the 1-minute Total Precipitable Water derived product (in cloud-free regions), from 0900-1400 UTC on 12 June; NSTU denotes the location of Pago Pago, American Samoa [click to play animated GIF | MP4]
1-minute
Mesoscale Domain Sector GOES-18
(GOES-West) “Clean” Infrared Window (
10.3 µm) images
(above) displayed areas of convection that moved across the islands of American Samoa on 12 June 2024 (1-minute imagery was requested by
NWS Pago Pago to monitor the approach of thunderstorms capable of producing heavy rainfall and potential flooding — and since they lack radar coverage, 1-minute satellite imagery can be very valuable in that type of scenario). Pago Pago (NSTU) did receive heavy rainfall (2.84 inches) from thunderstorms during the 1045-1155 UTC period (
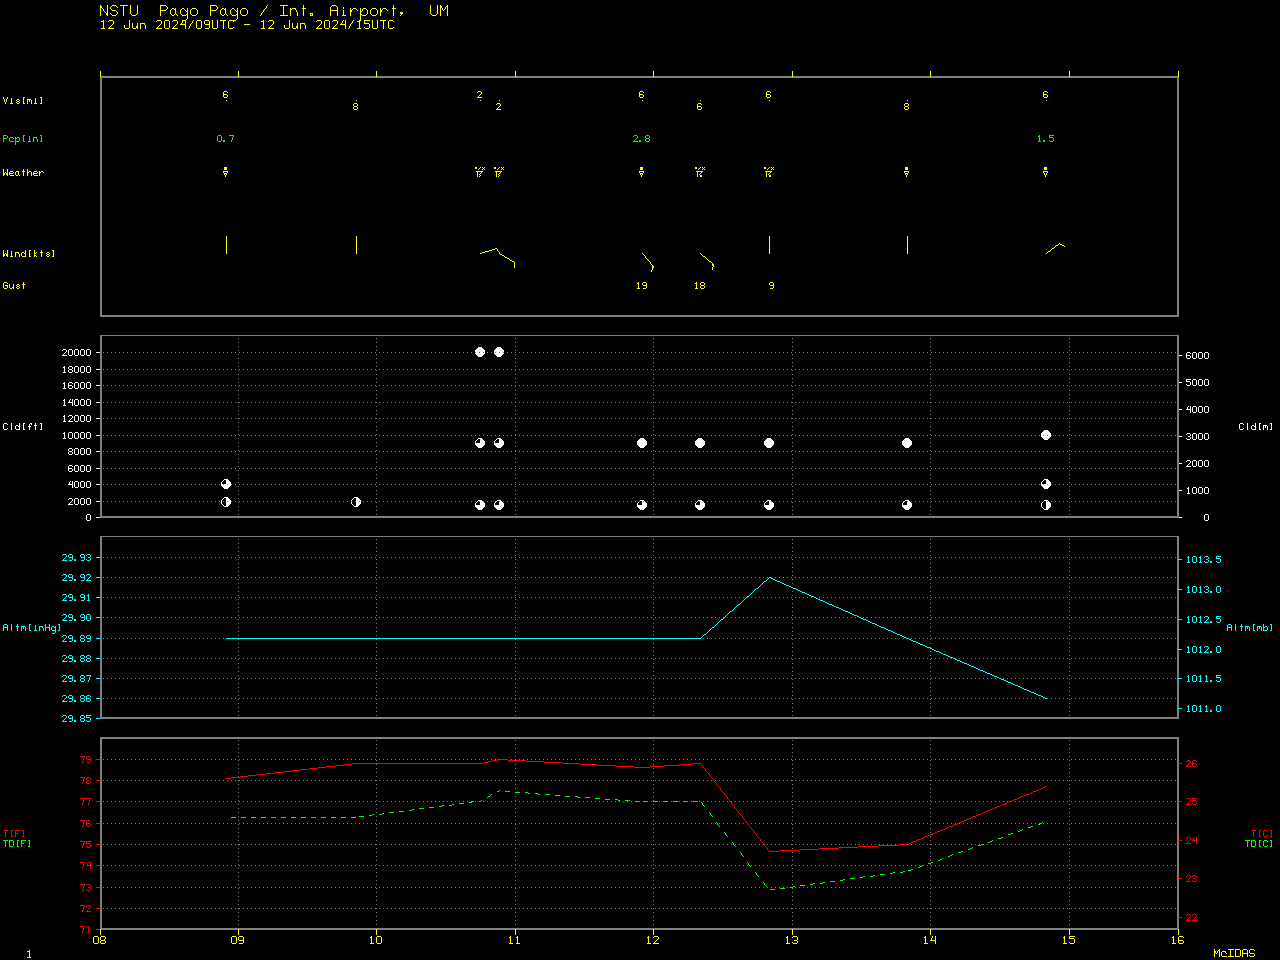
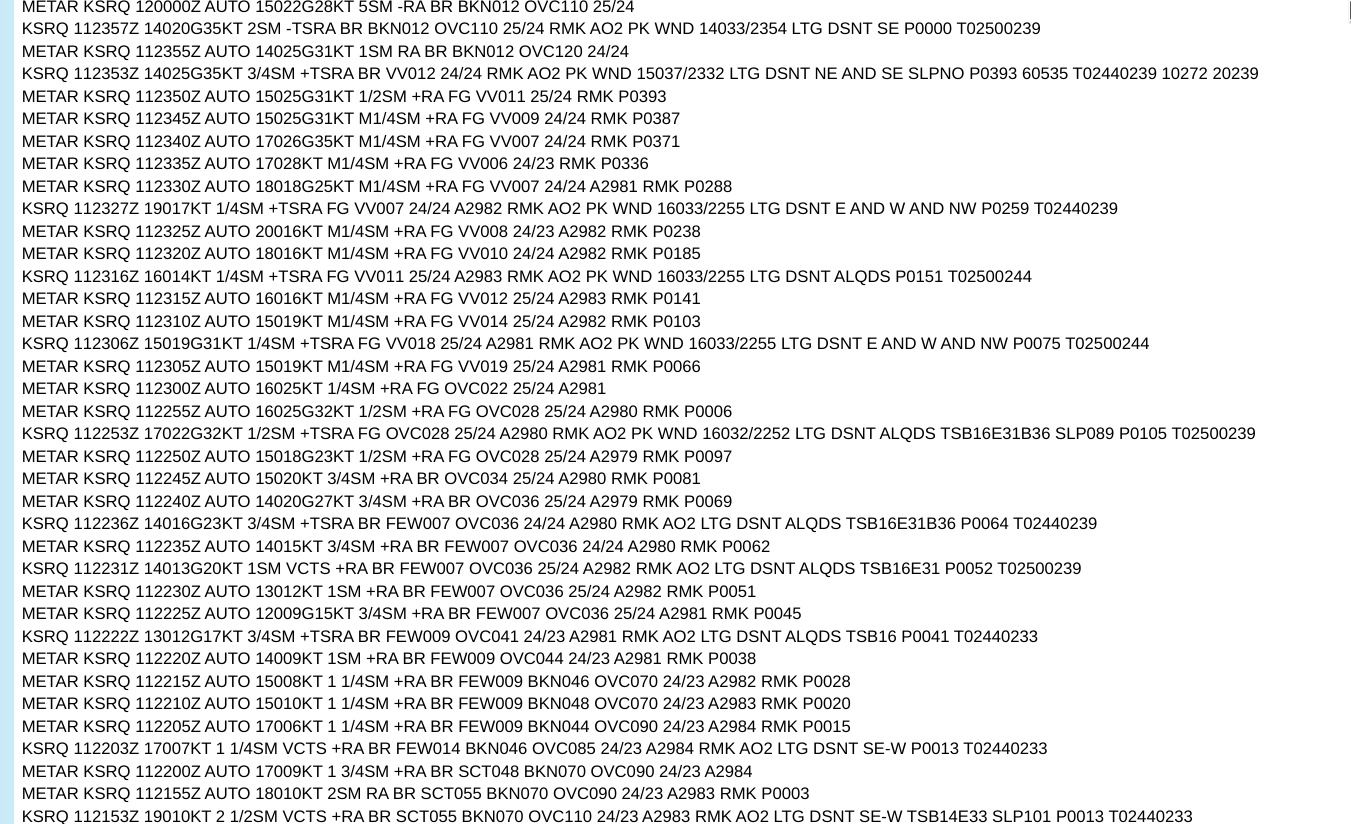
METARs |
plot of surface report data); in-cloud lightning was also noted with those particular thunderstorms.
Flood Advisories for American Samoa were issued at 0912 UTC and 1200 UTC.
The 1-minute GOES-18 Total Precipitable Water (TPW) derived product (in cloud-free regions) showed a N-to-S oriented corridor of TPW values in the 2.0 to 2.2 inch range (lighter shades of violet) across the islands of Western Samoa — however, the presence of extensive cloudiness across the islands of American Samoa prevented the retrieval of TPW there. The TPW value derived from NSTU rawinsonde data at 0000 UTC on 12 June was 2.48 inches (below).
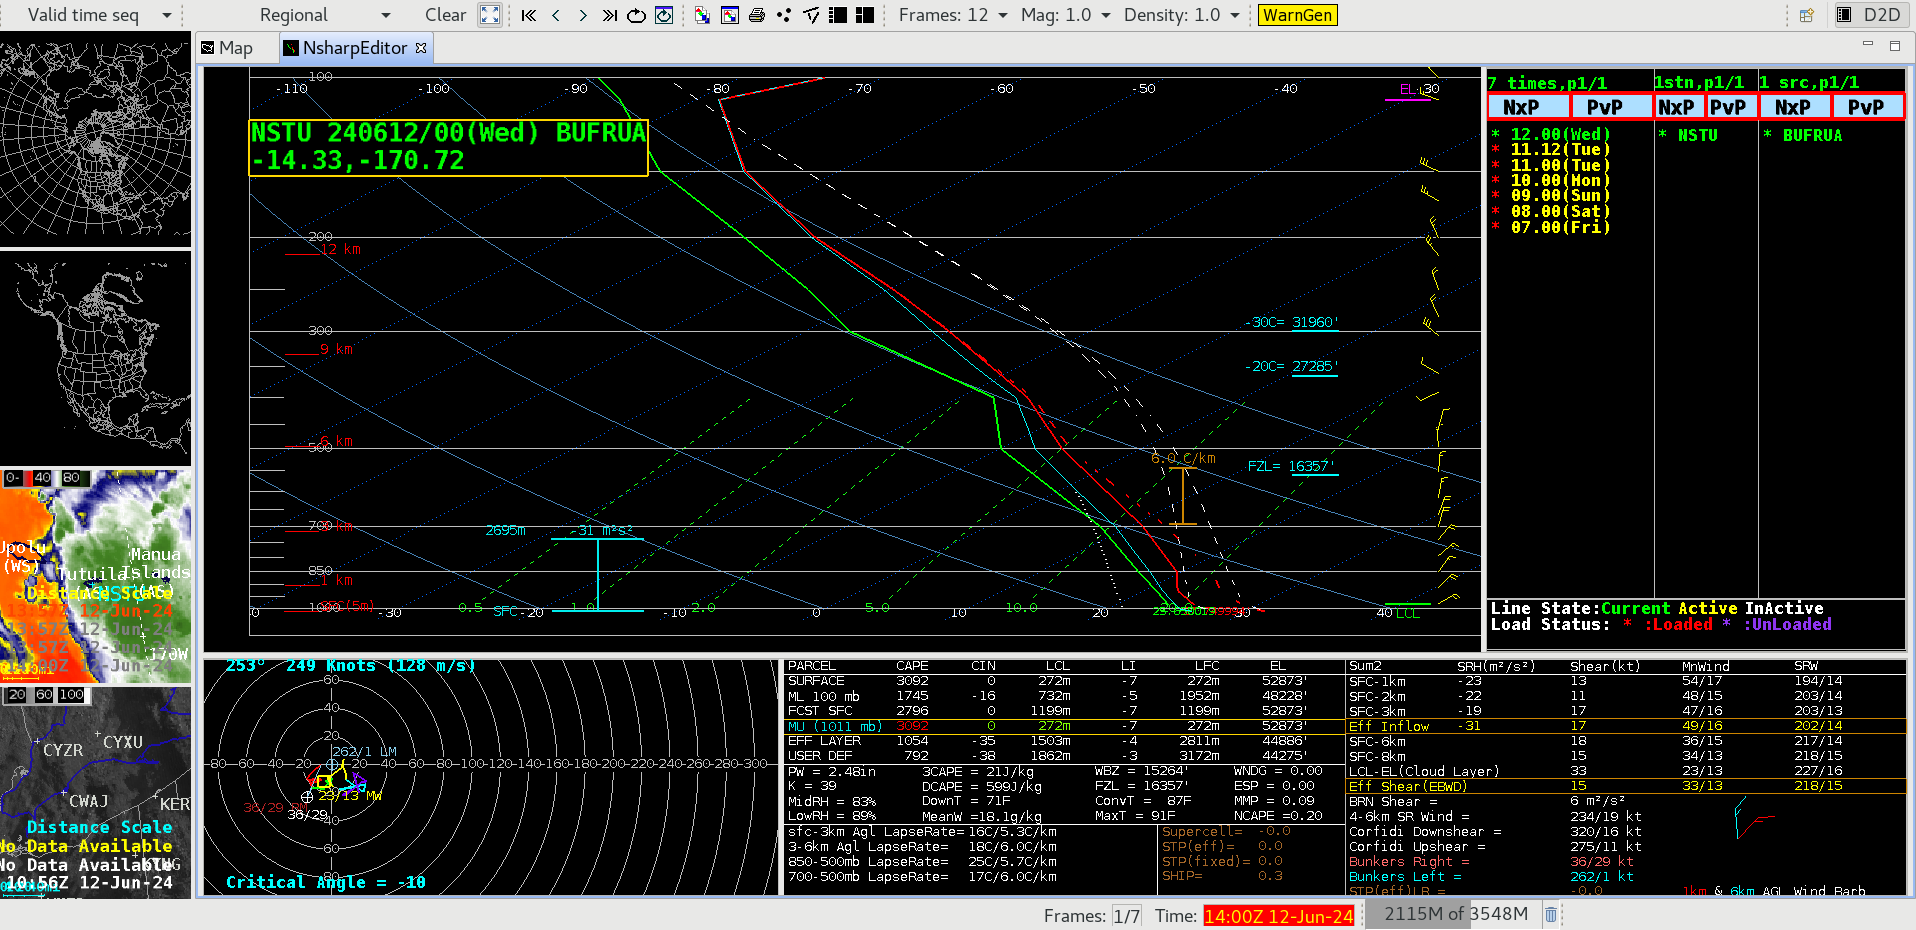
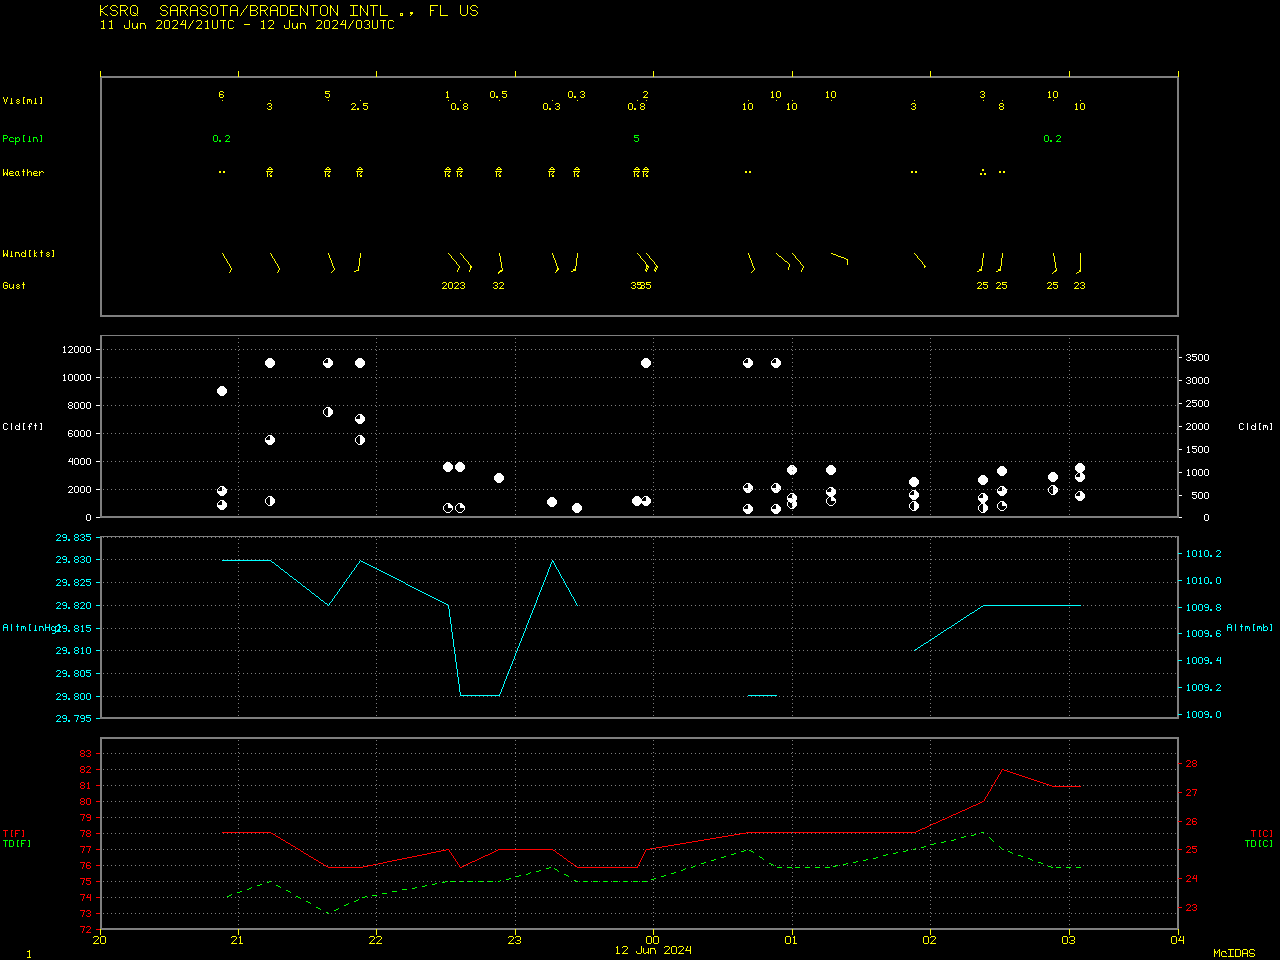
Plot of rawinsonde data from Pago Pago, American Samoa at 0000 UTC on 12 June [click to enlarge]
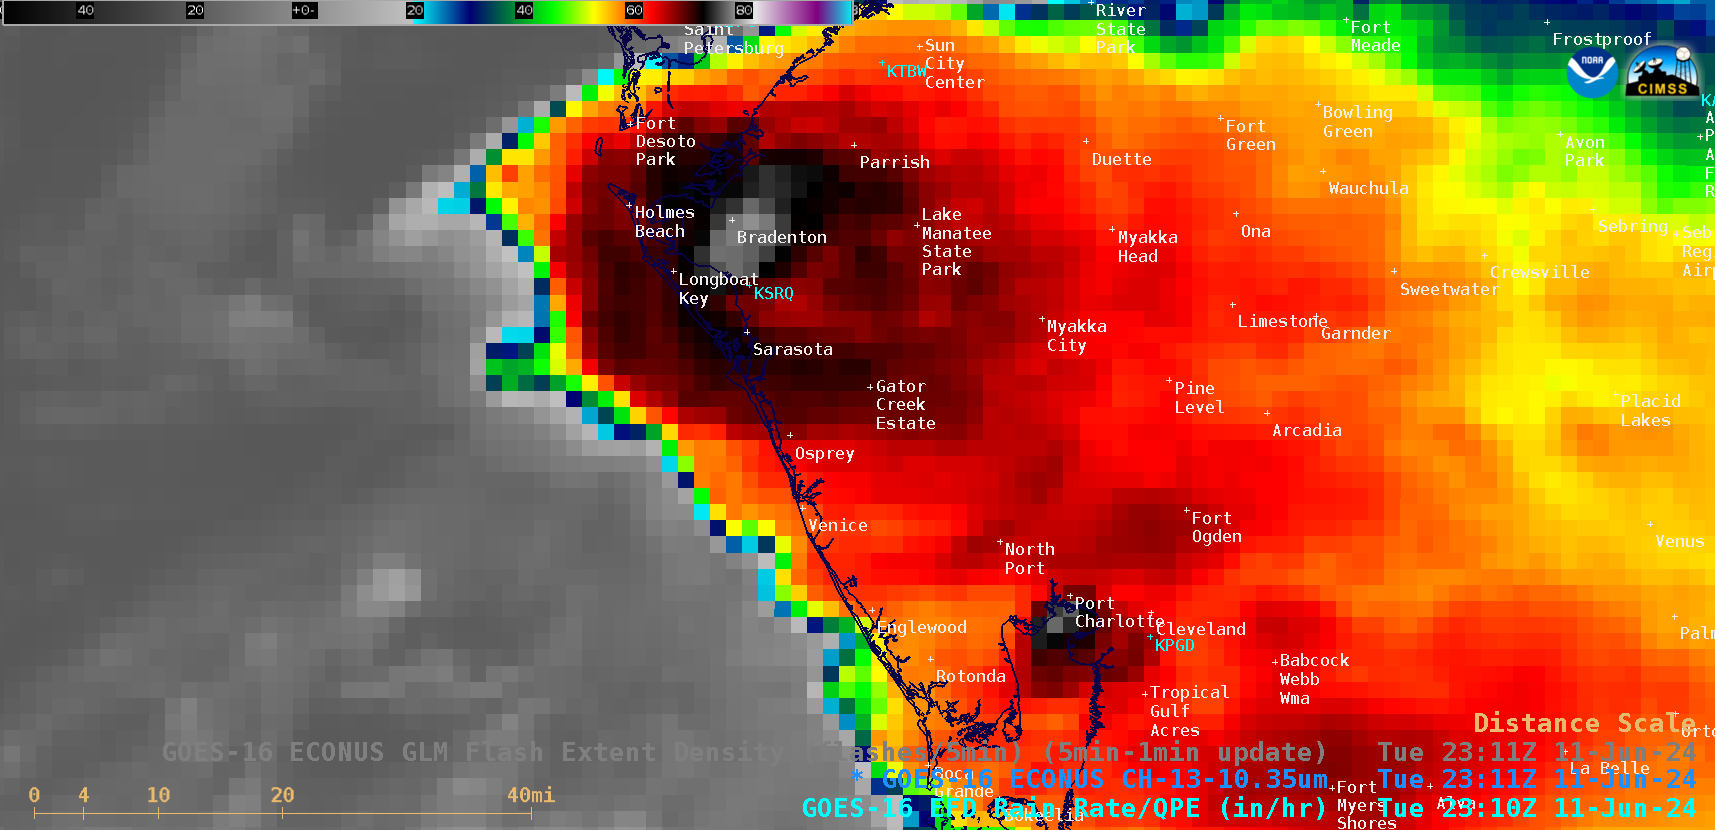
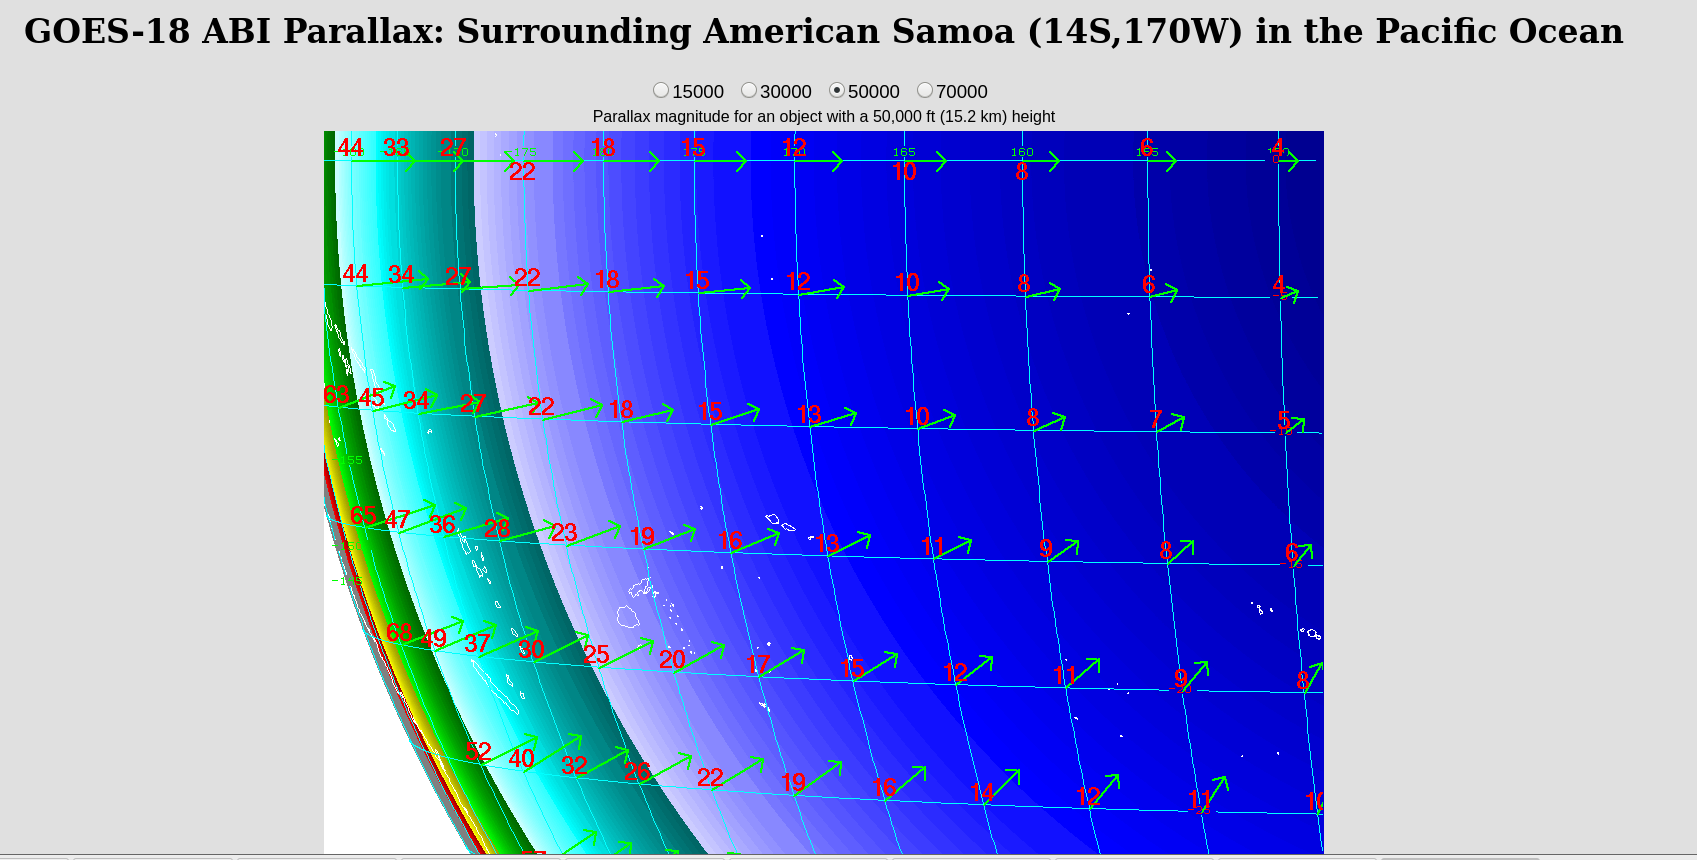
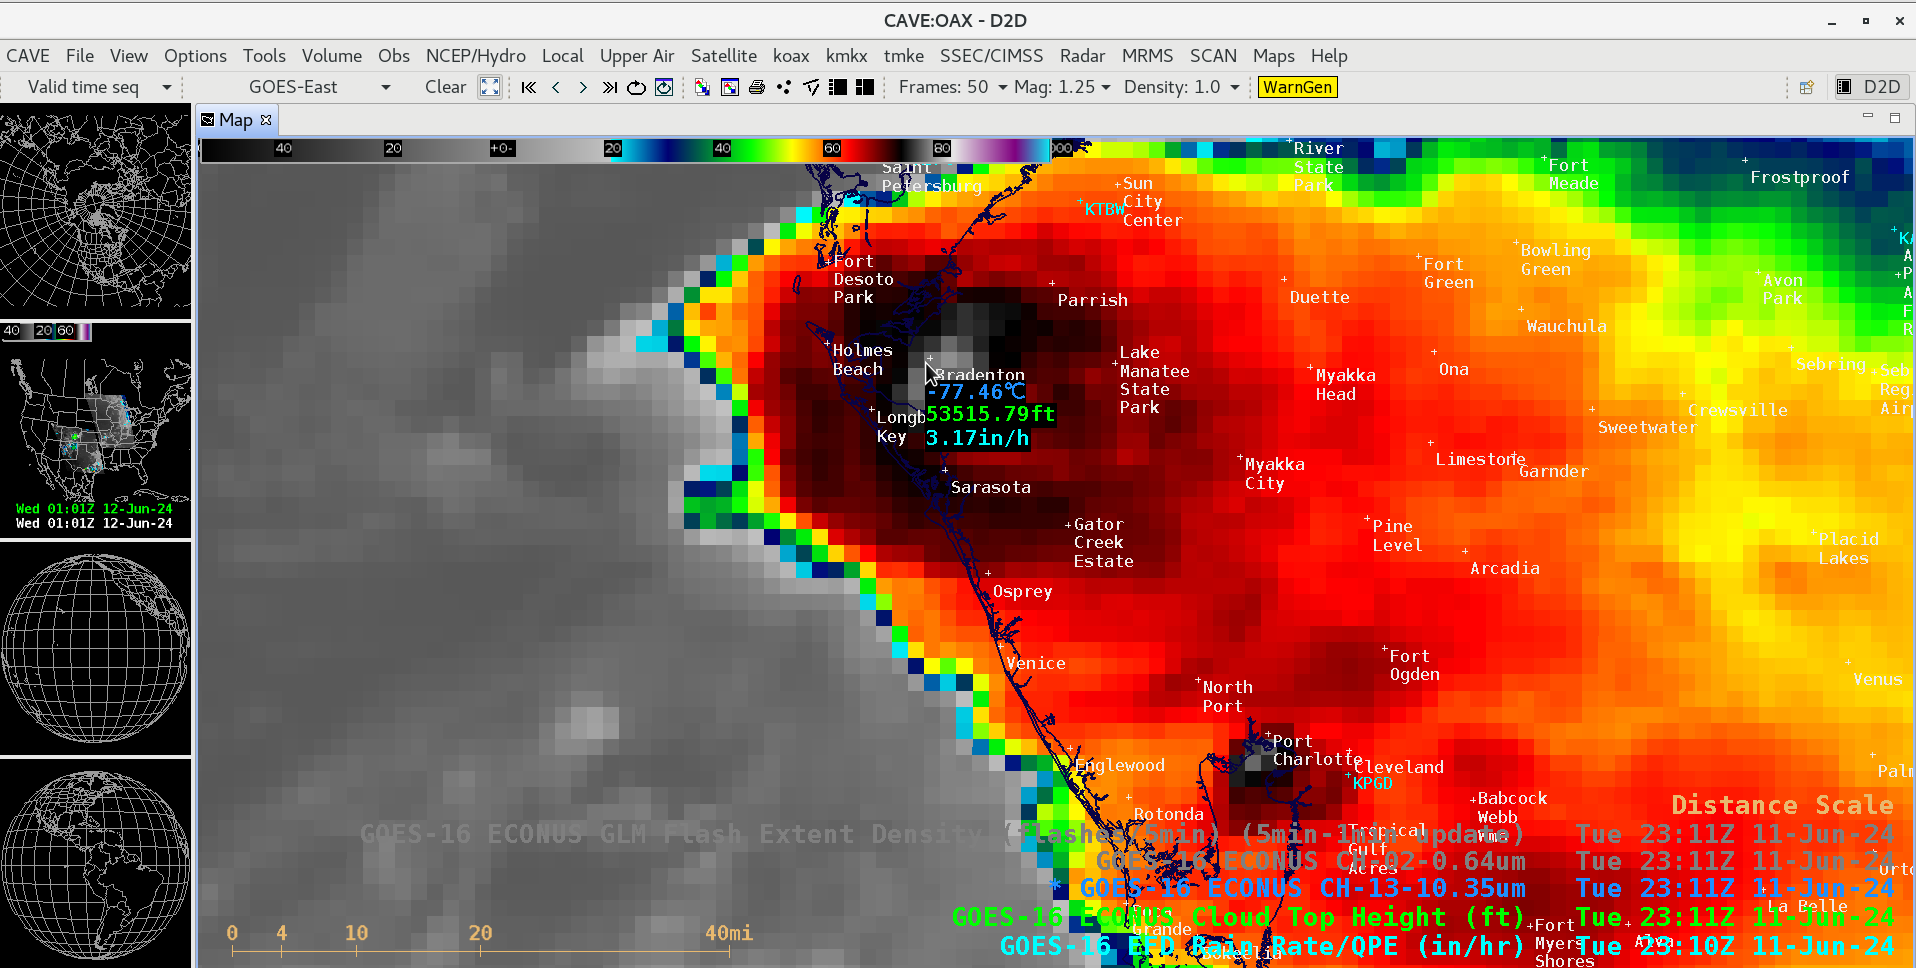
A GOES-18 Infrared image showing a cold (-80.35ºC) thunderstorm overshooting top just southwest of the American Samoa island of Tutuila at 1112 UTC on 12 June
(below) included a cursor sample of the associated GOES-18
Cloud Top Height (53191 ft) and
Rain Rate (3.05 in/hr) derived products at that location. That rain rate was consistent with the ~1-hour rainfall amount (2.84 in) that was observed at NSTU. Note that the cold overshooting top and high rain rate were displaced about 6-8 mi southwest of NSTU and the island of Tutuila — for a Cloud Top Height around 50 kft, this is consistent with a
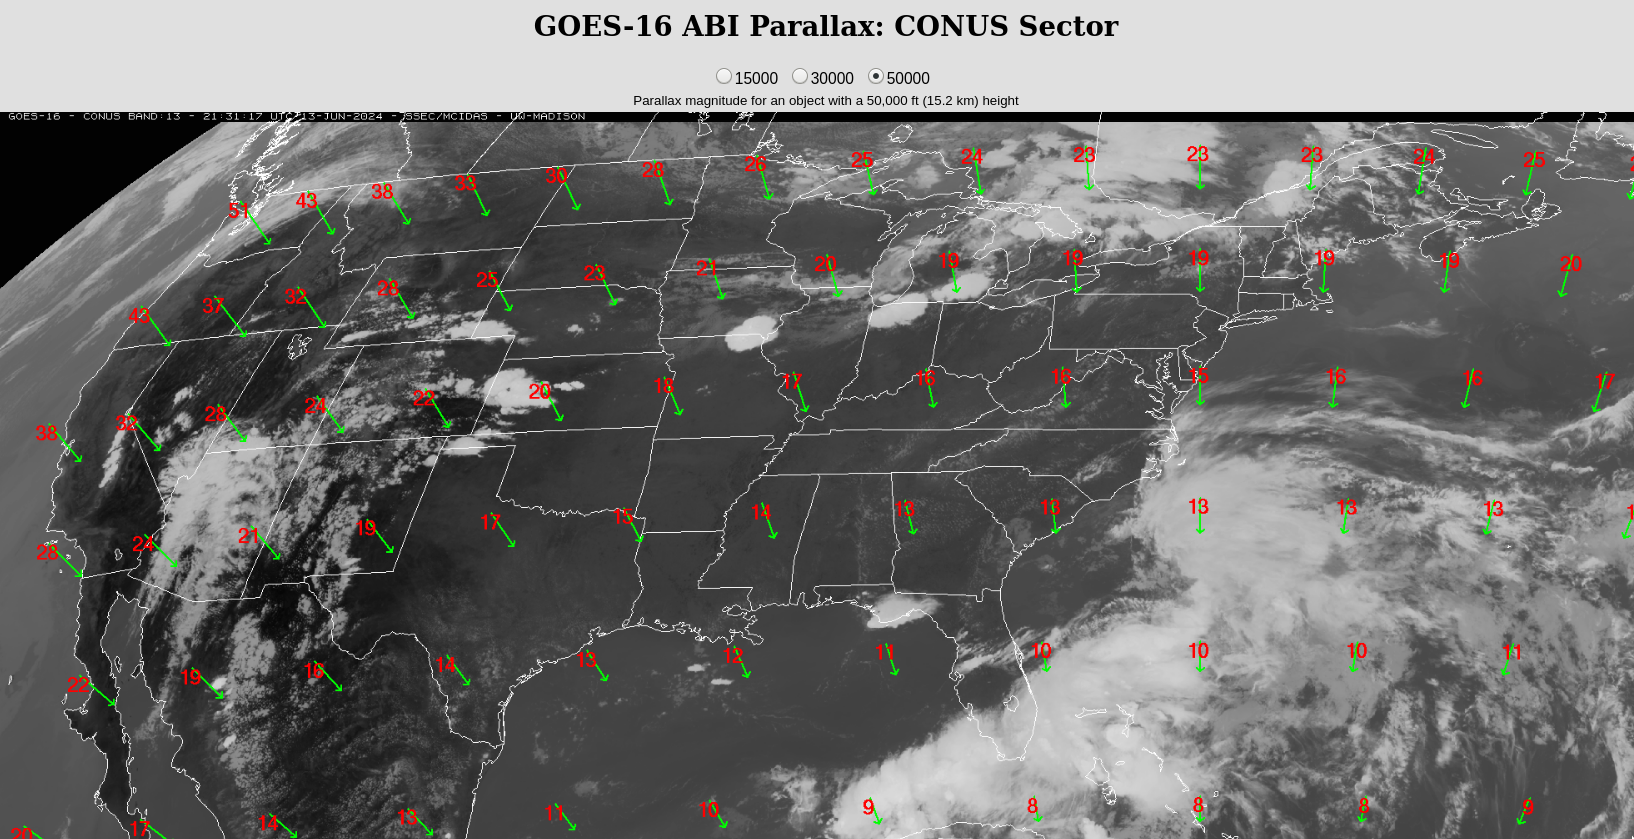
parallax adjustment of
~13 km with GOES-West imagery over American Samoa.
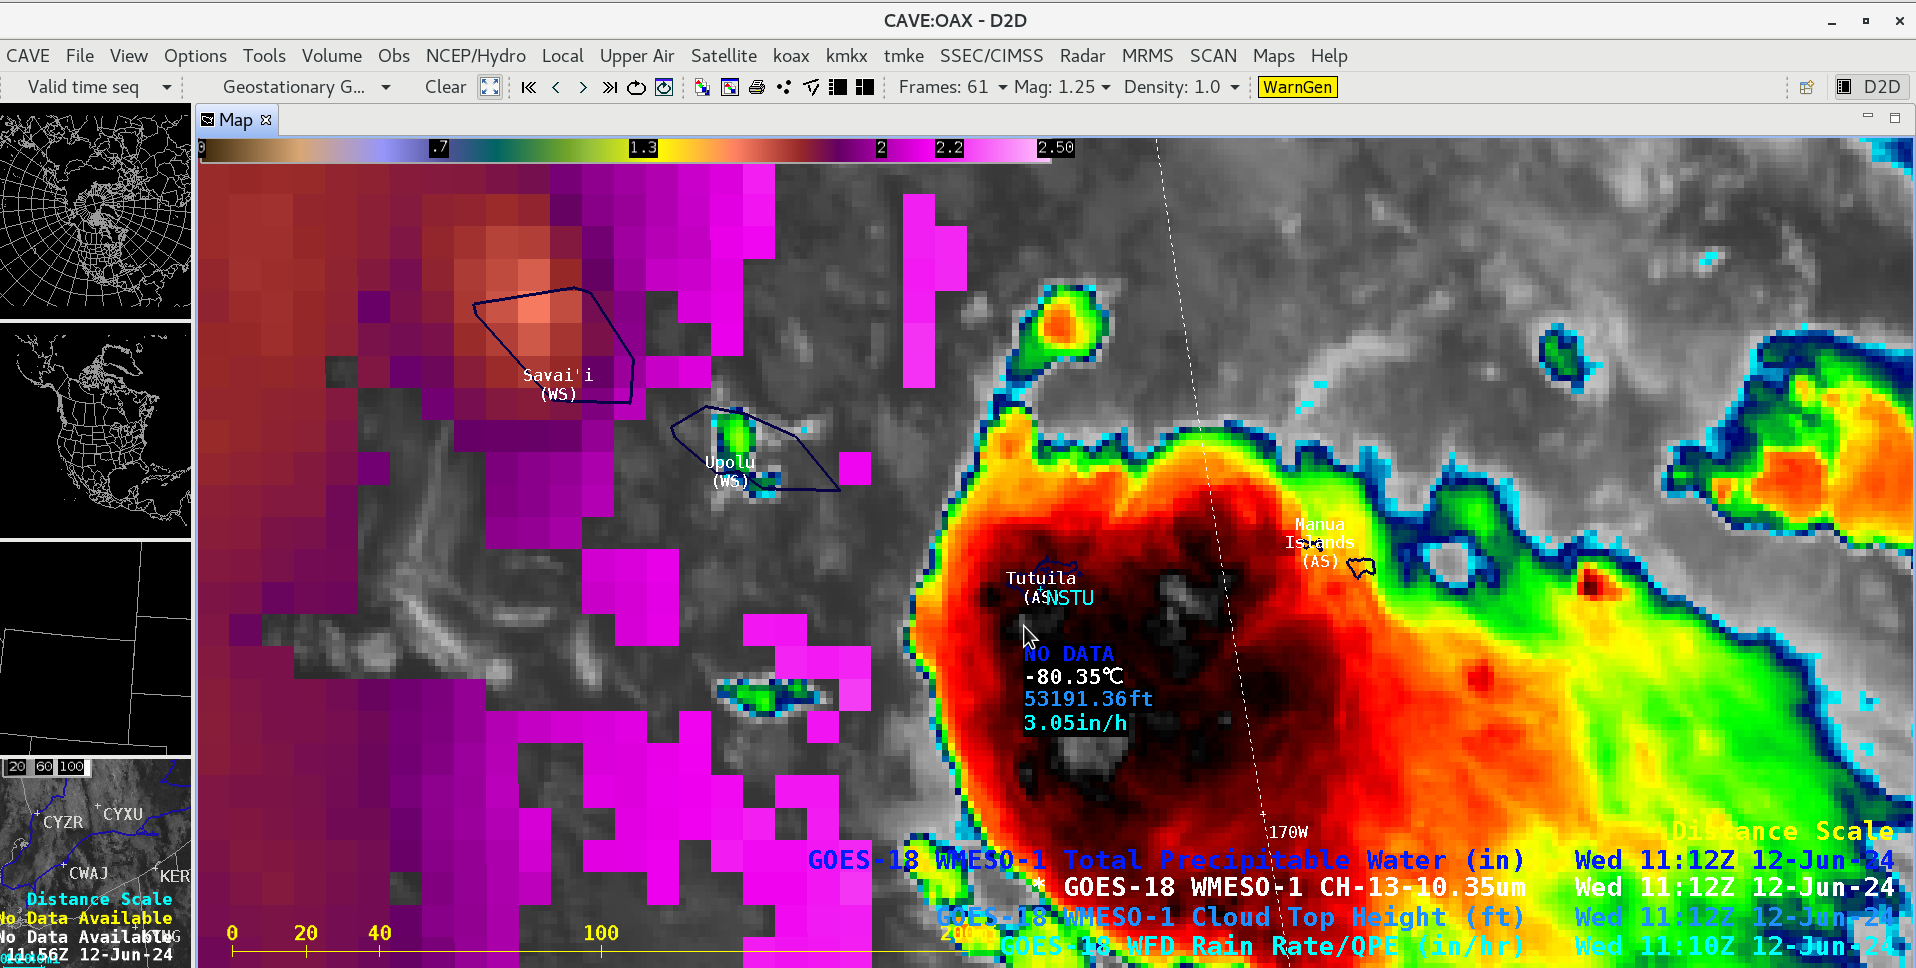
GOES-18 “Clean” Infrared Window (10.3 µm) image showing a cold thunderstorm overshooting top just southwest of the American Samoa island of Tutuila at 1112 UTC on 12 June, which included a cursor sample of the associated GOES-18 Cloud Top Height (light blue) and Rain Rate (cyan) derived products [click to enlarge]
A curious aspect of this deep convection was the appearance of cloud-top standing waves south of the Manu`a Islands, during the 1100-1300 UTC period. These standing waves can be seen in a toggle between GOES-18 “Clean” Infrared Window (10.3 µm) and Mid-level Water Vapor (
6.9 µm) images at 1152 UTC
(below) — a feature of unknown etiology that earns it a spot in the coveted “What the heck is this?” blog post category.
GOES-18 “Clean” Infrared Window (10.3 µm) and Mid-level Water Vapor (6.9 µm) images at 1152 UTC on 12 June [click to enlarge]
View only this post
Read Less

