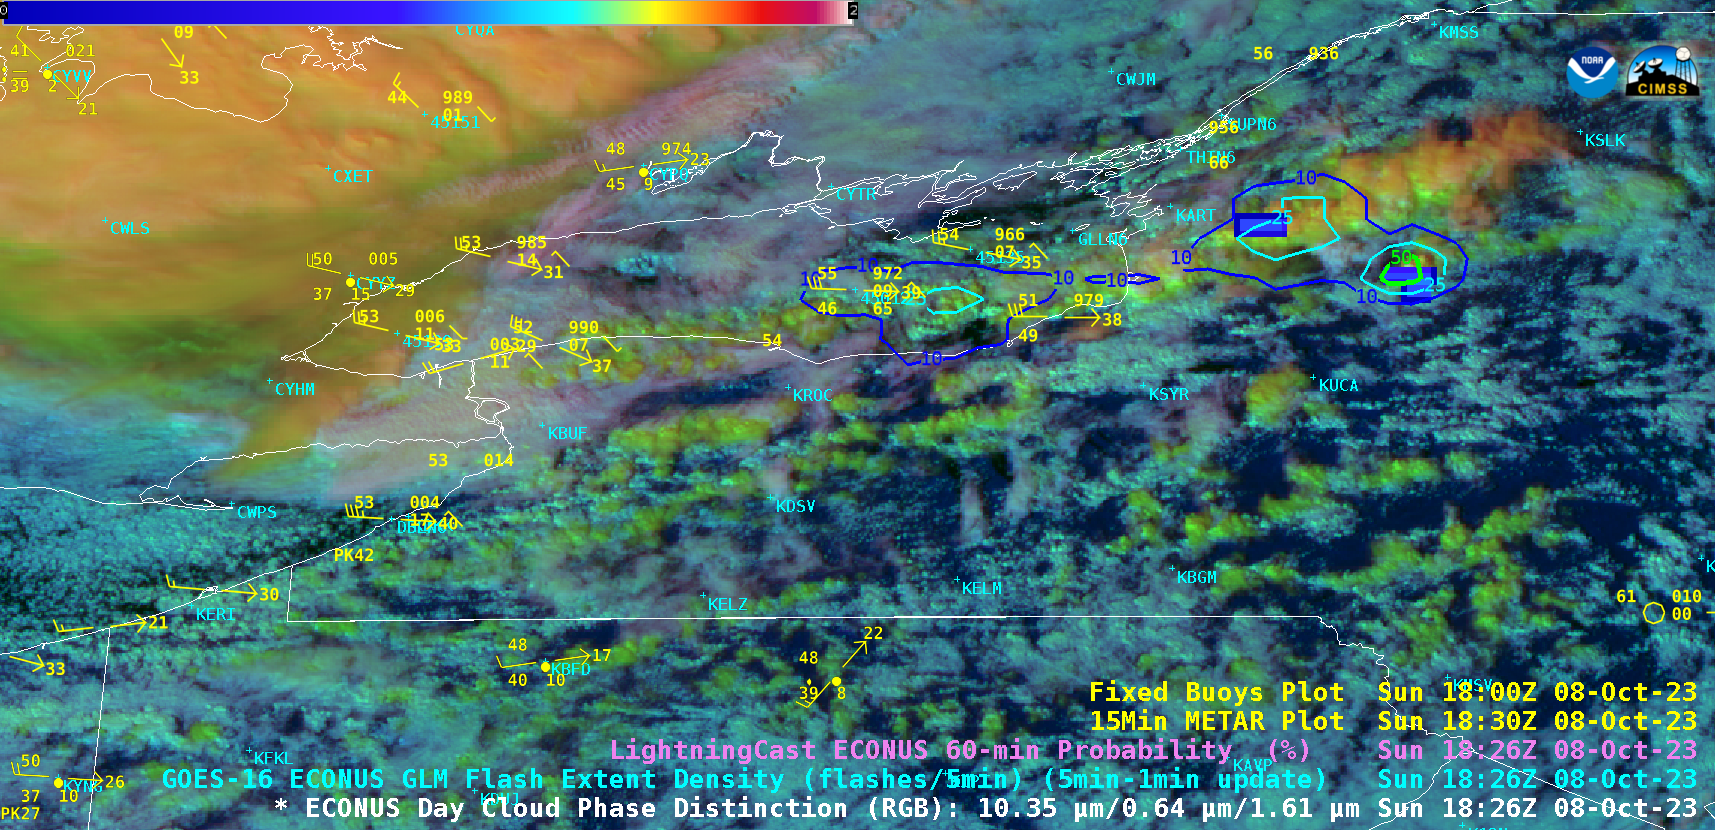
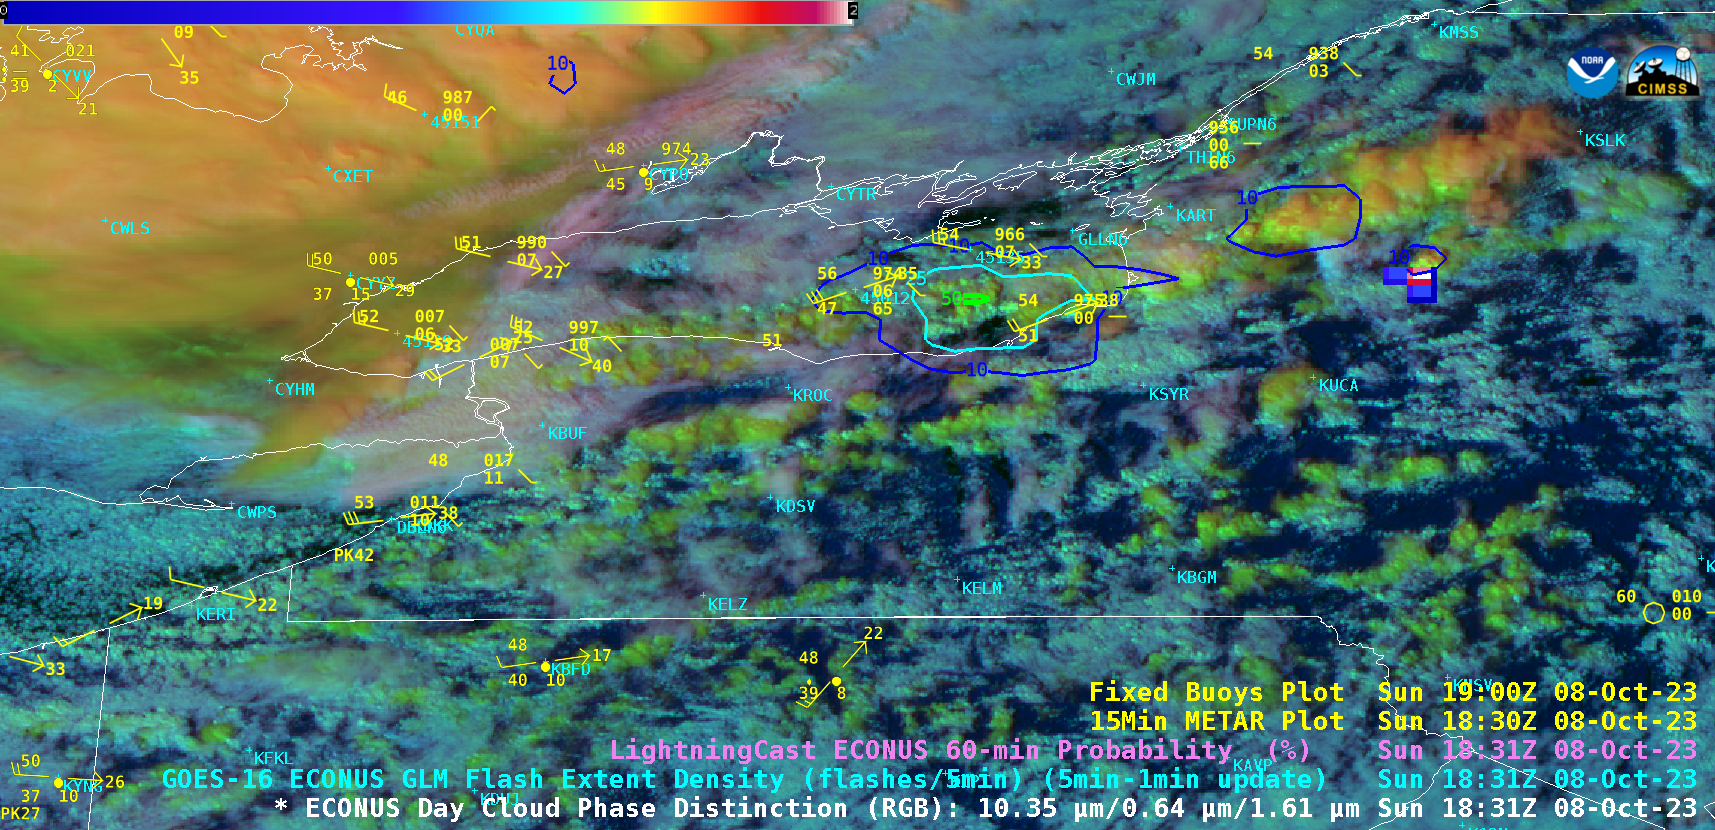
Lake effect rain downwind of Lake Erie and Lake Ontario
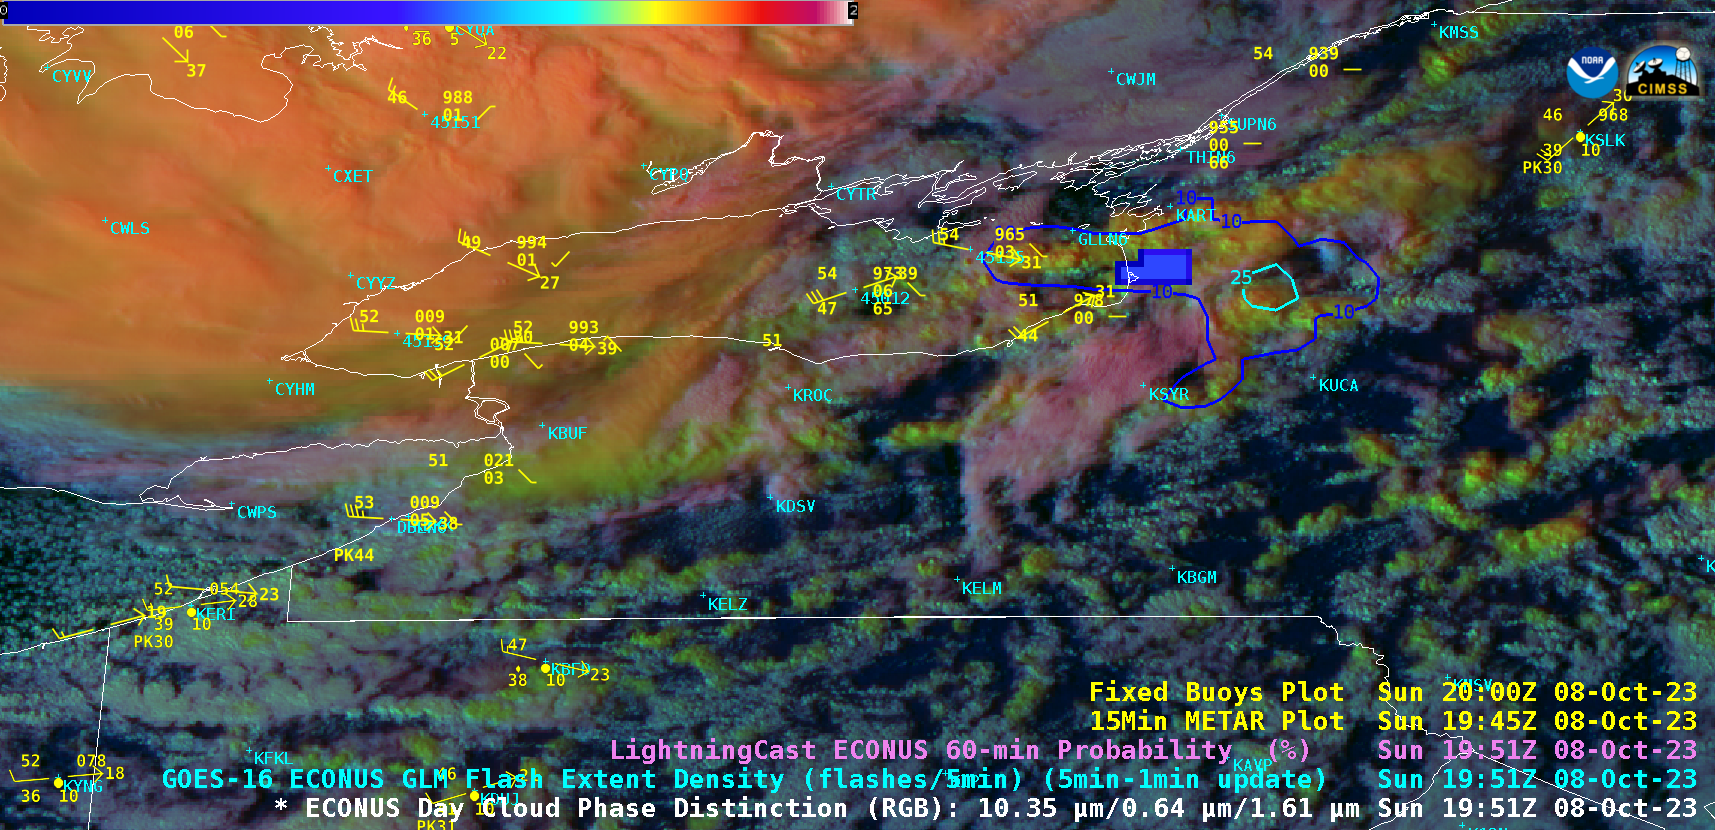
GOES-16 Day Cloud Phase Distinction RGB images with overlays of GLM Flash Extent Density, LightningCast Probability and Buoy/METAR reports, from 1301 UTC to 2101 UTC [click to play animated GIF | MP4]
The 2-km resolution GOES-16 CLAVR-x Cloud Top Height derived product (below) indicated that the maximum cloud top height of these lake effect rain bands was generally in the 25000-30000 ft range (lighter shade of green).
GOES-16 CLAVR-x Cloud Top Height derived product, from 1301 UTC to 2101 UTC [click to play animated GIF | MP4]
Similar to another case, this particular event demonstrated that the LightningCast model does possess some skill in predicting lightning during the cool season.