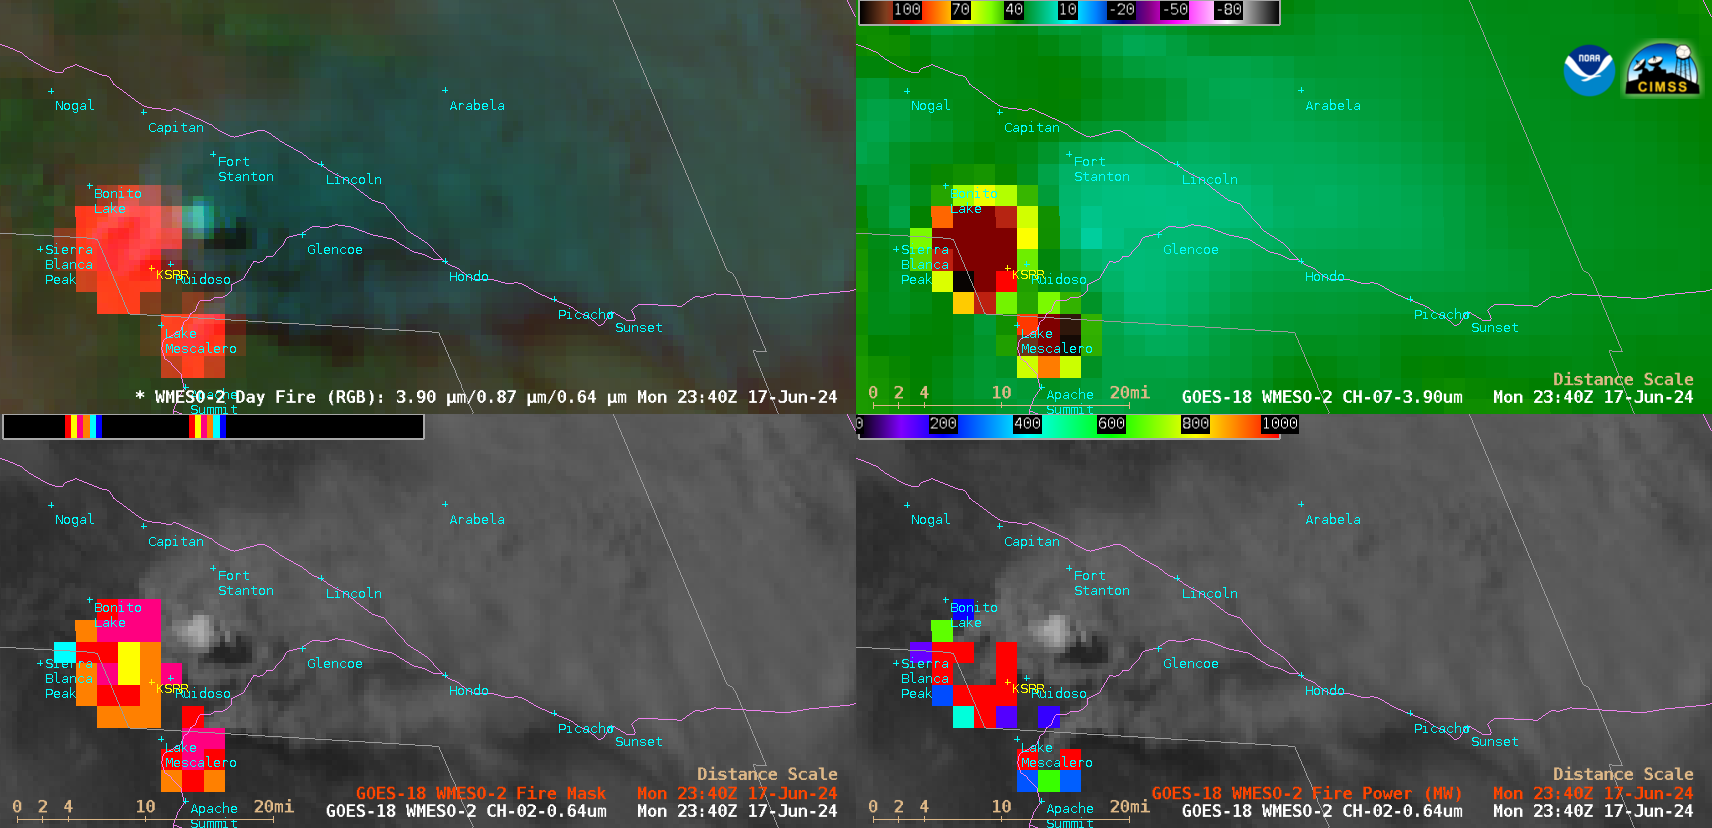
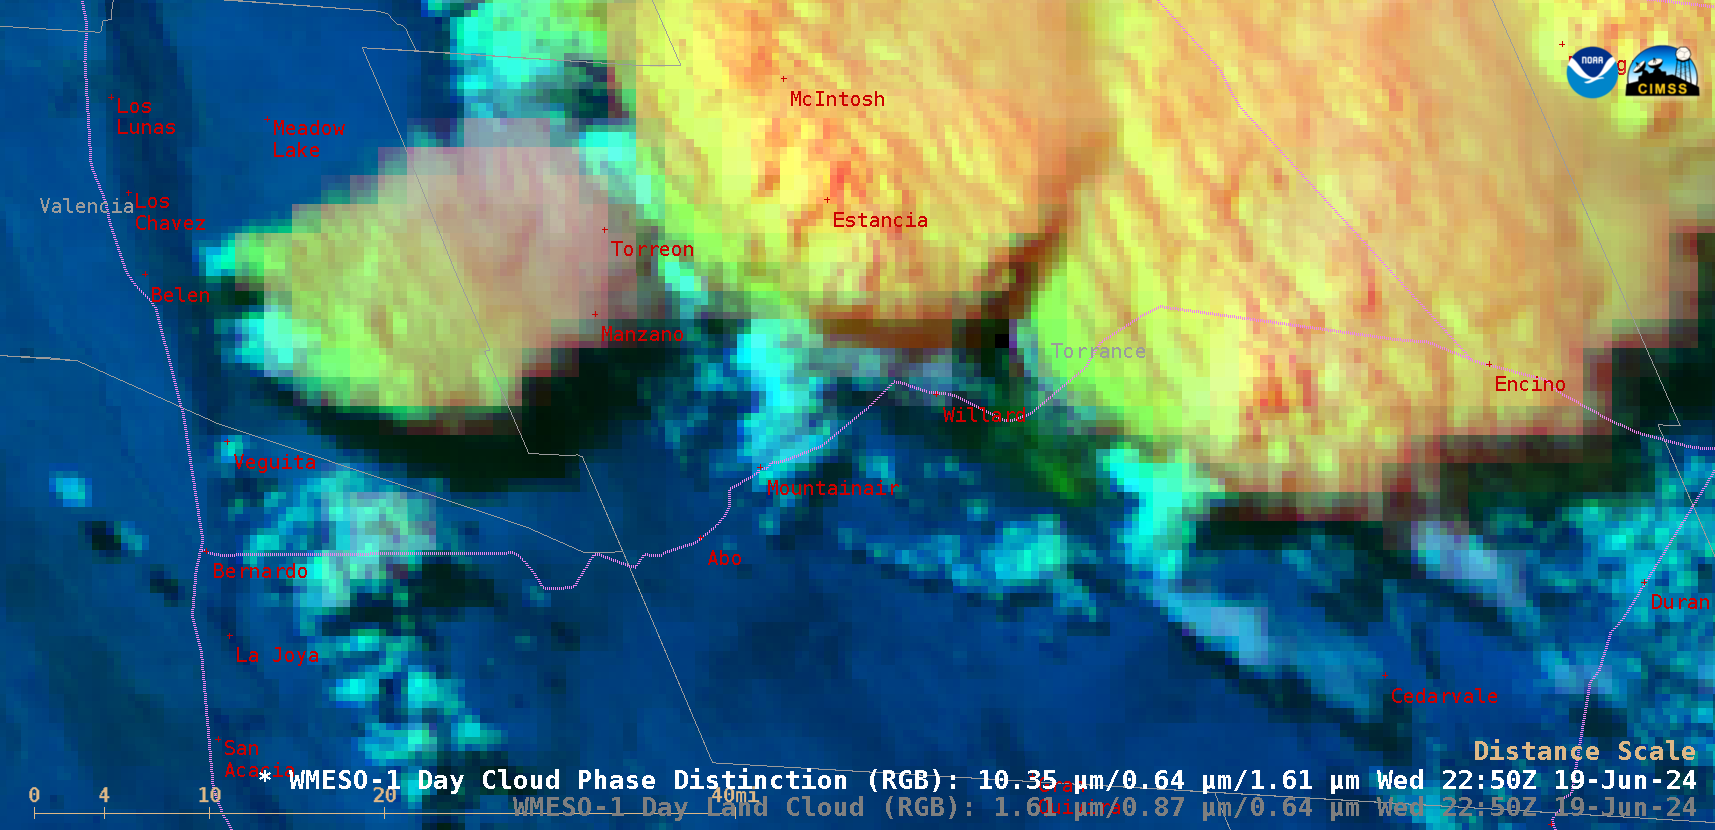
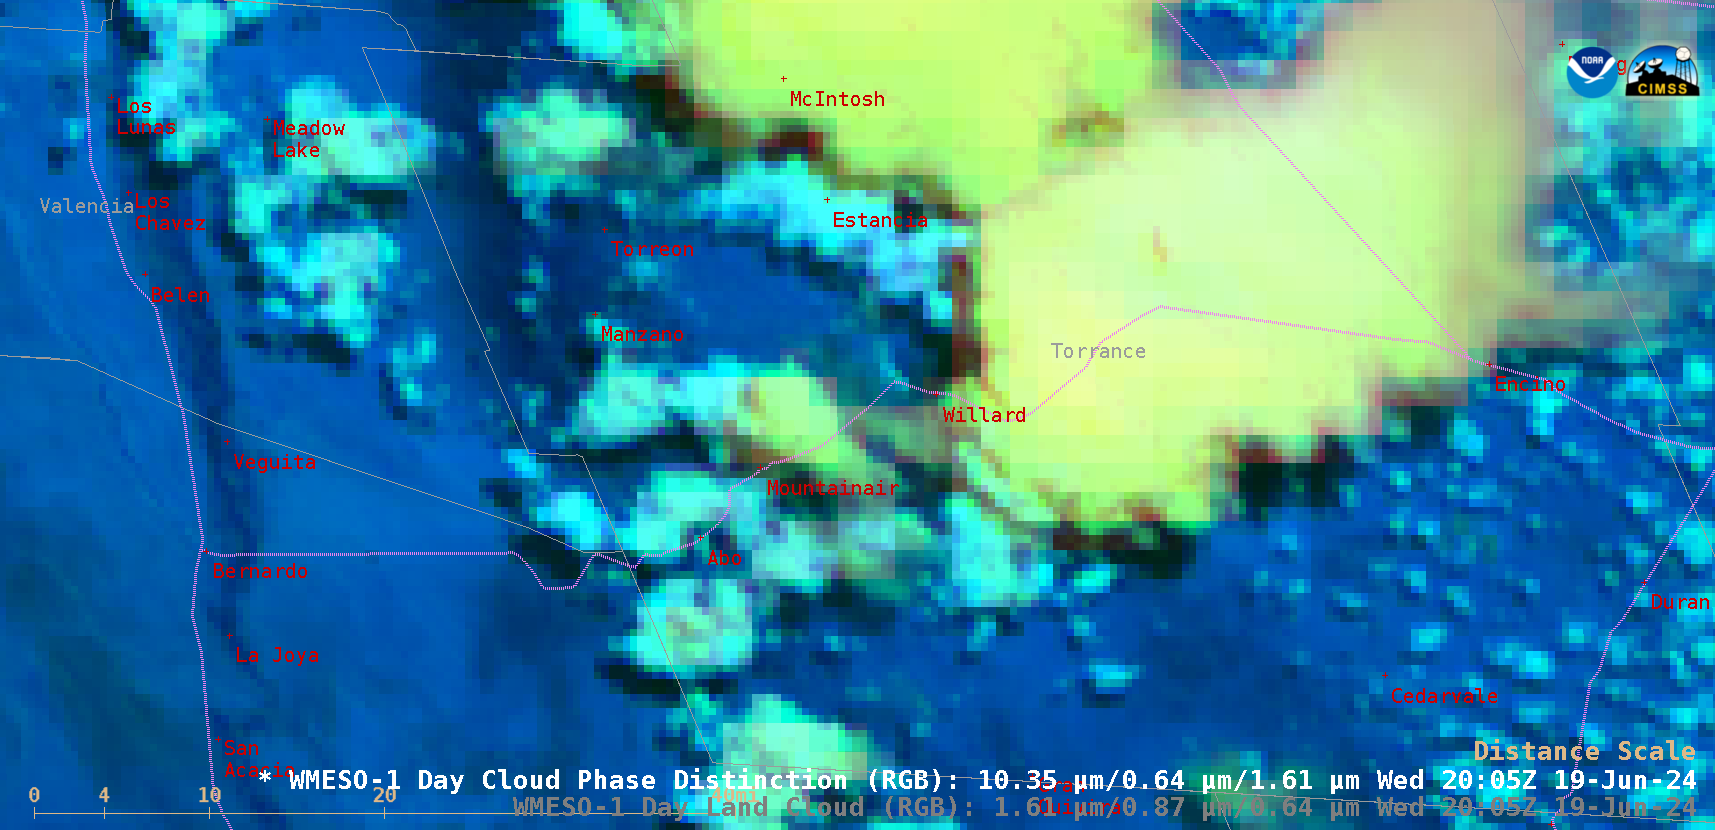
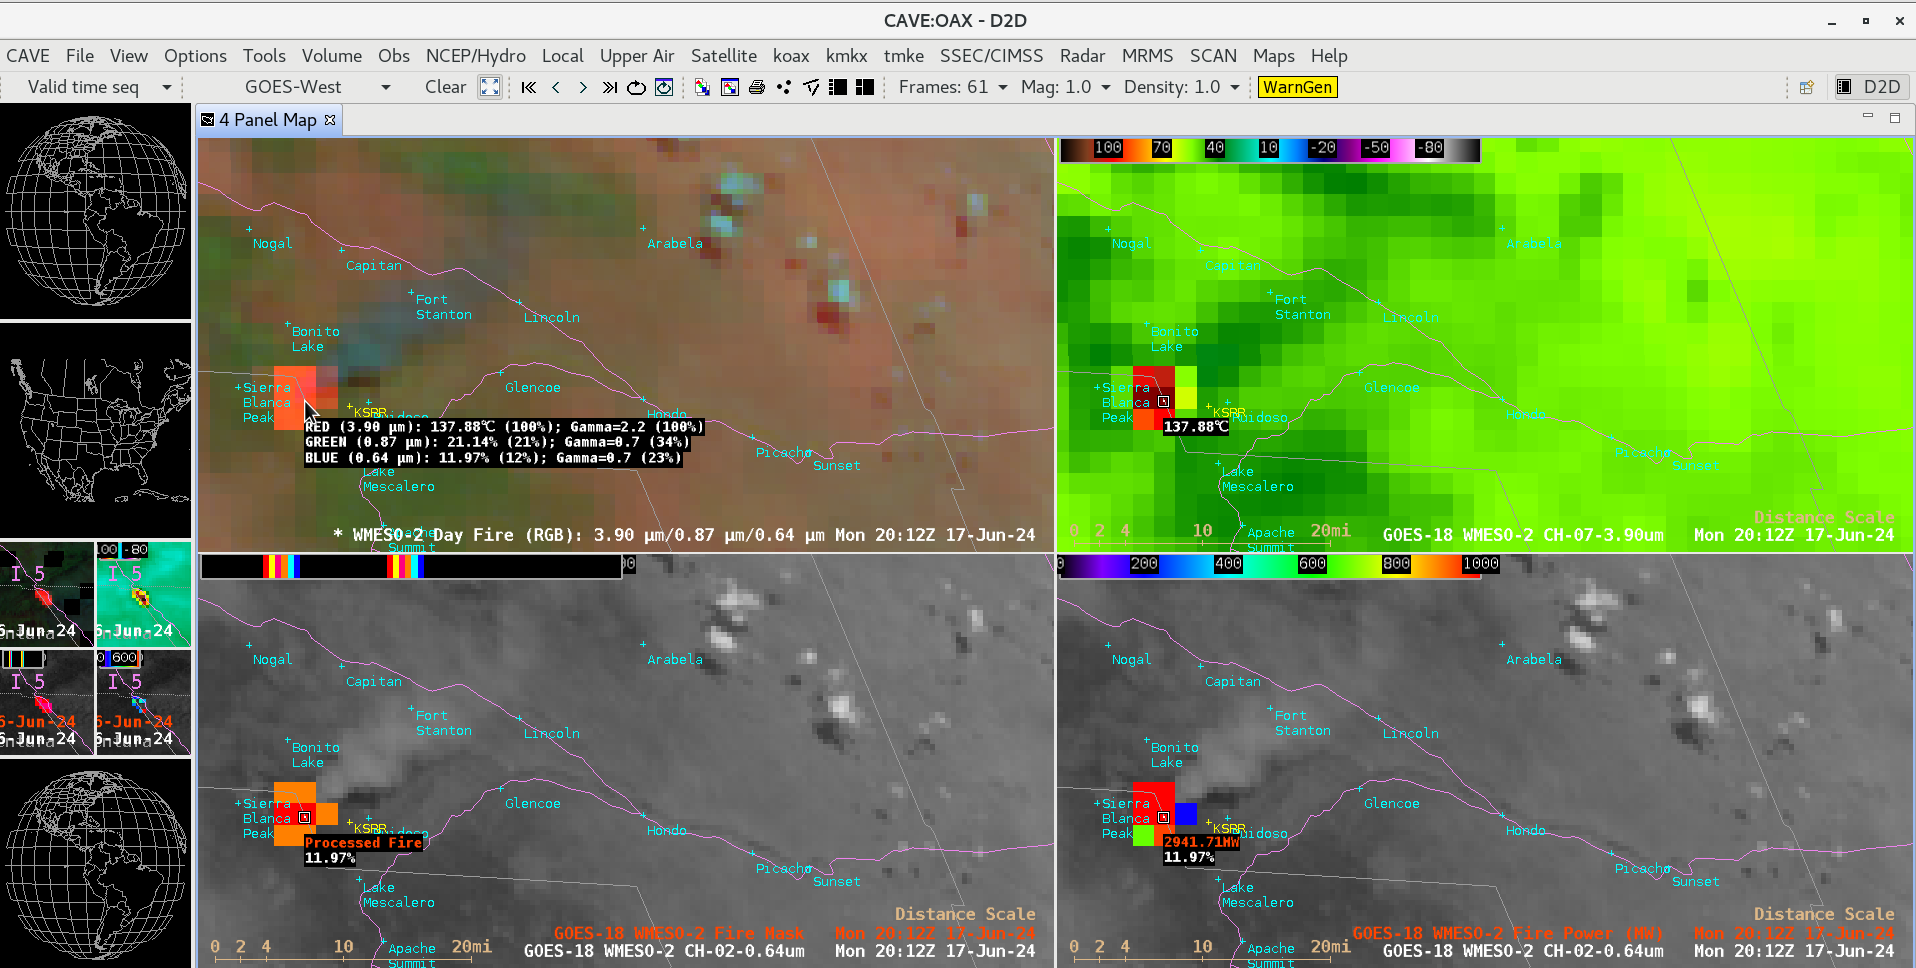
1-minute Mesoscale Domain Sector GOES-18 (GOES-West) Day Fire RGB, Shortwave Infrared (3.9 µm), and “Red” Visible (0.64 µm) images with overlays of the Fire Power and Fire Mask derived product (2 components of the GOES Fire Detection and Characterization Algorithm FDCA) (above) displayed signatures of the South Fork Fire and Salt Fire, which started on 17 June 2024 near Ruidoso in southern New Mexico. The GOES-18 3.9 µm Shortwave Infrared brightness temperature exhibited... Read More

1-minute GOES-18 Day Fire RGB (top left), Shortwave Infrared (3.9 µm, top right), and “Red” Visible (0.64 µm) images with overlays of the Fire Mask (bottom left) and Fire Power derived products (bottom right), from 1800 UTC on 17 June to 0200 UTC on 18 June; State Highways are plotted in violet [click to play animated GIF | MP4]
1-minute
Mesoscale Domain Sector GOES-18
(GOES-West) Day Fire RGB, Shortwave Infrared (
3.9 µm), and “Red” Visible (
0.64 µm) images with overlays of the Fire Power and Fire Mask derived product (2 components of the GOES Fire Detection and Characterization Algorithm
FDCA)
(above) displayed signatures of the
South Fork Fire and Salt Fire, which started on
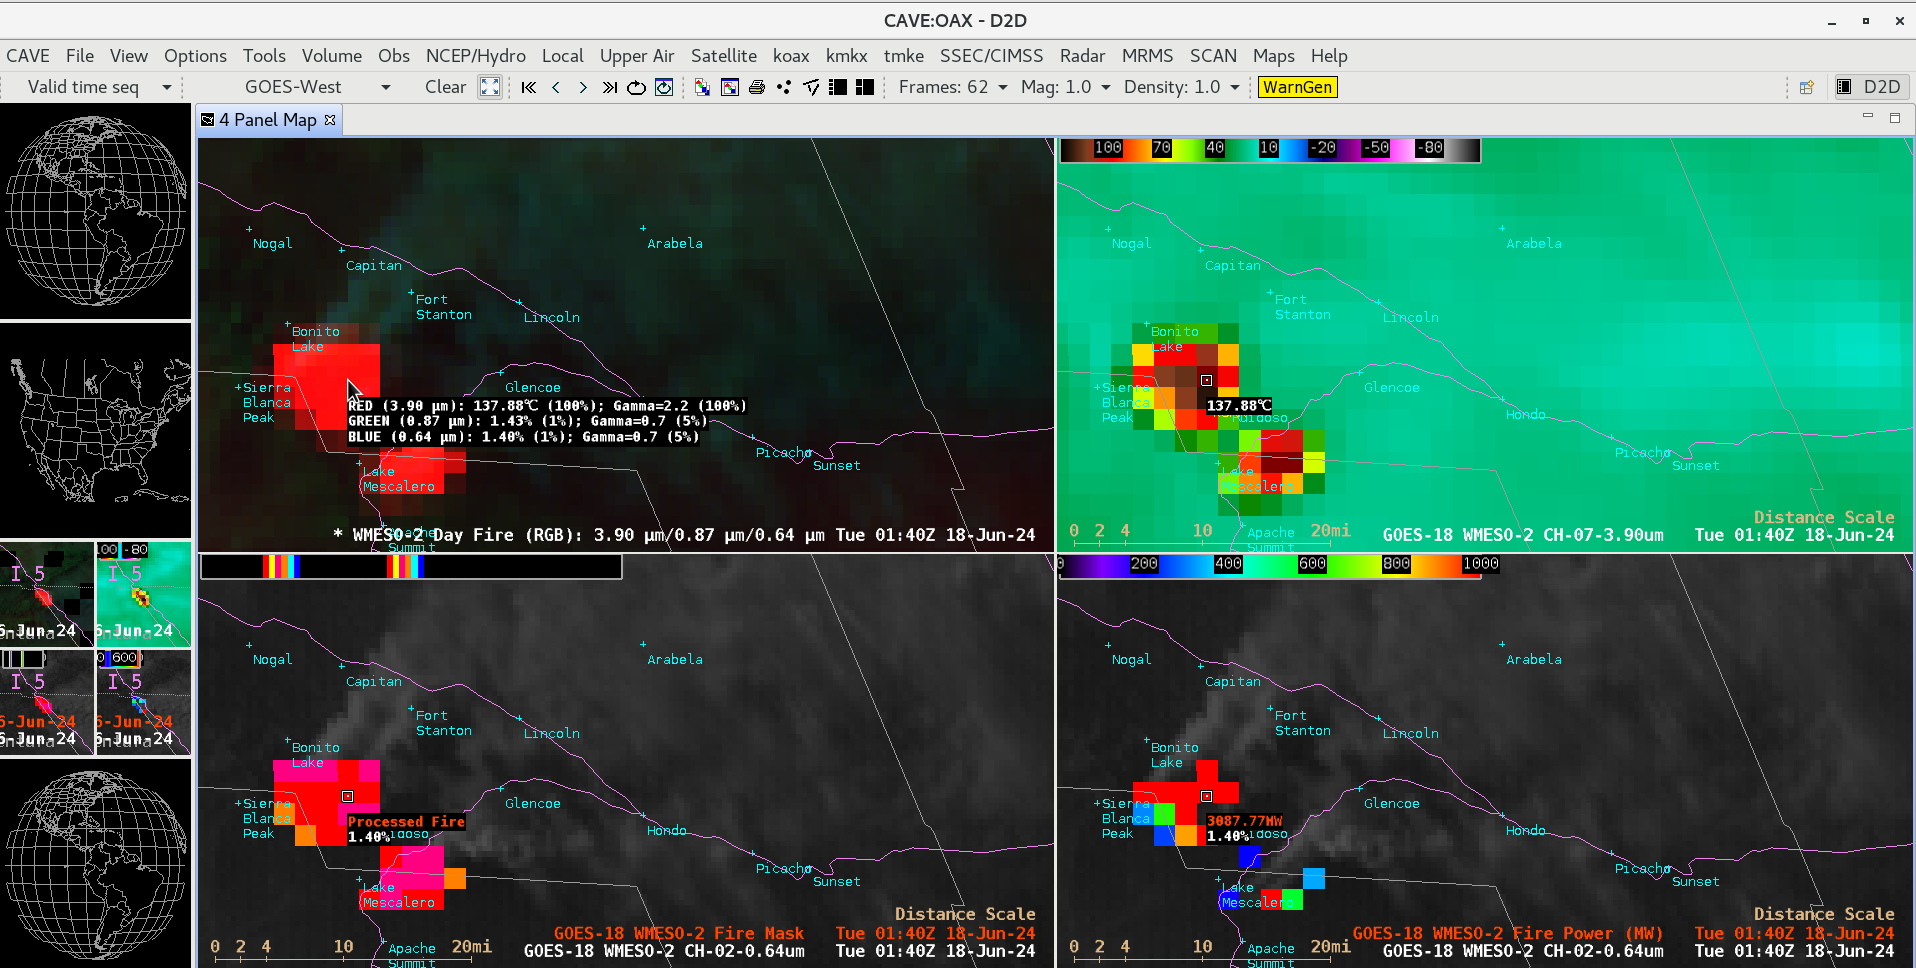
17 June 2024 near Ruidoso in southern New Mexico. The GOES-18 3.9 µm Shortwave Infrared brightness temperature exhibited by the northernmost South Fork Fire first reached 137.88ºC (the saturation temperature of GOES-18
ABI Band 7 detectors) at
2012 UTC — and that fire continually exhibited the 137.88ºC saturation temperature for about 5.5 hours (ending at
0140 UTC). The 2 wildfires caused evacuations to be ordered for much of Ruidoso community.
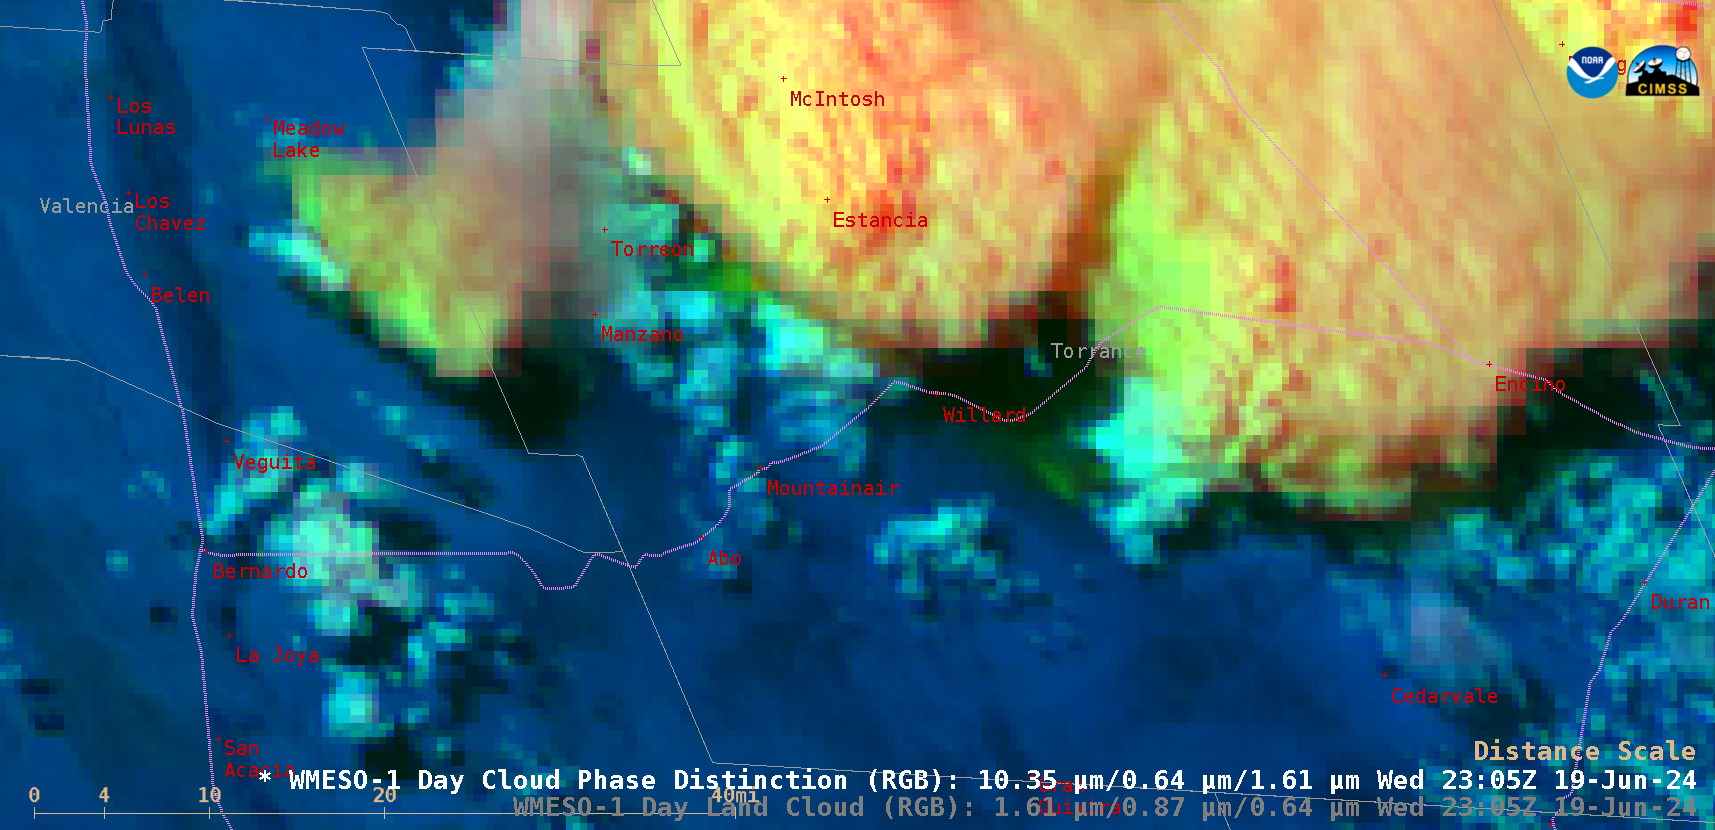
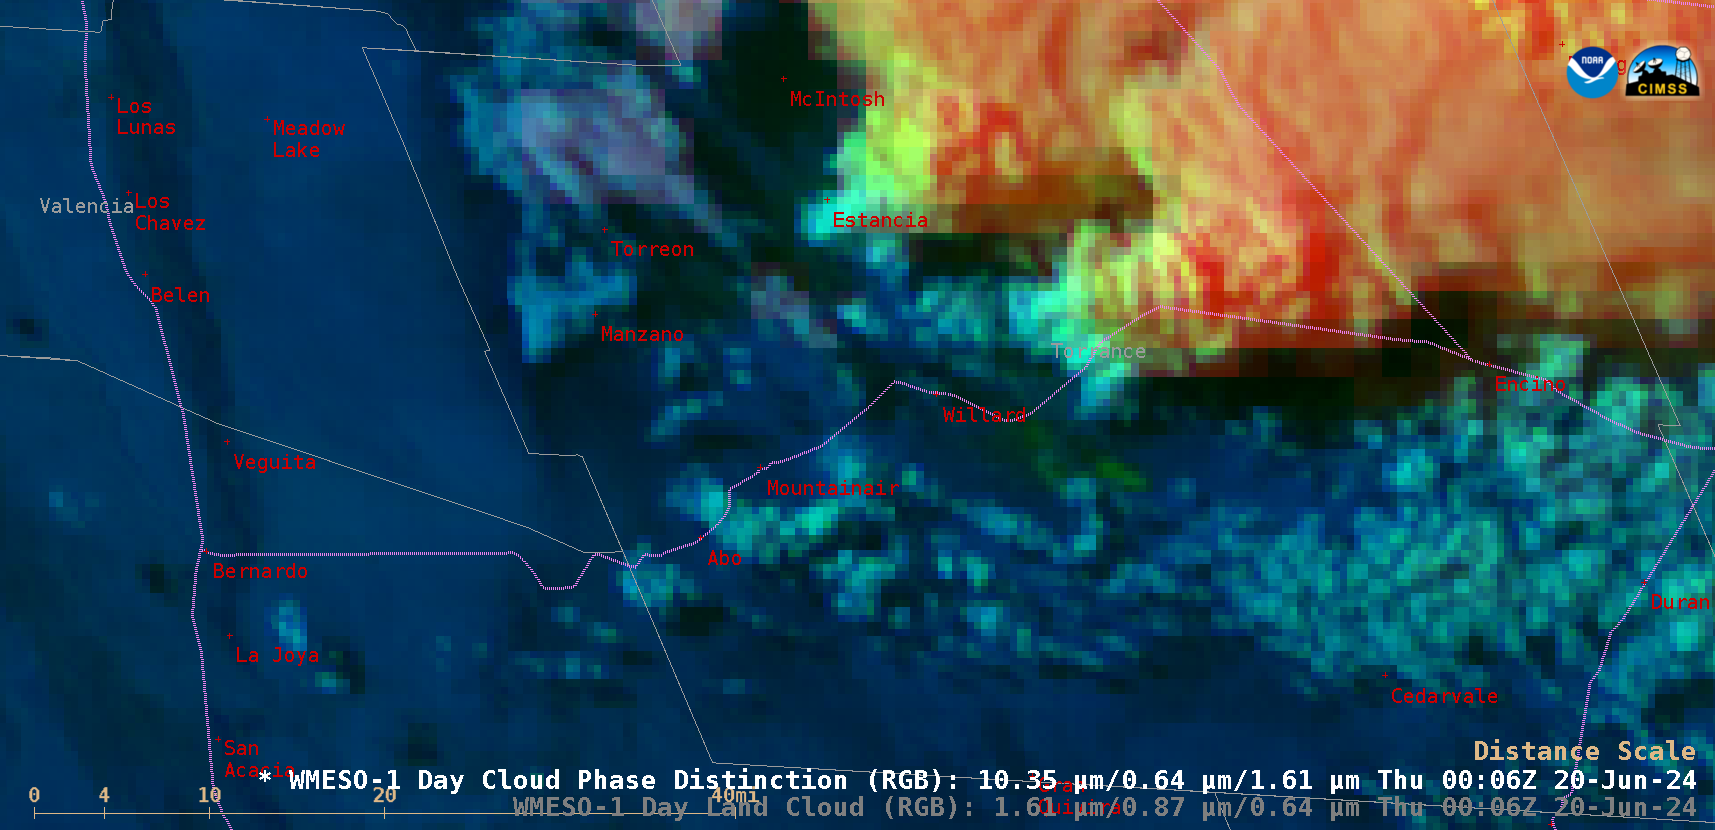
1-minute GOES-18 True Color RGB images (source) on 17 June (below) showed the transport of dense smoke from the wildfires. Note the occasional brighter-white pyrocumulus jumps near the fire source region.
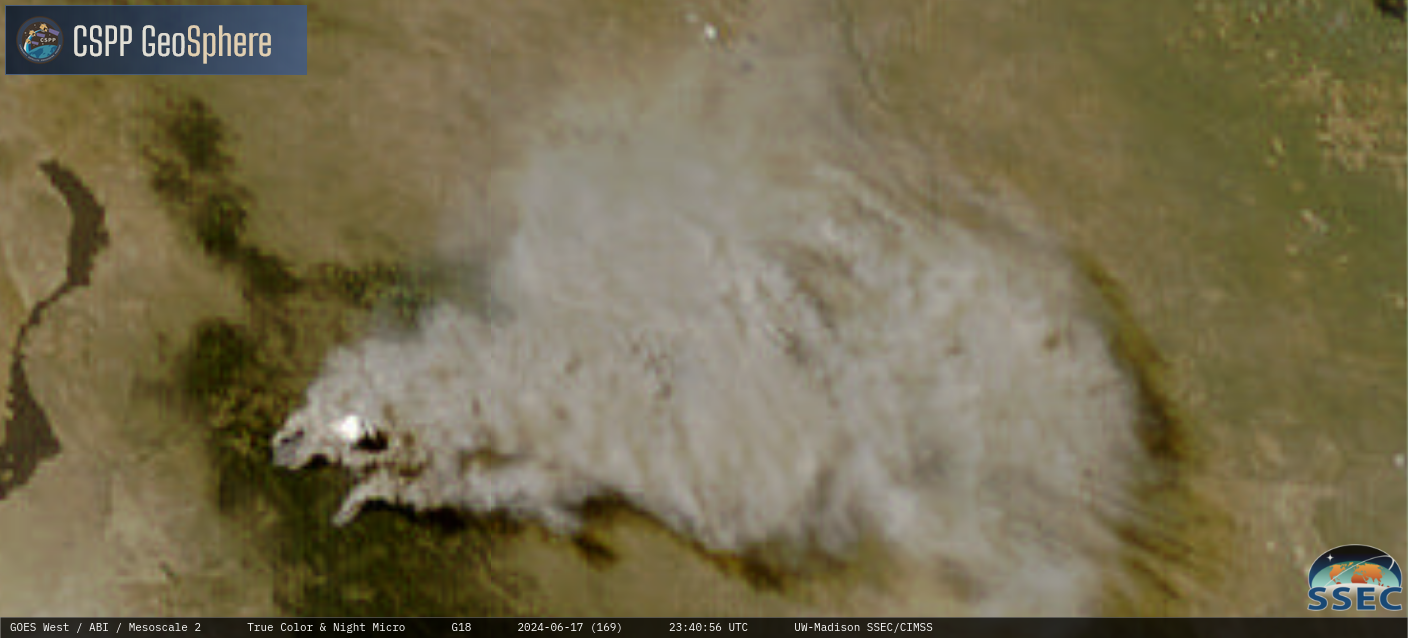
1-minute GOES-18 True Color RGB images, from 1900 UTC on 17 June to 0134 UTC on 18 June [click to play MP4 animation]
A Suomi-NPP VIIRS Day/Night Band image valid at 0809 UTC (2:09 AM local time) on 18 June
(below) displayed the bright nighttime glow of the 2 wildfires near Ruidoso — with the combined smoke plume extending to the northeast and fanning out across the Texas Panhandle. Smoke occasionally restricted the surface visibility to 4-5 miles at Ruidoso Regional Airport
KSRR.
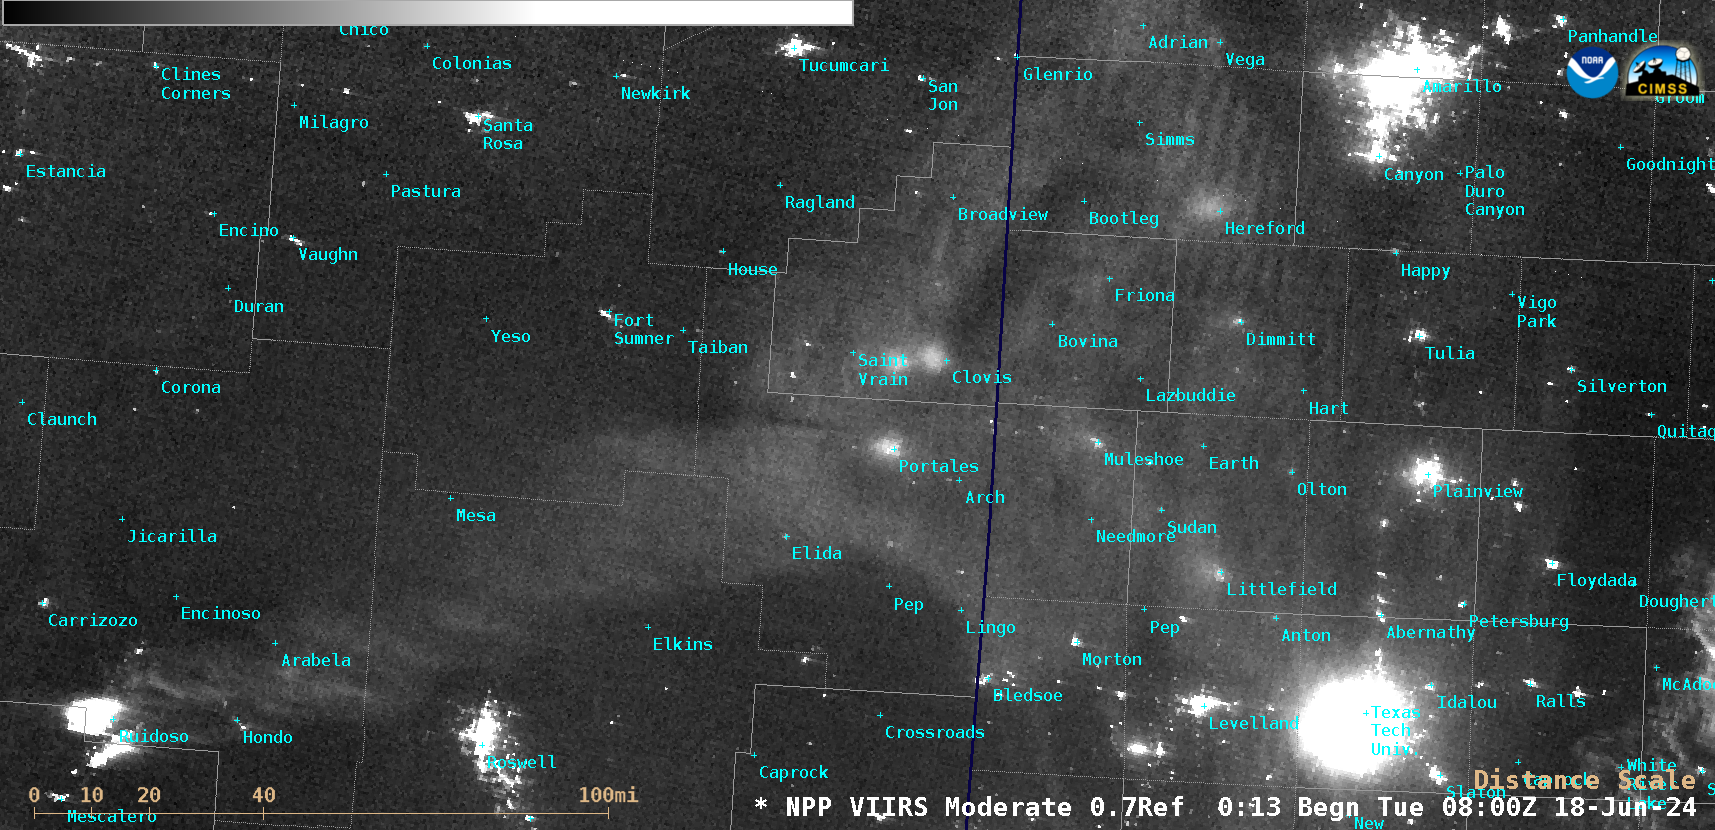
Suomi-NPP VIIRS Day/Night Band (0.7 µm) image valid at 0809 UTC on 18 June [click to enlarge]
1-minute GOES-18 images and derived fire products on 18 June are shown below.
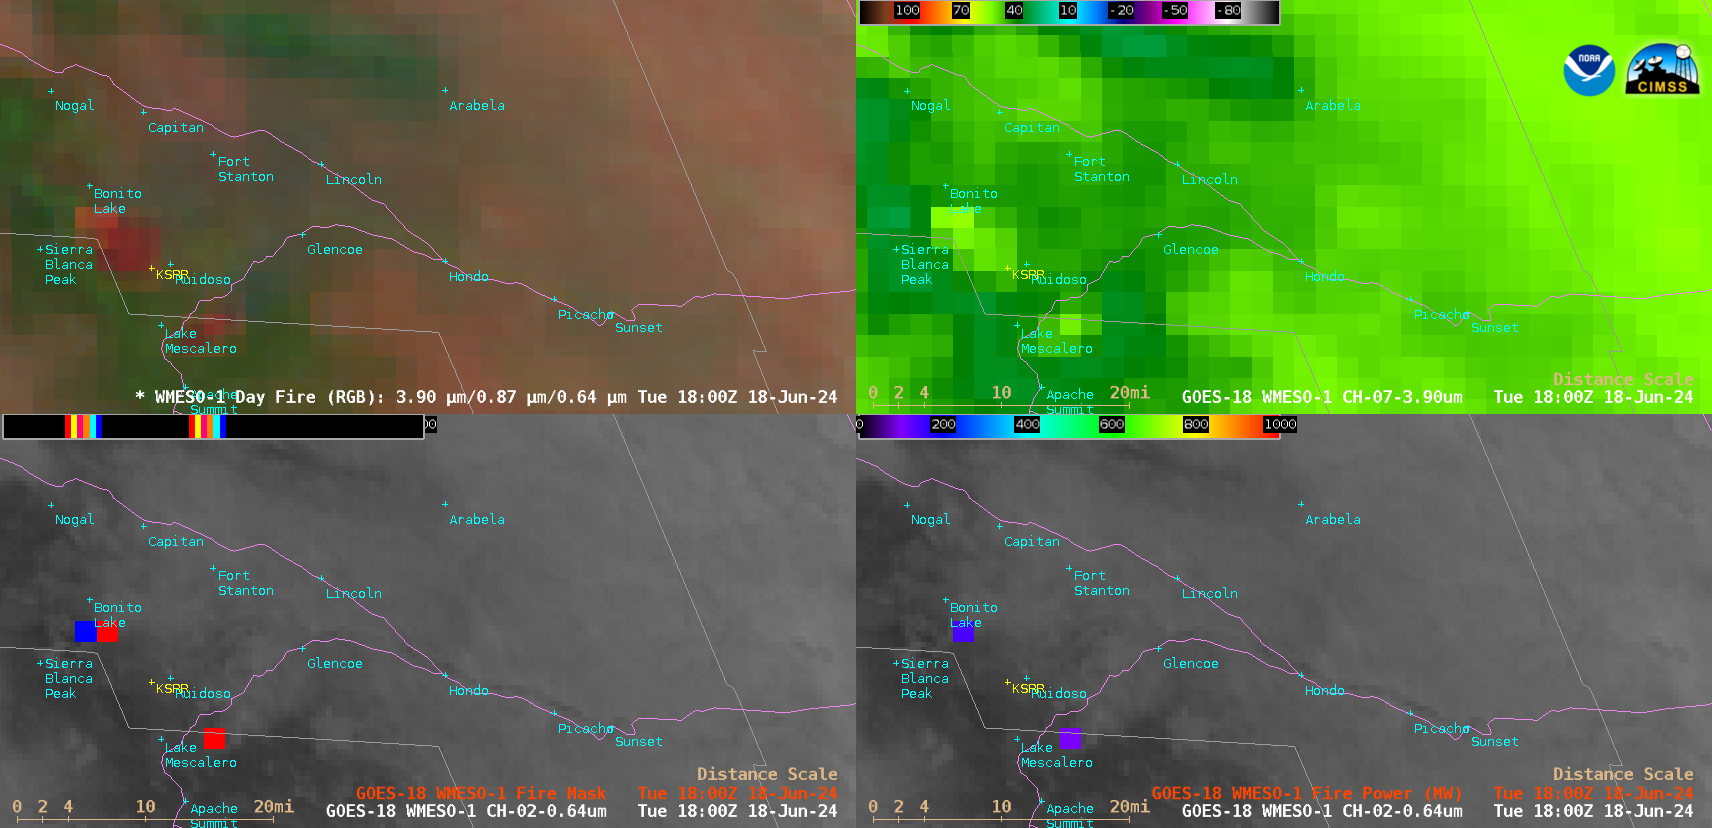
1-minute GOES-18 Day Fire RGB (top left), Shortwave Infrared (3.9 µm, top right), and “Red” Visible (0.64 µm) images with overlays of the Fire Mask (bottom left) and Fire Power derived products (bottom right), from 1500-2300 UTC on 18 June; State Highways are plotted in violet [click to play animated GIF | MP4]
View only this post
Read Less


