Hurricane Matthew: heavy rainfall and flooding across the Southeast and Mid-Atlantic US
![MIMIC Total Precipitable Water product, from 06 October/04 UTC to 08 October/16 UTC [click to play MP4 animation]](https://cimss.ssec.wisc.edu/satellite-blog/wp-content/uploads/sites/5/2016/10/comp20161008.000000_tpw.png)
MIMIC Total Precipitable Water product, from 06 October/04 UTC to 08 October/16 UTC [click to play MP4 animation]
Track of Matthew, from 28 September at 12 UTC to 09 October at 18 UTC
Matthew set numerous records for intensity, longevity, and landfall (summary) — an animation of hourly GOES-13 Water Vapor (6.5 µm) images covering the 11-day period from 12 UTC on 28 September to 12 UTC on 09 October is shown below (also available as a large 113 Mbyte animated GIF). The CIMSS Tropical Cyclones site posted GOES-13 Visible (0.63 µm) animations from the individual days of 03 October, 04 October, 05 October, 06 October, 07 October, and 08 October.
![GOES-13 Water Vapor (6.5 µm) images [click to play MP4 animation]](https://cimss.ssec.wisc.edu/satellite-blog/wp-content/uploads/sites/5/2016/10/960x1280_AGOES13_B3_GOES13_WV_MATTHEW_28SEP-09OCT2016_2016277_181500_0001PANEL.GIF)
GOES-13 Water Vapor (6.5 µm) images [click to play MP4 animation]
![Suomi NPP VIIRS Day/Night Band (0.7 µm) images on 28 September, 09 October and 10 October [click to enlarge]](https://cimss.ssec.wisc.edu/satellite-blog/wp-content/uploads/sites/5/2016/10/160928_161009_161010_suomi_npp_viirs_Day_Night_Band_Southeast_US_power_outages_Hurricane_Matthew_anim.gif)
Suomi NPP VIIRS Day/Night Band (0.7 µm) images on 28 September, 09 October and 10 October [click to enlarge]
![Suomi NPP VIIRS true-color image [click to enlarge]](https://cimss.ssec.wisc.edu/satellite-blog/wp-content/uploads/sites/5/2016/10/161009_viirs_truecolor_Southeast_US_coastal_turbidity_Hurricane_Matthew_anim.gif)
Suomi NPP VIIRS true-color image [click to enlarge]
![Terra MODIS Sea Surface Temperature product [click to enlarge]](https://cimss.ssec.wisc.edu/satellite-blog/wp-content/uploads/sites/5/2016/10/MODIS_SST_20161010_0243.png)
Terra MODIS Sea Surface Temperature product [click to enlarge]
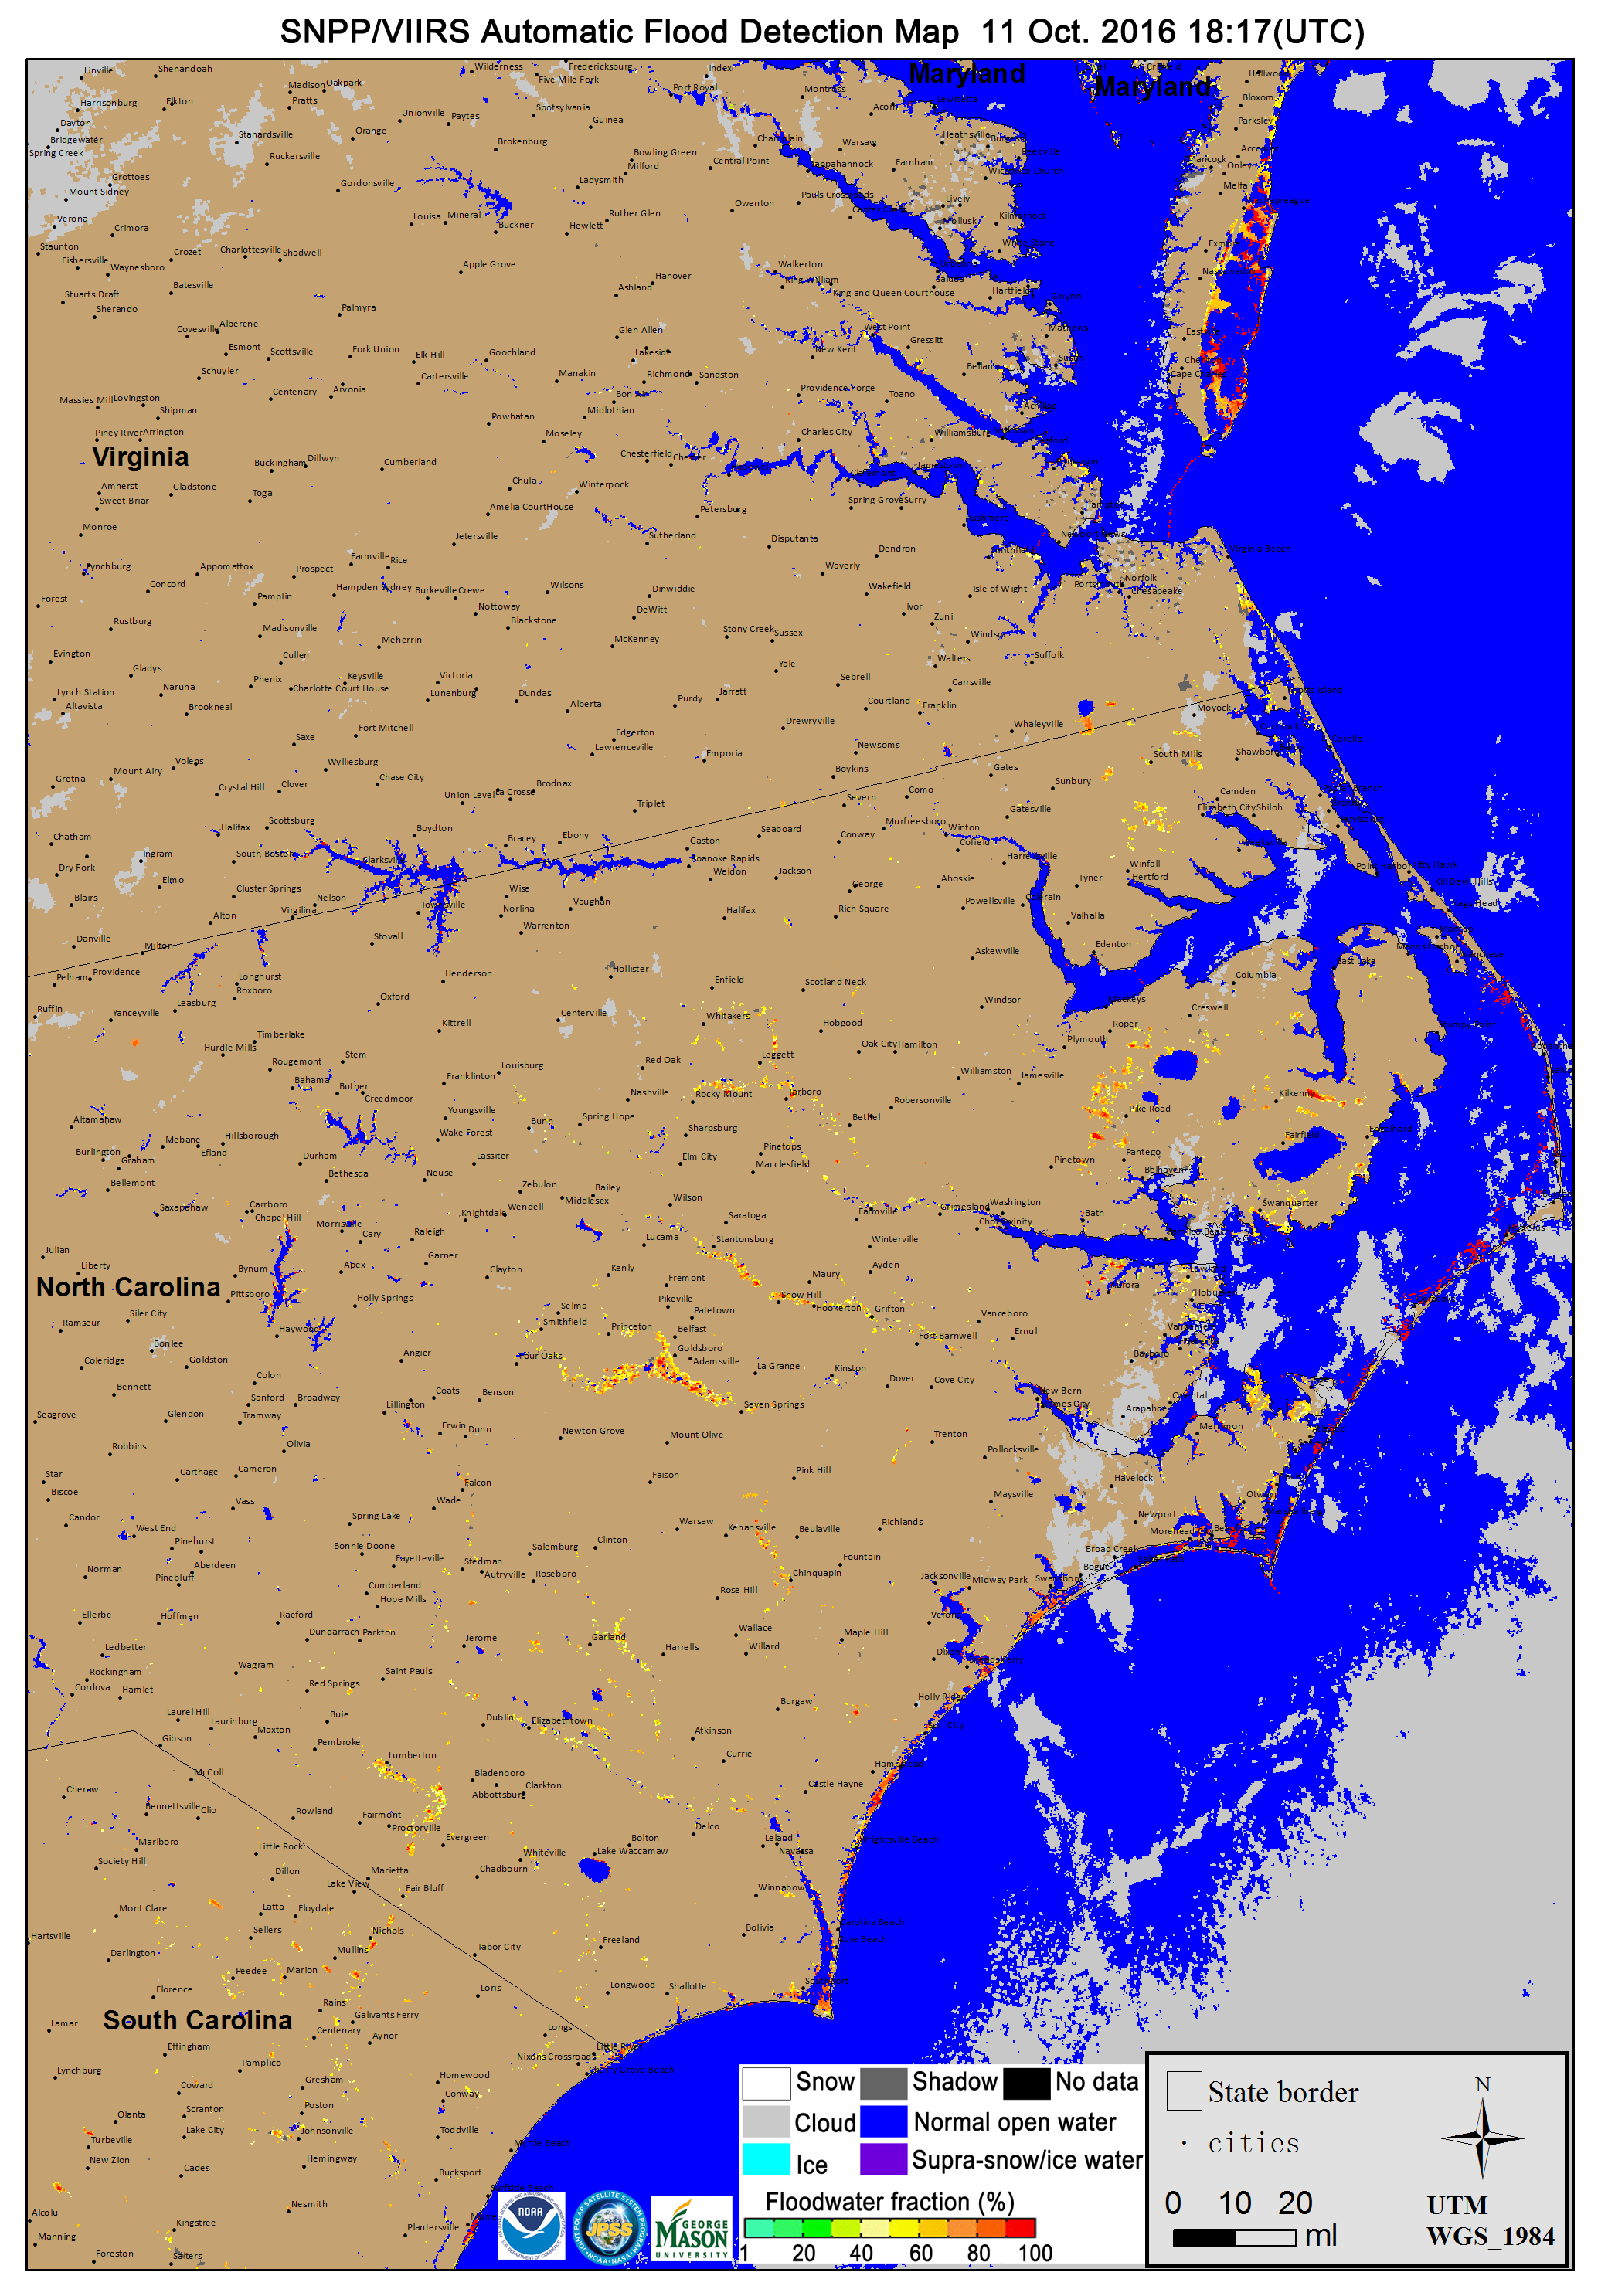
JPSS River Flood product produced with Suomi NPP data, 1817 UTC on 11 October 2016 (Click to enlarge)
A sequence of 1 pre-Matthew (06 September) and 3 post-Matthew (09, 10 and 12 October) Terra/Aqua MODIS false-color RGB images from the SSEC MODIS Today site (below) also helped to highlight areas of flooding (darker shades of blue, especially notable along river valleys) that resulted from the heavy rainfall.
![Terra and Aqua MODIS false-color images, from 06 September and 09, 10 and 12 October 2016 [click to enlarge]](https://cimss.ssec.wisc.edu/satellite-blog/wp-content/uploads/sites/5/2016/10/160906-161012_modis_falsecolor_NC_flooding_Matthew_anim.gif)
Terra and Aqua MODIS false-color images, from 06 September and 09, 10 and 12 October 2016 [click to enlarge]