From the Area Forecast Discussion issued by the National Weather Service forecast office in St. Louis, Missouri:AREA FORECAST DISCUSSION NATIONAL WEATHER SERVICE ST LOUIS MO 340 AM CST SUN FEB 3 2013 .SHORT TERM… ISSUED AT 330 AM CST SUN FEB 3 2013 (TODAY... Read More
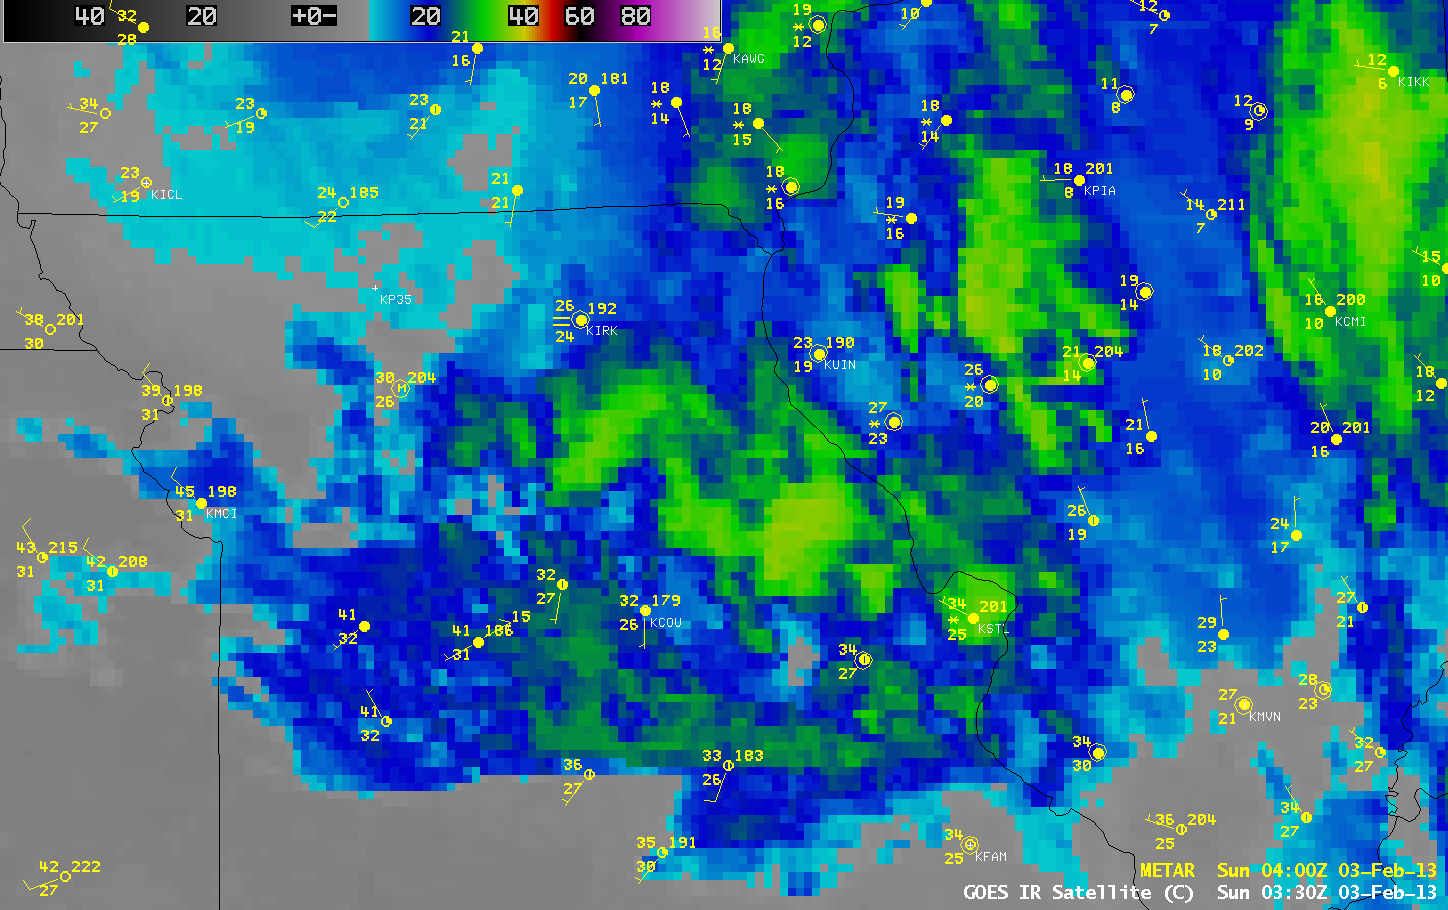
GOES-13 10.7 µm IR channel images (click image to play animation)
From the Area Forecast Discussion issued by the National Weather Service forecast office in St. Louis, Missouri:
AREA FORECAST DISCUSSION
NATIONAL WEATHER SERVICE ST LOUIS MO
340 AM CST SUN FEB 3 2013
.SHORT TERM…
ISSUED AT 330 AM CST SUN FEB 3 2013
(TODAY THROUGH TUESDAY)
THANKS TO A COMPACT AND POTENT NW FLOW VORT MAX…SOME RATHER IMPRESSIVE LOW LEVEL FORCING AND A POCKET OF STEEP MID LEVEL LAPSE RATES…A NICE BAND OF 2-4 INCHES OF SNOW FELL LAST NIGHT WITH THE HIGHEST AMOUNTS CENTERED RIGHT THROUGH THE ST LOUIS METRO. KUDOS TO THE SAT AFTERNOON RUNS OF THE HRRR WHICH WAS THE SOLE MODEL THAT COMPLETELY NAILED THE SNOWFALL FORECAST.
A sequence of 4-km resolution GOES-13 10.7 µm IR channel images (above; click image to play animation) showed the disturbance as it was moving southeastward through the region during the night-time (pre-dawn) hours on 03 February 2013. Some of the cloud elements appeared to be convective in nature, with cloud top IR brightness temperatures as cold as -40 C (yellow color enhancement).
A comparison of a 4-km resolution GOES-13 10.7 µm IR image with a 1-km resolution MODIS 11.0 µm IR image (below) demonstrated the advantage of improved spatial resolution for depicting the location and edges of the individual cloud elements with polar-orbiting satellite imagery. Despite the times shown on the image labels, the actual times that the 2 satellites were scanning this area were fairly close — the northwestward displacement of the cloud features on the GOES-13 IR image is due to parallax.
MODIS 11.0 µm IR channel and GOES-13 10.7 µm IR channel images
On the following afternoon, a comparison of a 1-km resolution Suomi NPP VIIRS 0.64 µm visible channel image with the corresponding False-color Red/Green/Blue (RGB) image at 18:51 UTC or 12:51 PM local time (below) showed the northwest-to-southeast oriented swath of snowfall — snow on the ground appeared as the darker shades of red in the RGB image. The highest snowfall amount reported was 5.0 inches (NWS St. Louis event summary).
Suomi NPP VIIRS 0.64 µm visible channel and False-color Red/Green/Blue (RGB) images
A closer view using 250-meter resolution MODIS true-color and false-color RGB images from the SSEC MODIS Today site (below) showed the snow cover at 19:03 UTC or 1:03 PM local time. In this particular false-color RGB, snow cover appears as shades of cyan.

MODIS true-color and false-color Red/Green/Blue (RGB) images
View only this post
Read Less
")


