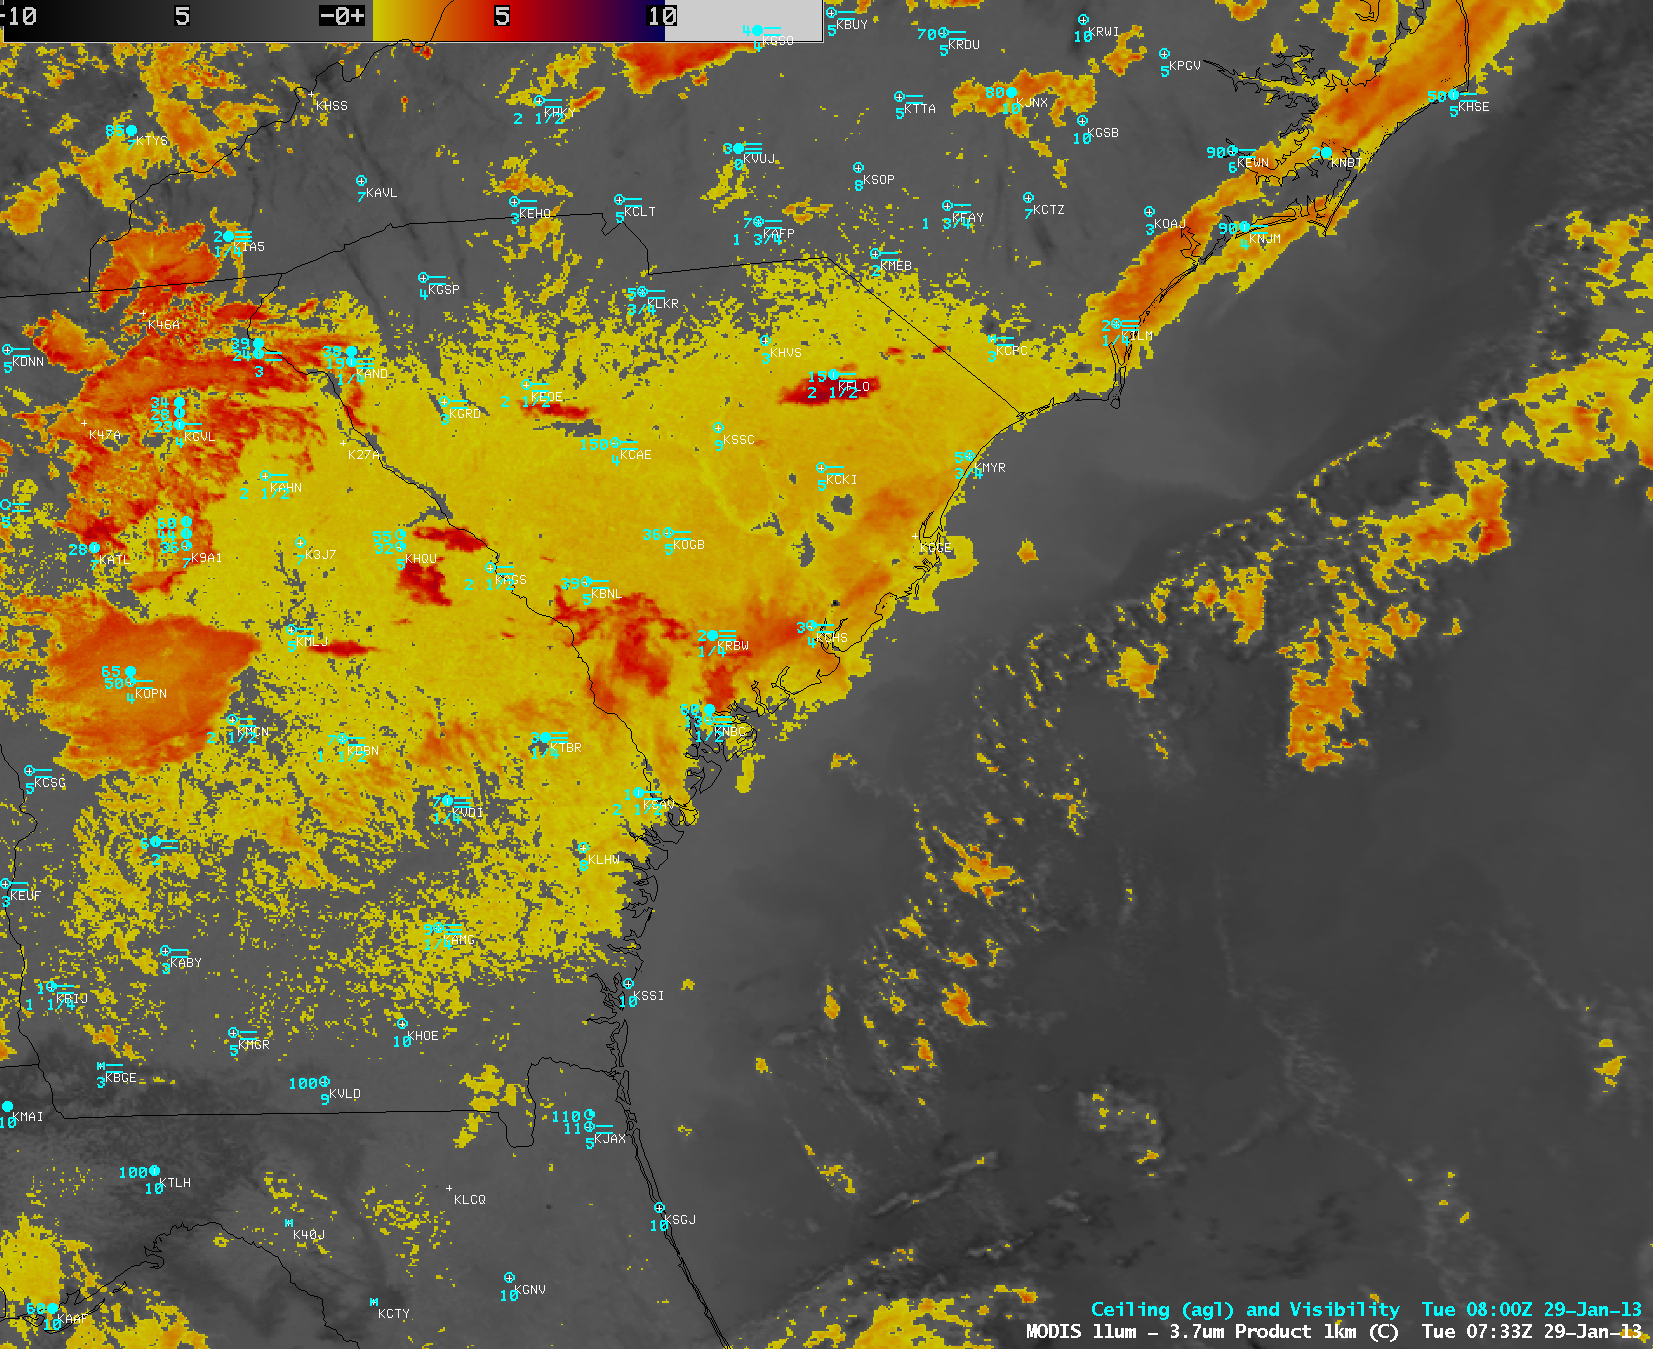
MODIS 11.0-3.7 µm IR brightness temperature difference “fog/stratus product”
An AWIPS image of the MODIS 11.0-3.7 µm IR brightness temperature difference “fog/stratus product” (above) indicated that fog/stratus features were in place across parts of the Southeast US, as well as along and just off the coast of Georgia, South Carolina, and North Carolina at 07:33 UTC or 2:33 AM local time on 29 January 2013.
The GOES-13 Instrument Flight Rules (IFR) Probability product (below; click image to play animation) showed very high probabilities of IFR conditions at many inland locations, but also suggested that the fog/stratus features were extending much farther off the coast.

GOES-13 IFR Probability product (click image to play animation)
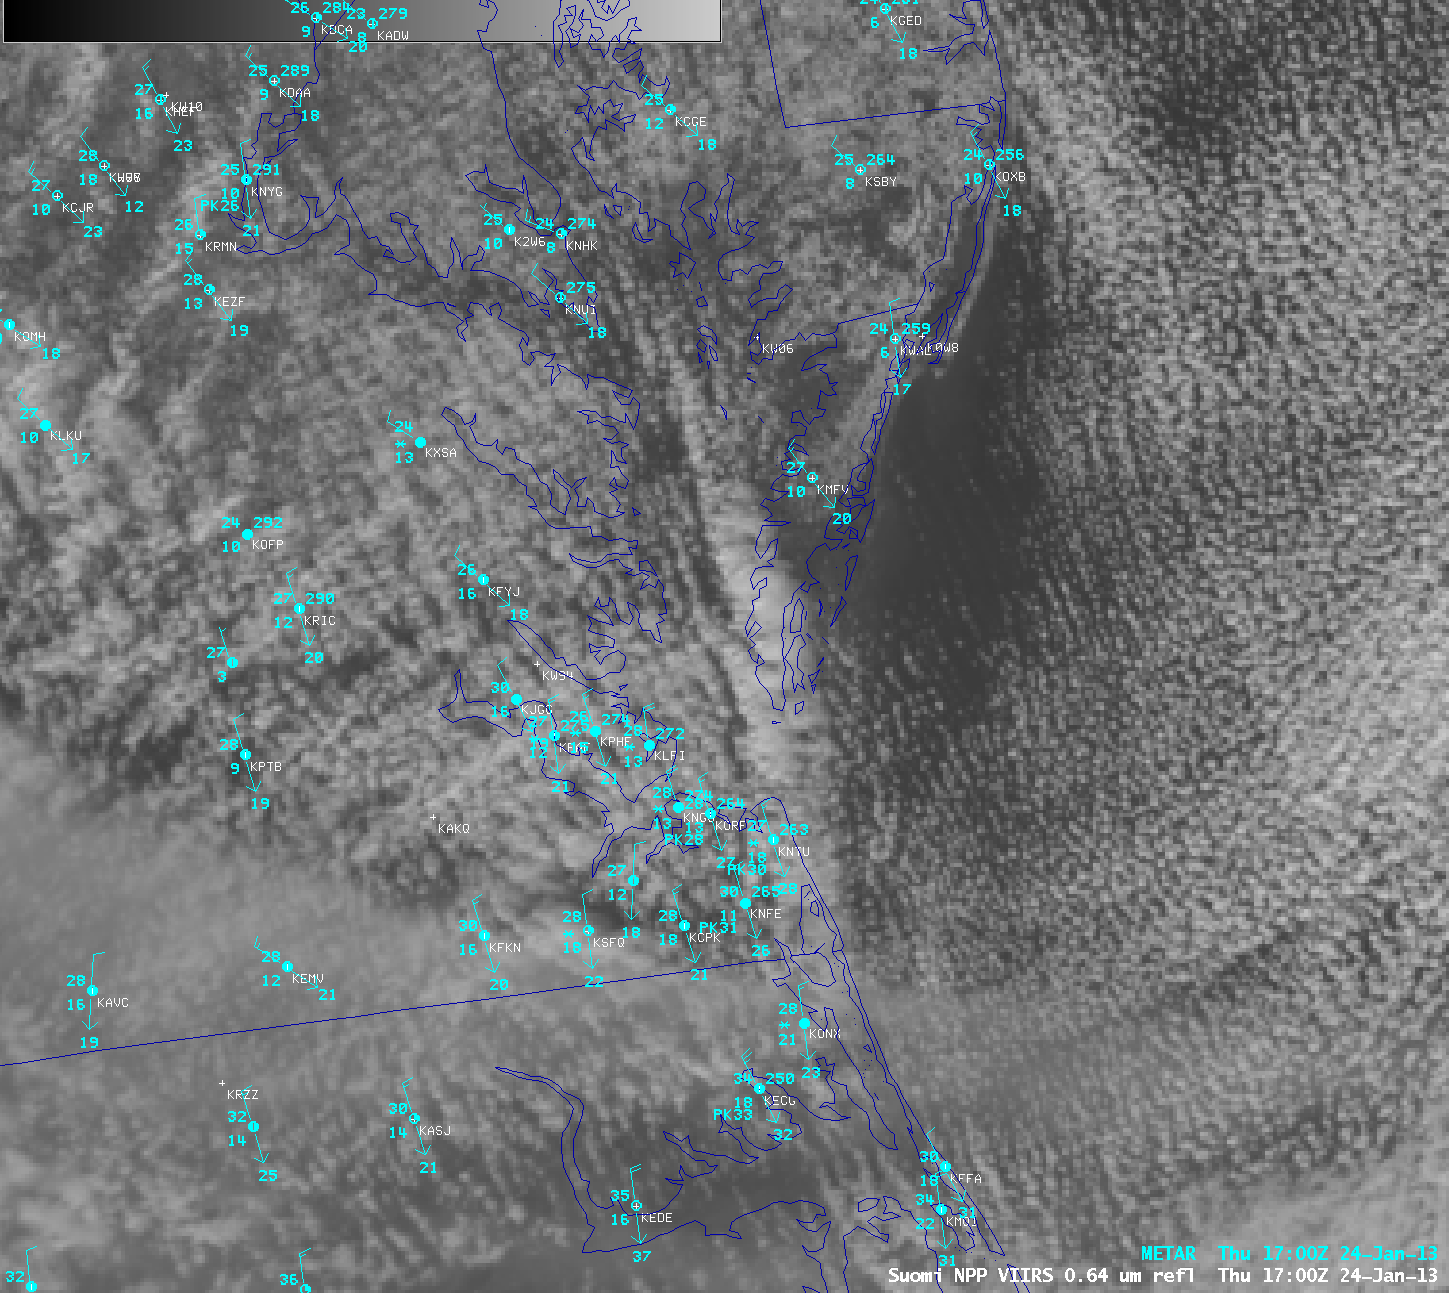
During the daylight hours, McIDAS images of GOES-13 0.63 µm visible channel data (below; click image to play animation) showed that the near-shore sea fog did indeed persist for much of the day, especially off much of the Georgia and South Carolina coastlines.
GOES-13 0.63 µm visible channel images (click image to play animation)
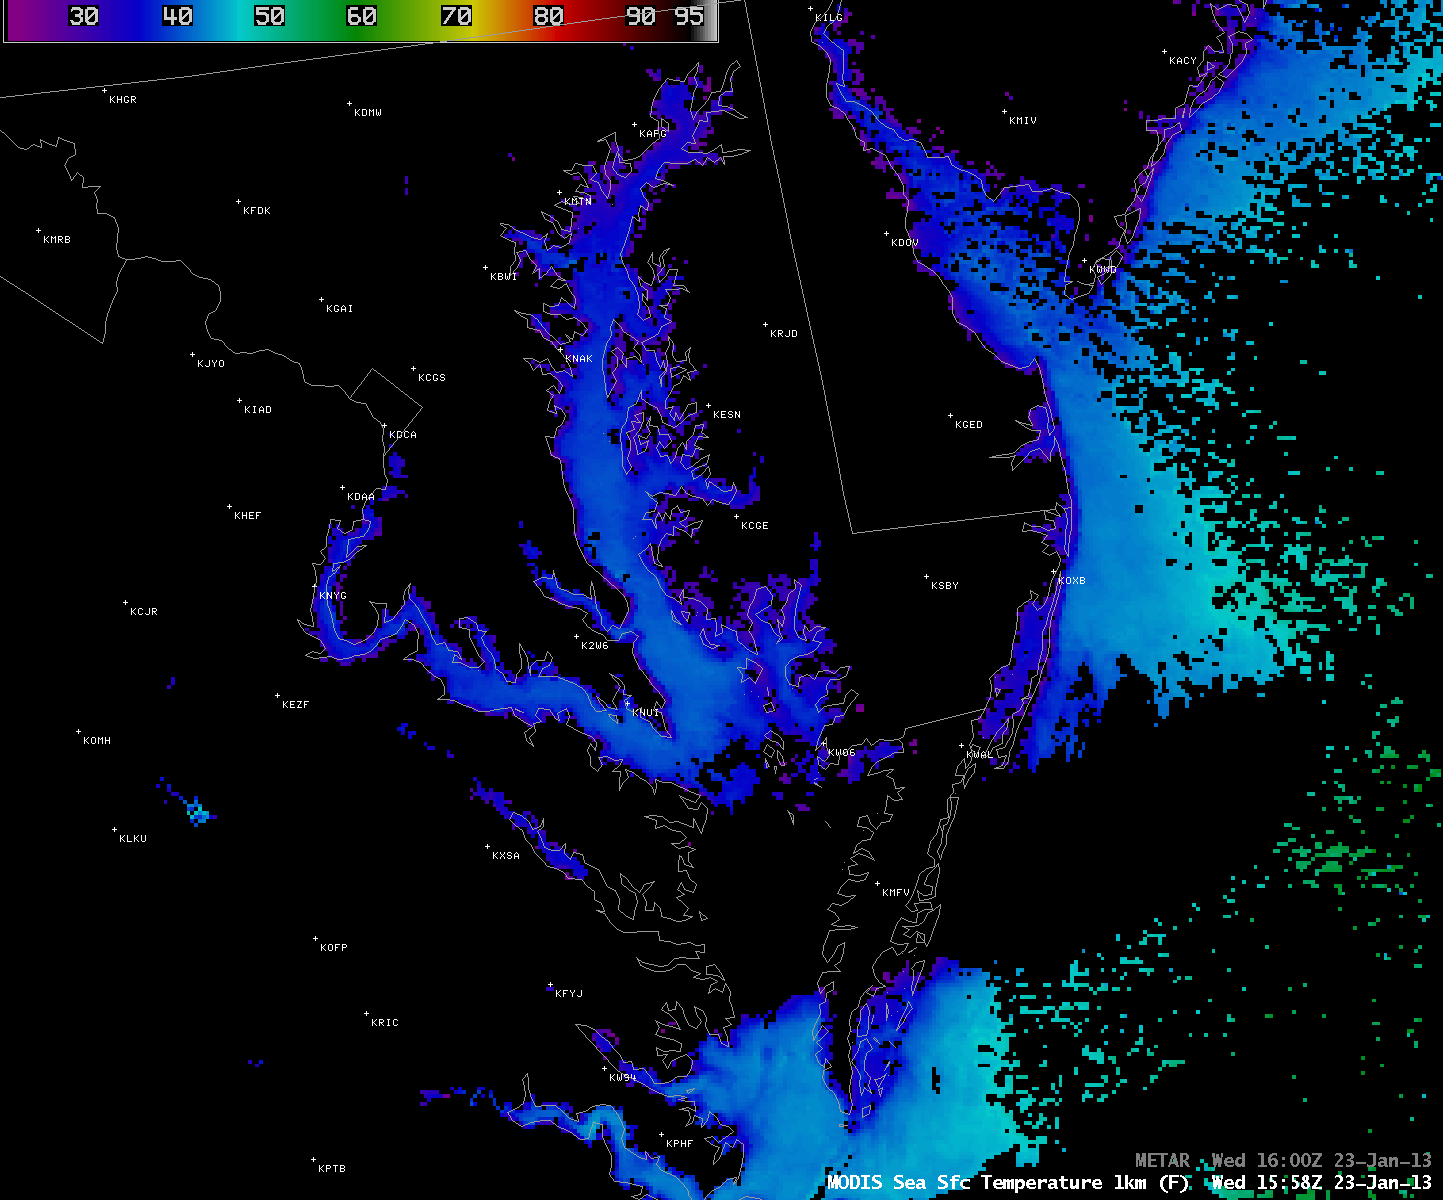
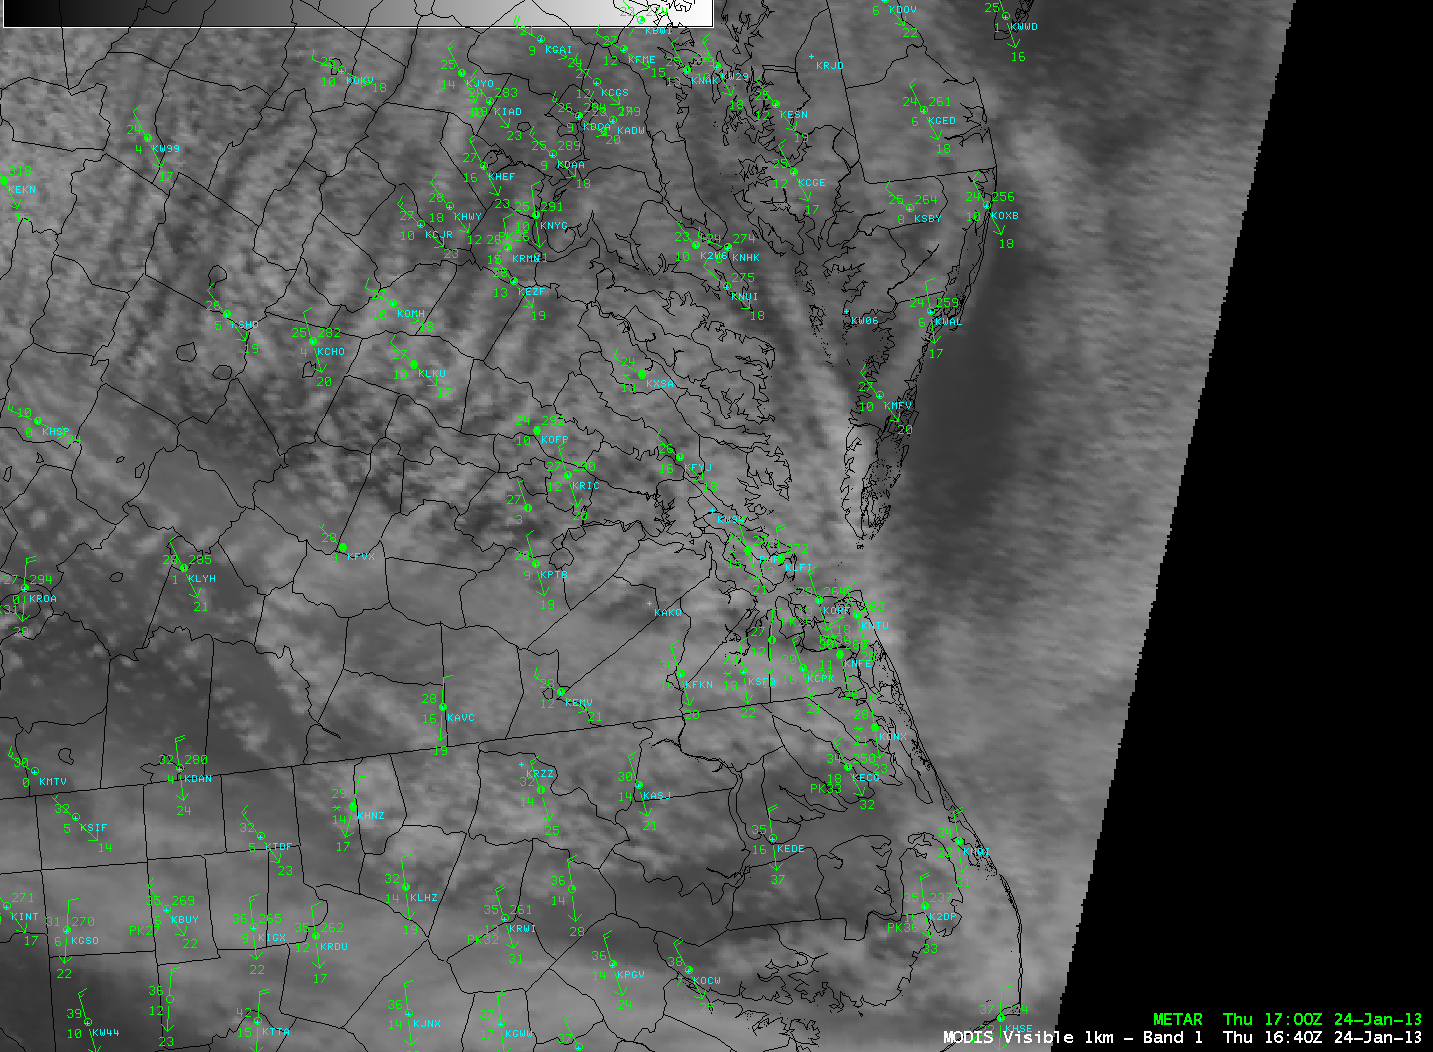
A comparison of the MODIS 0.65 µm visible channel image and the corresponding MODIS Sea Surface Temperature (SST) product at 18:40 UTC or 1:40 PM local time (below) showed the reason for the persistent sea fog: there was an onshore flow of air with dew points in the lower to middle 60s F, moving over the cooler near-shore waters with SST values in the lower to middle 50s F.
MODIS 0.65 µm visible channel image + MODIS Sea Surface Temperature product
View only this post Read Less


