This website works best with a newer web browser such as Chrome, Firefox, Safari or Microsoft
Edge. Internet Explorer is not supported by this website.
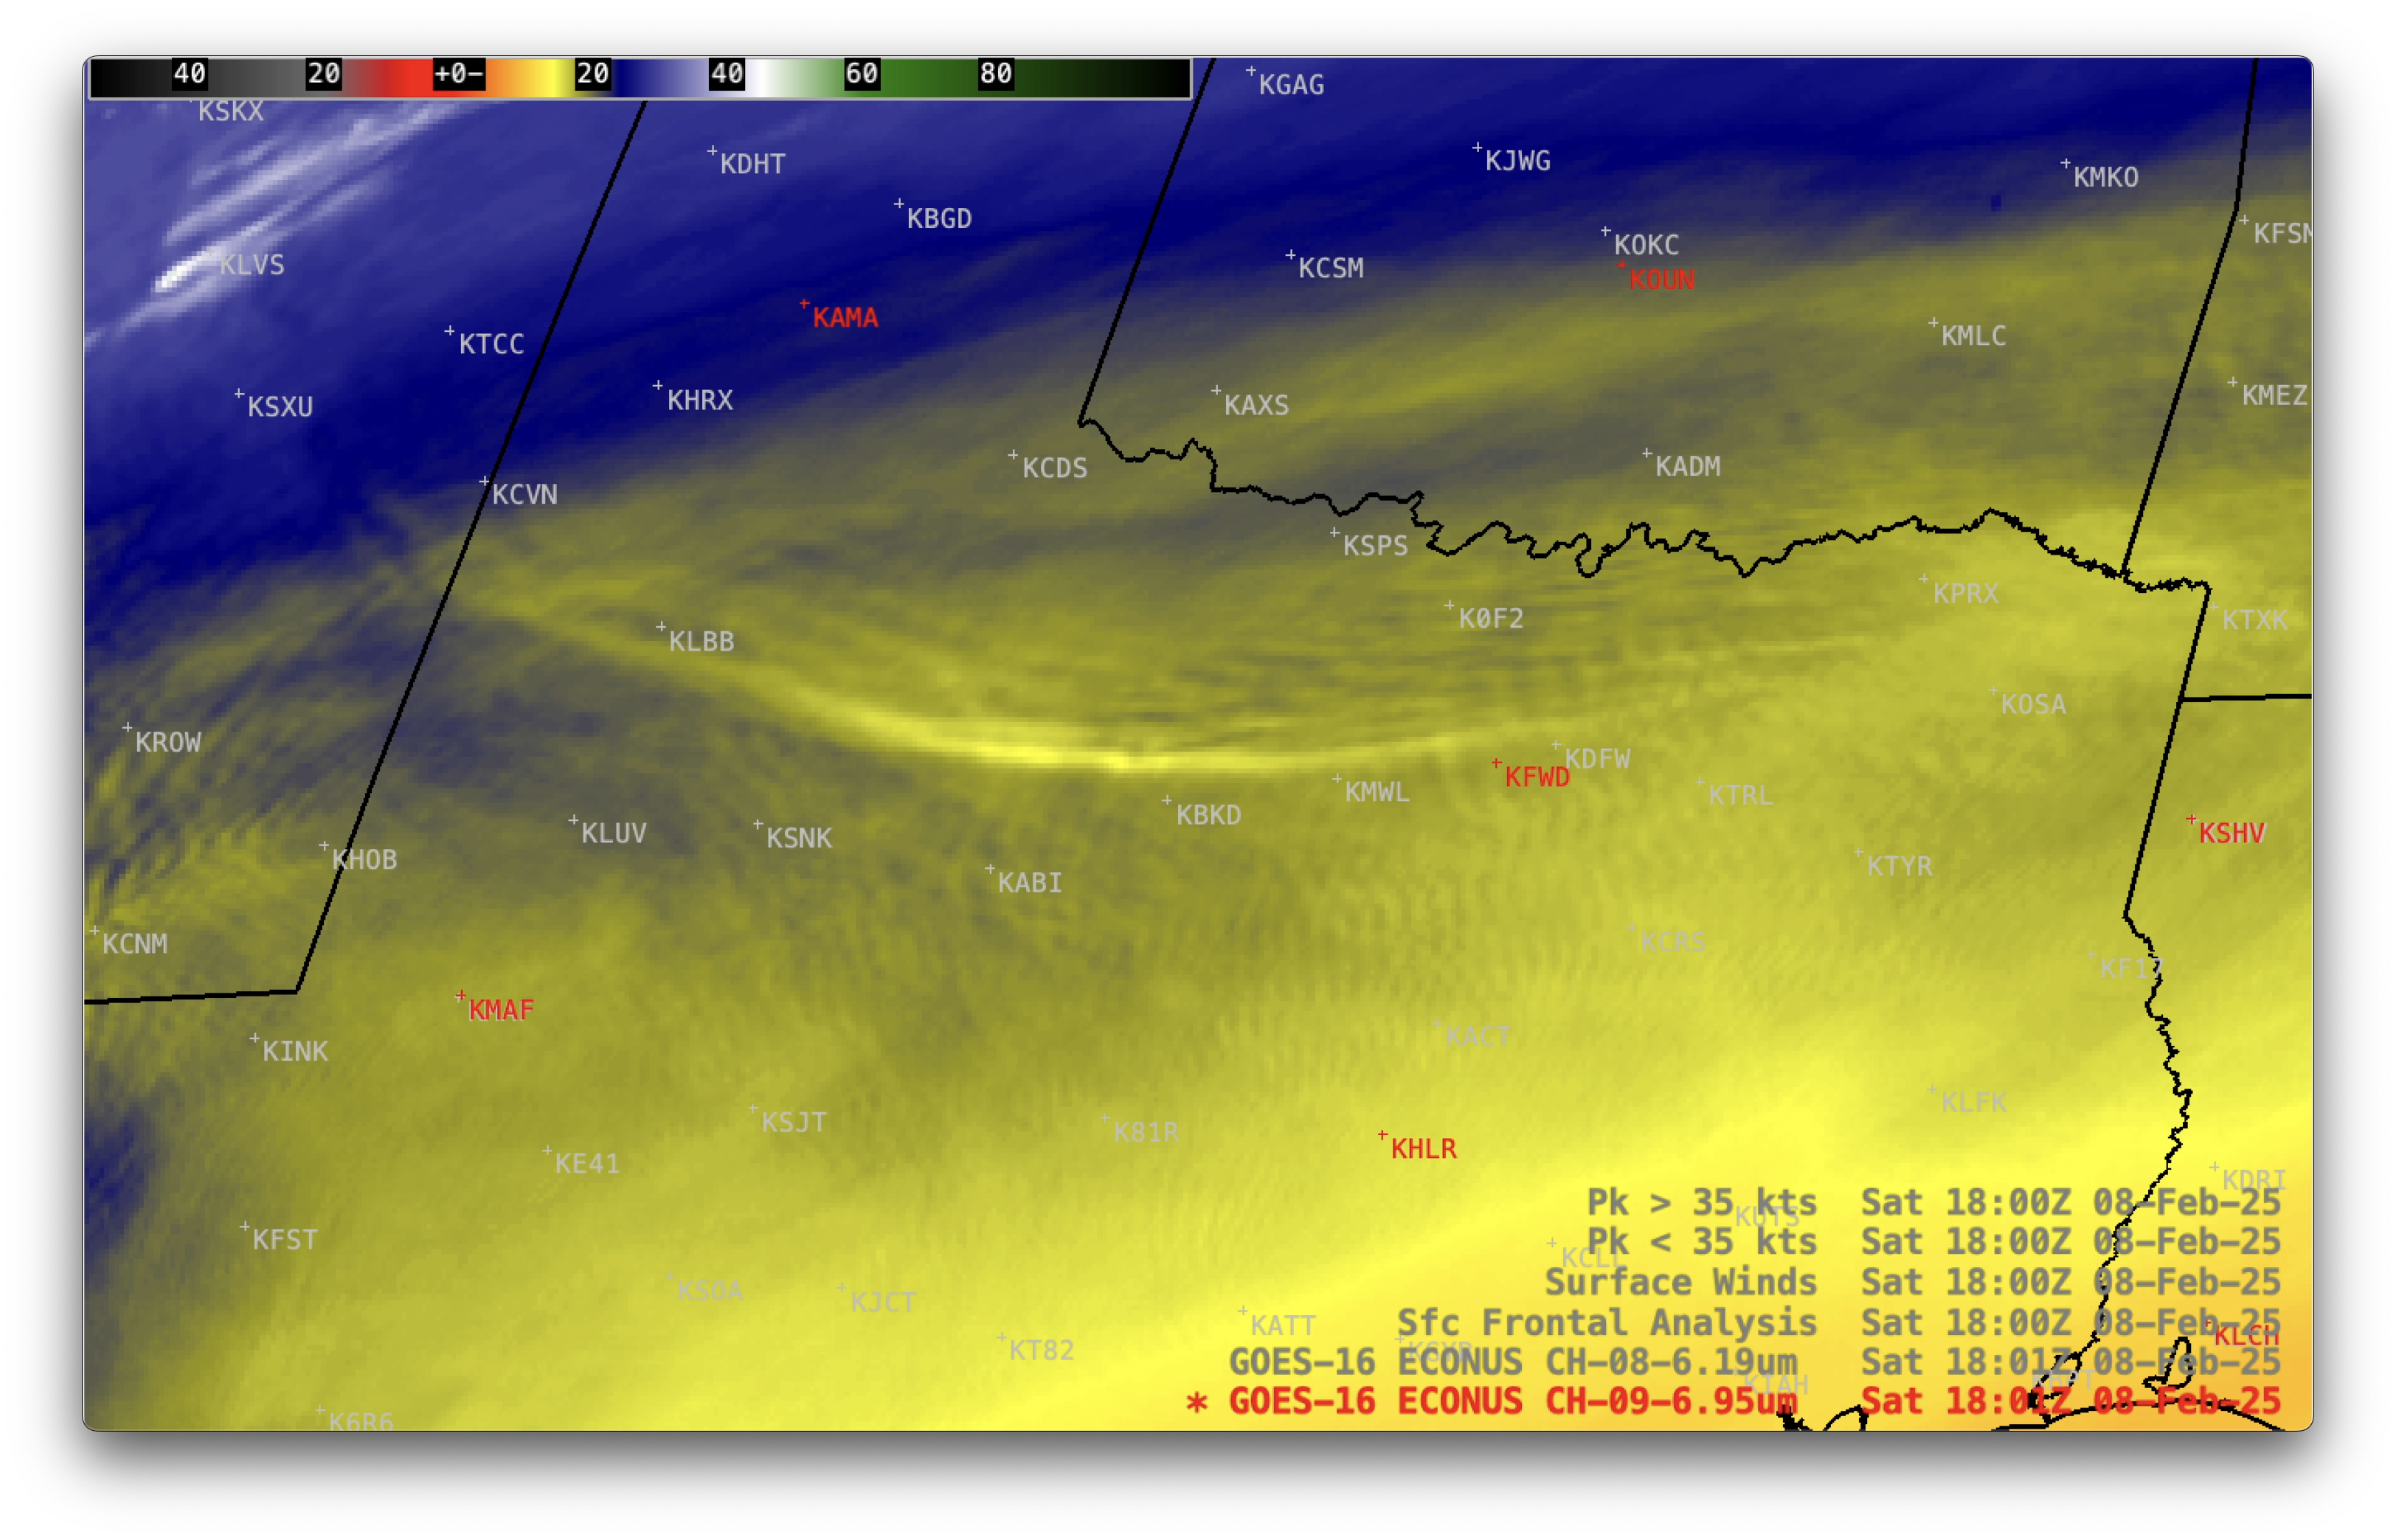
GOES-16 (GOES-East) Upper-level Water Vapor (6.2 µm) and Mid-level Water Vapor (6.9 µm) images (above) displayed leeside cold frontal gravity waves (reference) as they propagated southward across Oklahoma, Texas and far eastern New Mexico on 8th February 2025.In a corresponding animation that included plots of surface wind barbs, peak wind gusts and... Read More
GOES-16 Upper-level Water Vapor (6.2 µm) and Mid-level Water Vapor (6.9 µm) images, from 1511 UTC on 8th February to 0001 UTC on 9th February; rawinsonde sites are plotted in red [click to play MP4 animation]
GOES-16 (GOES-East) Upper-level Water Vapor (6.2 µm) and Mid-level Water Vapor (6.9 µm) images (above) displayed leeside cold frontal gravity waves (reference) as they propagated southward across Oklahoma, Texas and far eastern New Mexico on 8th February 2025.
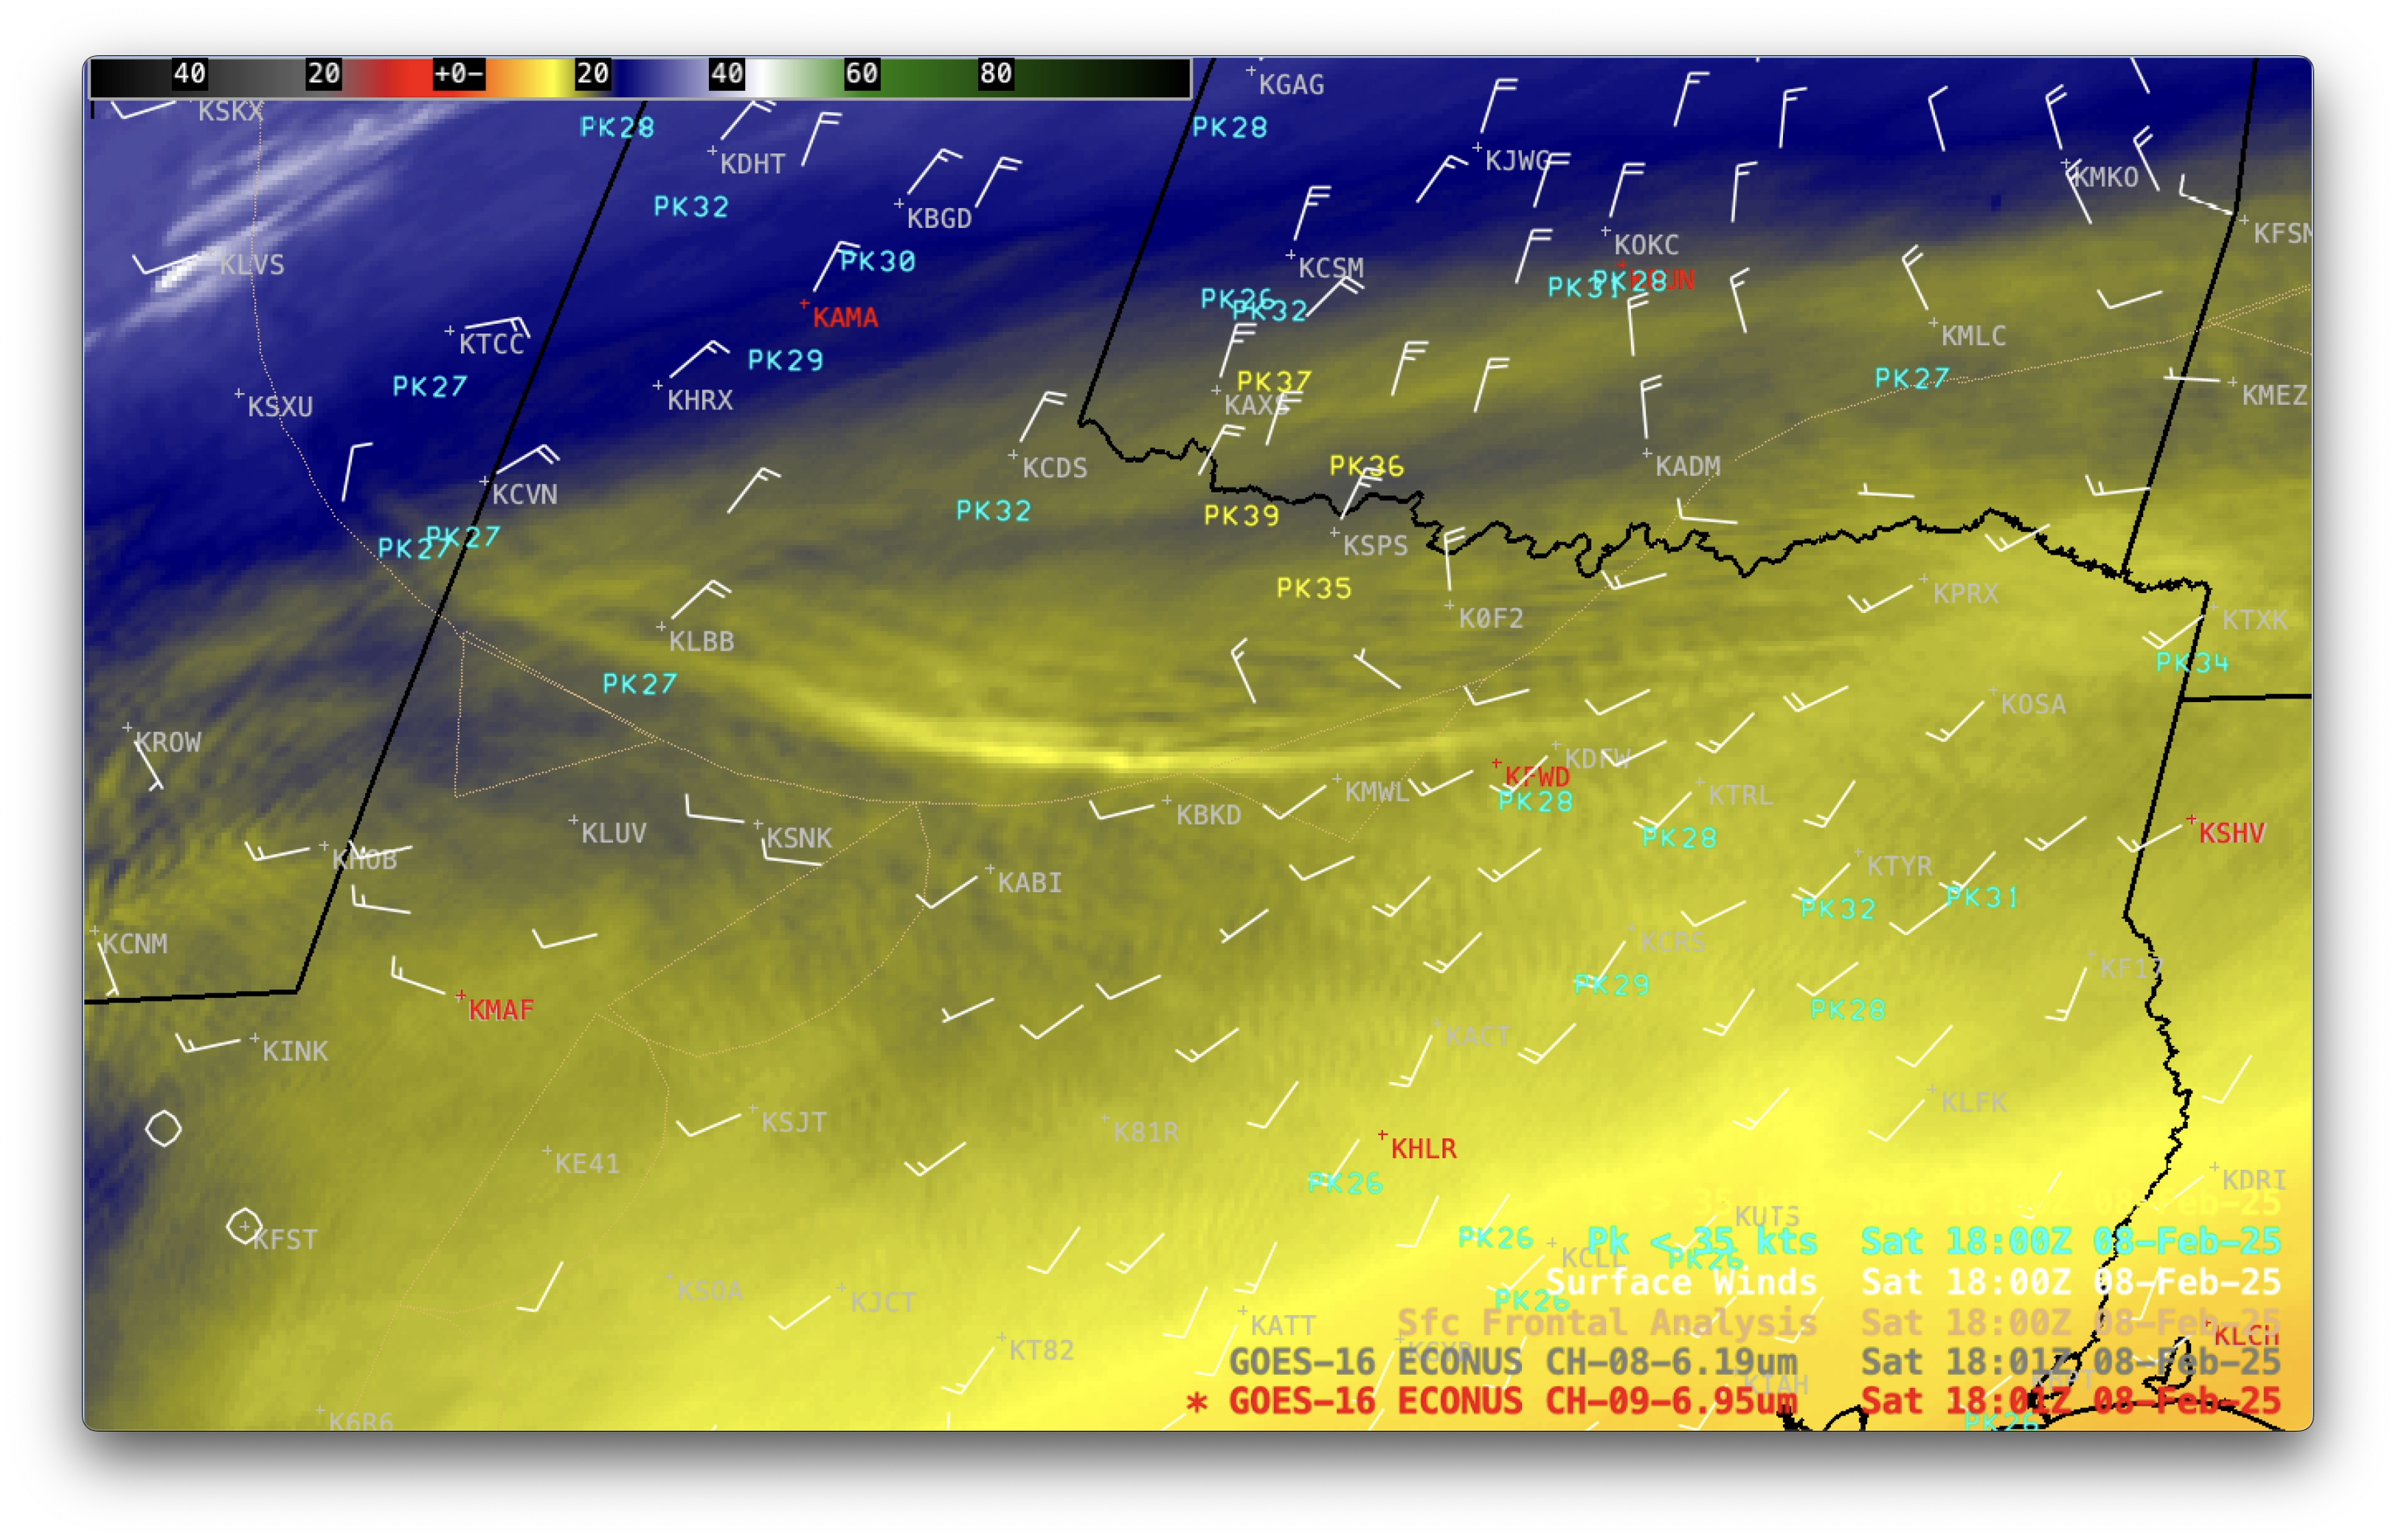
In a corresponding animation that included plots of surface wind barbs, peak wind gusts and frontal analyses (below), it could be seen that the gravity waves were generally present along or just behind the western portion of the surface cold front — while farther to the east, the gravity waves advanced ahead of the cold front.
GOES-16 Upper-level Water Vapor (6.2 µm) and Mid-level Water Vapor (6.9 µm) images, with plots of hourly surface wind barbs (white), 30-minute peak wind gusts (cyan/yellow) and 3-hourly surface front analyses (beige) from 1511 UTC on 8th February to 0001 UTC on 9th February [click to play MP4 animation]
Plots of GOES-16 Water Vapor (6.2 µm / Band 08 and 6.9 µm / Band 09) Weighting Functions derived using rawinsonde data from Fort Worth, Texas (KFWD) (below) indicated that the peak contribution of upwelling radiation for both spectral bands was originating from the middle troposphere (at pressure levels of 516-460 hPa) — with no contributions from the surface.
Plots of GOES-16 Water Vapor (6.2 µm / Band 08 and 6.9 µm / Band 09) Weighting Functions, derived using rawinsonde data from Fort Worth TX at 1200 UTC on 8th February and 0000 UTC on 9th February [click to enlarge]
———
GOES-19 Upper-level Water Vapor (6.2 µm) images, with plots of hourly surface wind barbs (red) and gusts (gray/orange/red), from 1401-2331 UTC on 8th February [click to play animated GIF | MP4]
The leeside cold frontal gravity waves were also apparent in GOES-19 (Preliminary/Non-operational) Upper-level Water Vapor (above) and Mid-level Water Vapor images (below).
GOES-19 Mid-level Water Vapor (6.9 µm) images, with plots of hourly surface wind barbs (red) and gusts (gray/orange/red), from 1401-2331 UTC on 8th February [click to play animated GIF | MP4]
10-minute JMA Himawari-9 AHI “Red” Visible (0.64 µm), Shortwave Infrared (3.9 µm) and “Clean” Infrared Window (10.4 µm) images (above) showed the formation of a pyrocumulonimbus (pyroCb) cloud that was spawned by a bushfire in Grampians National Park in far southeast Australia on 4th February 2025. The pyroCb exhibited cloud-top 10.4 µm... Read More
JMA Himawari-9 “Red” Visible (0.64 µm, top), Shortwave Infrared (3.9 µm, center) and “Clean” Infrared Window (10.4 µm, bottom) images from 0300-0510 UTC on 4th February, with plots of surface reports at Melbourne YMML [click to play animated GIF | MP4]
10-minute JMA Himawari-9 AHI “Red” Visible (0.64 µm), Shortwave Infrared (3.9 µm) and “Clean” Infrared Window (10.4 µm) images (above) showed the formation of a pyrocumulonimbus (pyroCb) cloud that was spawned by a bushfire in Grampians National Park in far southeast Australia on 4th February 2025. The pyroCb exhibited cloud-top 10.4 µm infrared brightness temperatures (IRBTs) in the -40s C (denoted by shades of blue to cyan), attaining a minimum IRBT of -49.9º C at 0430 UTC. This temperature roughly corresponded to an altitude around 11 km — not far below the tropopause — according to rawinsonde data from Melbourne: (plot | text). The pyroCb cloud drifted southeast, eventually passing just south of Melbourne Airport (YMML).
Himawari-9 True Color RGB images created using Geo2Grid(below) displayed the pyroCb cloud that was being transported southeastward — and dense smoke (shades of tan) was evident in the vicinity (and immediately downwind) of the Grampians bushfire.
JMA Himawari-9 True Color RGB images, from 0250-0600 UTC on 4th February [click to play animated GIF | MP4]
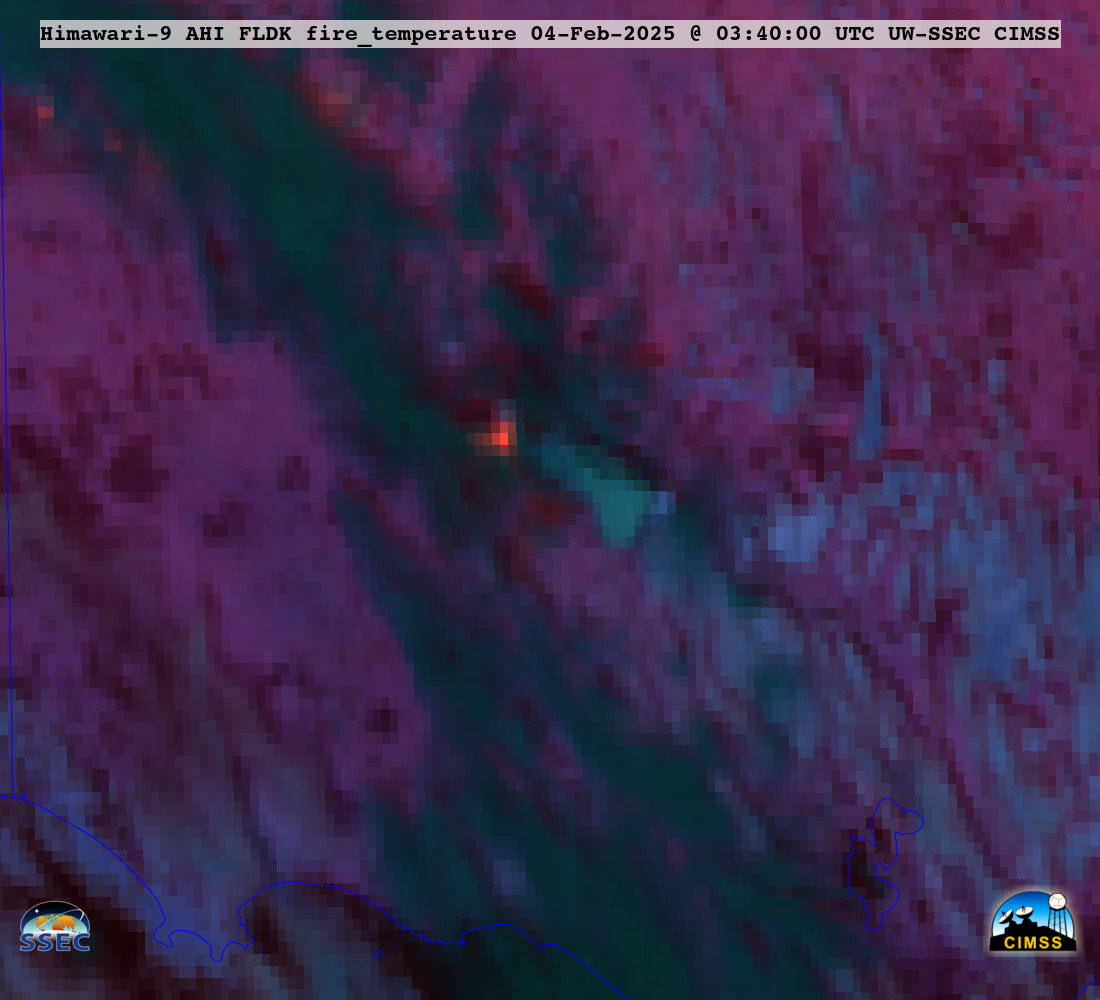
As a surface trough of low pressure was moving east-northeastward across the state of Victoria during that time period (surface analyses), strong southerly winds behind the trough axis (surface observations at Melbourne) helped to intensify the Grampians fire complex — and the pyroCb cloud developed just after the trough passed through the area. Himawari-9 Fire Temperature RGB images (below) revealed (1) the northward expansion of the Grampians bushfire following the ~0300 UTC trough passage (along with flare-up of new fires to the NW), and (2) the pyroCb formation just after the time of the trough passage (0340 UTC image). Note that in the Himawari-9 True Color RGB images shown above, the trough passage also initiated a northward transport of boundary layer smoke from the bushfire source region.
Himawari-9 Fire Temperature RGB images, from 2100 UTC on 3rd February to 1100 UTC on 4th February [click to play animated GIF | MP4]
There are a number of online resources to better understand what the weather is going to be like at a given place and time. What resources to look at will depend on the location and length of the forecast ahead of time. For example, if the date is too far in the future, then climatology may be the best tool, while satellite imagery may be the best for a short-term cloud cover “nowcast”.
GOES-16 ABI animation over southern Wisconsin.
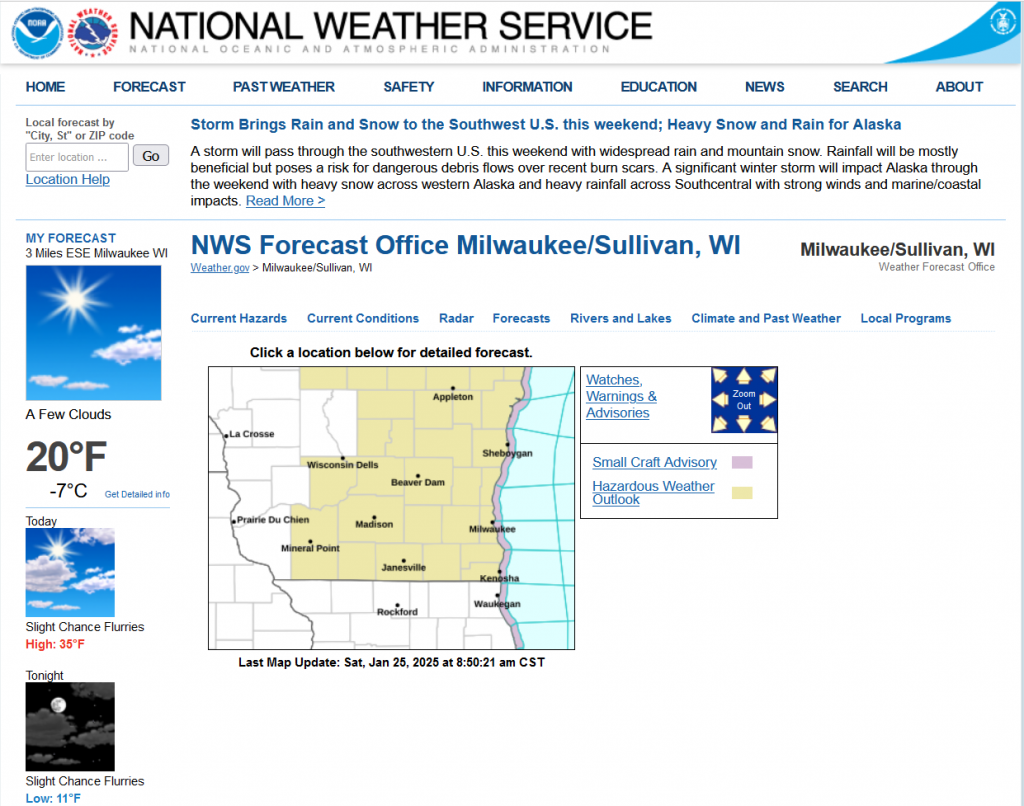
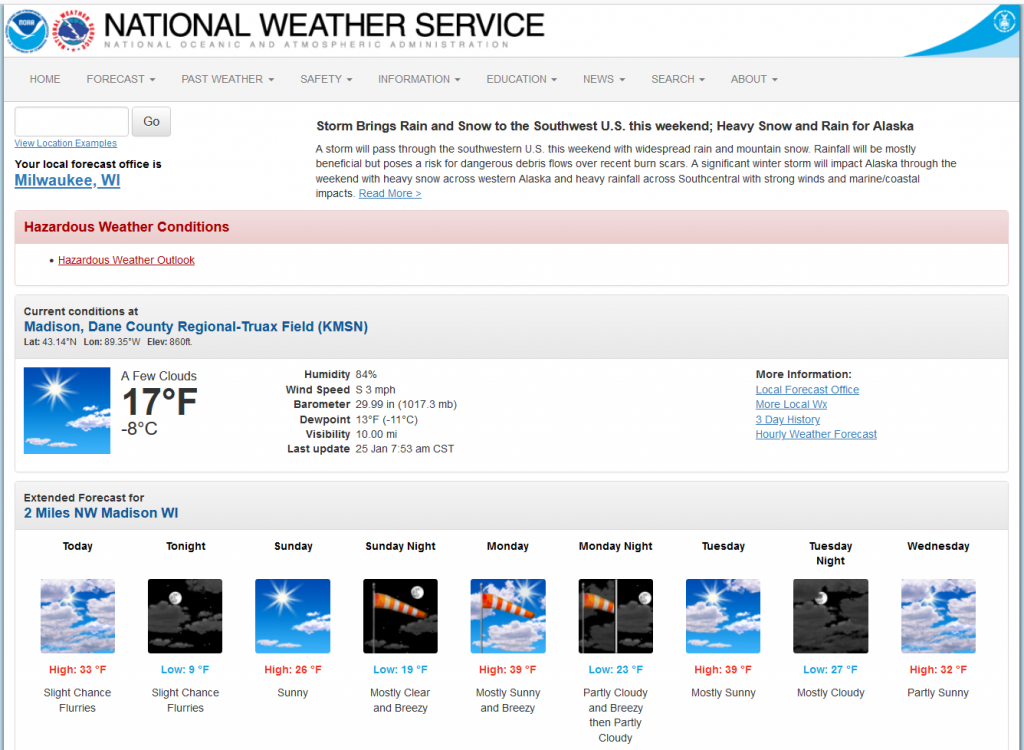
The best place to start might be your local NOAA NWS Weather Forecast Office web page (eg, MKX), reachable via a national map.
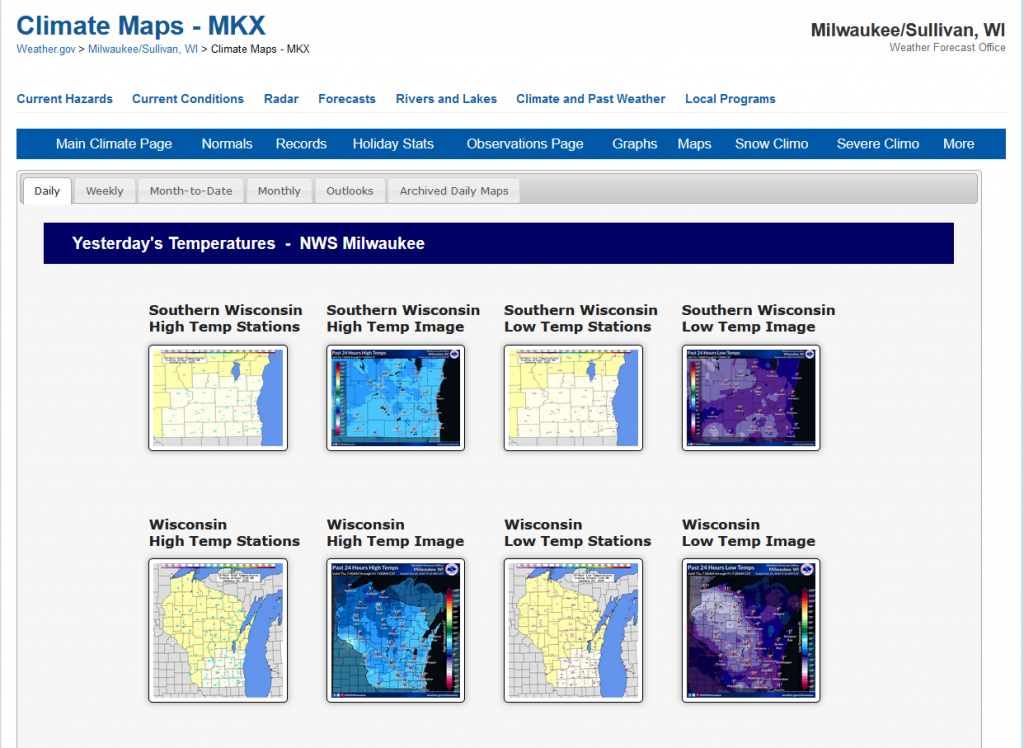
A screen shot of the top part of the MKX Weather Forecast Office web page.
Climatology
Years or Months before the event one is interested in, climatology shows what has happened on this date in the past. It’s best to look at not only the averages (for temperatures and precipitation), but also the extremes. Click on “Climate Graphs”. Or visit the CPC page.
MKX’s Climate Page
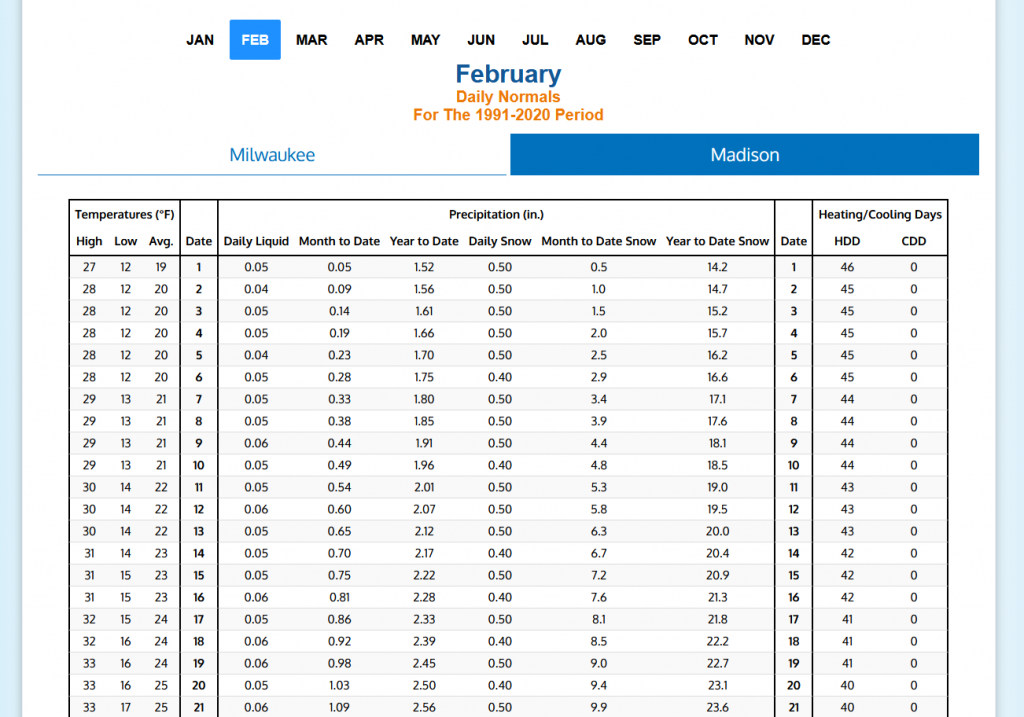
Click on “Normals” or “Records”, then chose the City and month of interest.
Madison’s Climate averages for early February. Madison’s Climate records for early February.
Long-term Outlooks
There are a number of longer-term outlooks for temperature and precipitation, including 3 months ahead of time, as was as weeks ahead of time. Start by clicking the “Outlooks” tab.
Example of a seasonal (precipitation) forecast. An example of a monthly (temperature) outlook. An example of a 6-10 day (temperature) outlook.
Within a Week
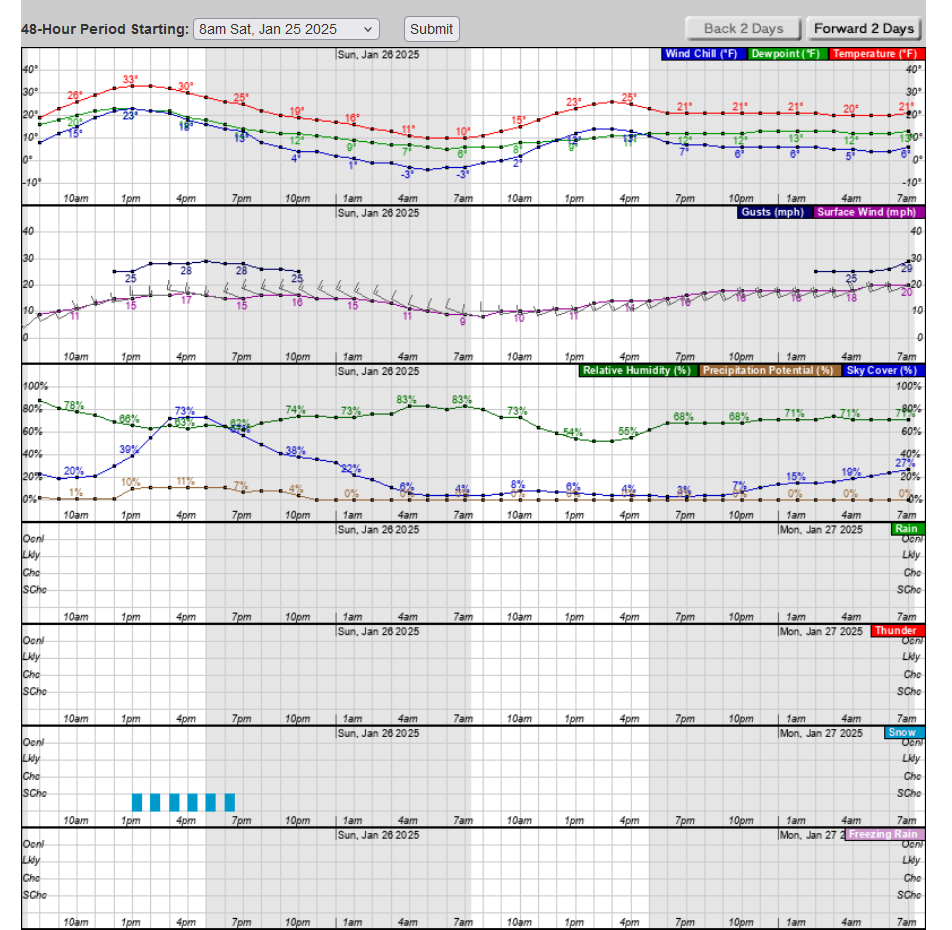
A week ahead of a given event is covered by global forecast models. These models leverage many observations, including satellite observations. A few days ahead of a given event is covered by regional forecast models. These models leverage many observations, including satellite observations. In fact, satellites are the backbone of NWP observations. Guidance from both of these can be found on the WFO home page, or the hourly-weather graph.
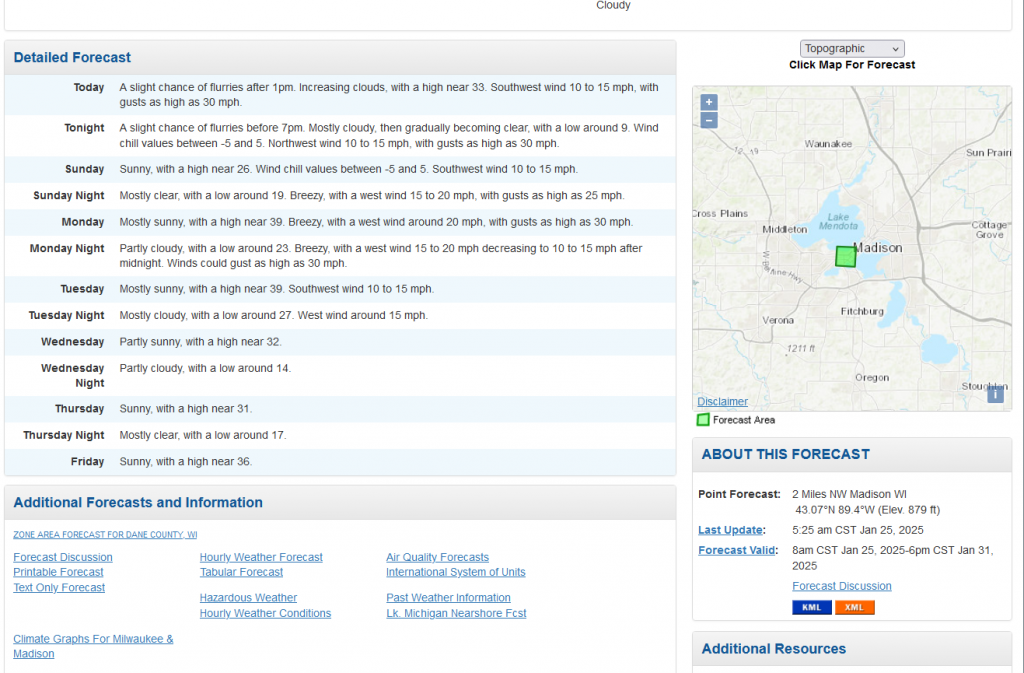
The top part of the WFO MKX page, with current conditions and the forecasts. A more detailed forecast, including the location the forecast is valid at. An example of the hourly weather graph, which includes many parameters.
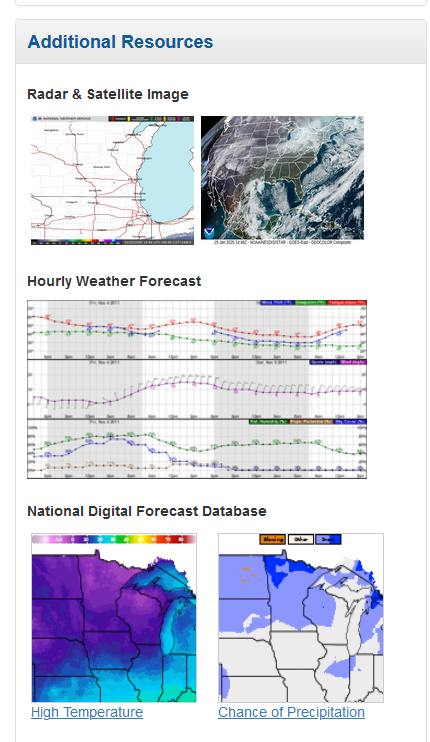
The closer to the time of the event, the more one can view current weather, including satellite images. This includes integrated products like the research probability of severe weather or lightning, fires products.
LightningCast over a GOES-16 RGB composite imagery for July 16, 2024. (‘Click to Play”)
While “looking out the window” is good advice, even better might be to go outside and check. Of course the weather can change quickly, so keep an eye on rapidly changing conditions. One can also check out a number of roof top cameras, for example those at UW/SSEC and AOS.
The past few days have brought devastating rain and flooding to the Australian state of Queensland, in the country’s northeast. The community of Paluma received more than 1.4 meters (4.5 feet) of rain over the weekend, and damage to roads and bridges carried out by the torrents of water have... Read More
The past few days have brought devastating rain and flooding to the Australian state of Queensland, in the country’s northeast. The community of Paluma received more than 1.4 meters (4.5 feet) of rain over the weekend, and damage to roads and bridges carried out by the torrents of water have effectively cut off parts of northern Queensland from the rest of the country. Thousands of residents have been told to evacuate While the rains have started to abate, the damage will be felt for many months.
The Blended Total Precipitable Water (TPW) product provides a quantitative assessment of just how much water was present in the atmosphere. TPW is measured with microwave instruments, and thus can be measured even in the presence of clouds. However, microwave sounders are only found on polar-orbiting satellites which means that a particular location is going to be observed by several different satellites over the course of a day. Satellites from NOAA, NASA, the US Department of Defense, EUMATSAT, and others all are making TPW observations operationally. The Blended TWP product corrects across all of these instruments with their unique traits to create a globally continuous product that updates at a temporal resolution that is far finer than can be addressed by a single satellite.
This Blended TPW loop shows the evolution of the TPW from 0300 UTC to 1700 UTC on 31 January 2025. It is clear that northeastern Australia is beset with moisture-laden air, as TPW values are easily over 70 mm.
The MIMIC-TPW2 hourly composite product is created from retrievals using AMSU-B and MSU onboard NOAA-18, NOAA-19, Metop-A and Metop-B; it also uses retrievals from ATMS onboard the Suomi-NPP, NOAA-20 and NOAA-21 polar orbiting satellites. In a 3-day animation of MIMIC-TPW2 (below), a cyclonic gyre of high TPW (with values often exceeding 70 mm, denoted by lighter shades of violet) is evident in the vicinity of far northern Queensland.
Hourly MIMIC-TPW2 images, from 0000 UTC on 30 January to 2300 UTC on 1 February
The sounding from Willis Island, about 280 miles east of the Queensland shore in the Coral Sea, affirms how moist the air was. In effect, the atmosphere was saturated throughout the whole depth of the troposphere.
The ensuing convection was extremely vigorous, with cloud top temperatures dropping below -80 C as can be seen in the zoomed-in loop of the 10.4 micron window channel from the geostationary Himawari-9 satellite. Numerous overshooting tops are present, and given the high altitude of the tropical tropopause, those clouds are topping out at over 46,000 feet (14 km). With very little lateral propagation of these storms, it’s easy to see why the rainfalls were so substantial.
A longer animation of Himawari-9 Infrared images (below) revealed that cloud-top 10.4 µm infrared brightness temperatures were occasionally -90ºC or colder (yellow-to-gray pixels embedded within darker purple regions) — for example, near Cairns YBCS at 1030 UTC.
Himawari-9 Clean Infrared Window (10.4 µm) images, from 0000 UTC on 31 January to 0000 UTC on 1 February (courtesy Scott Bachmeier, CIMSS) [click to enlaarge]
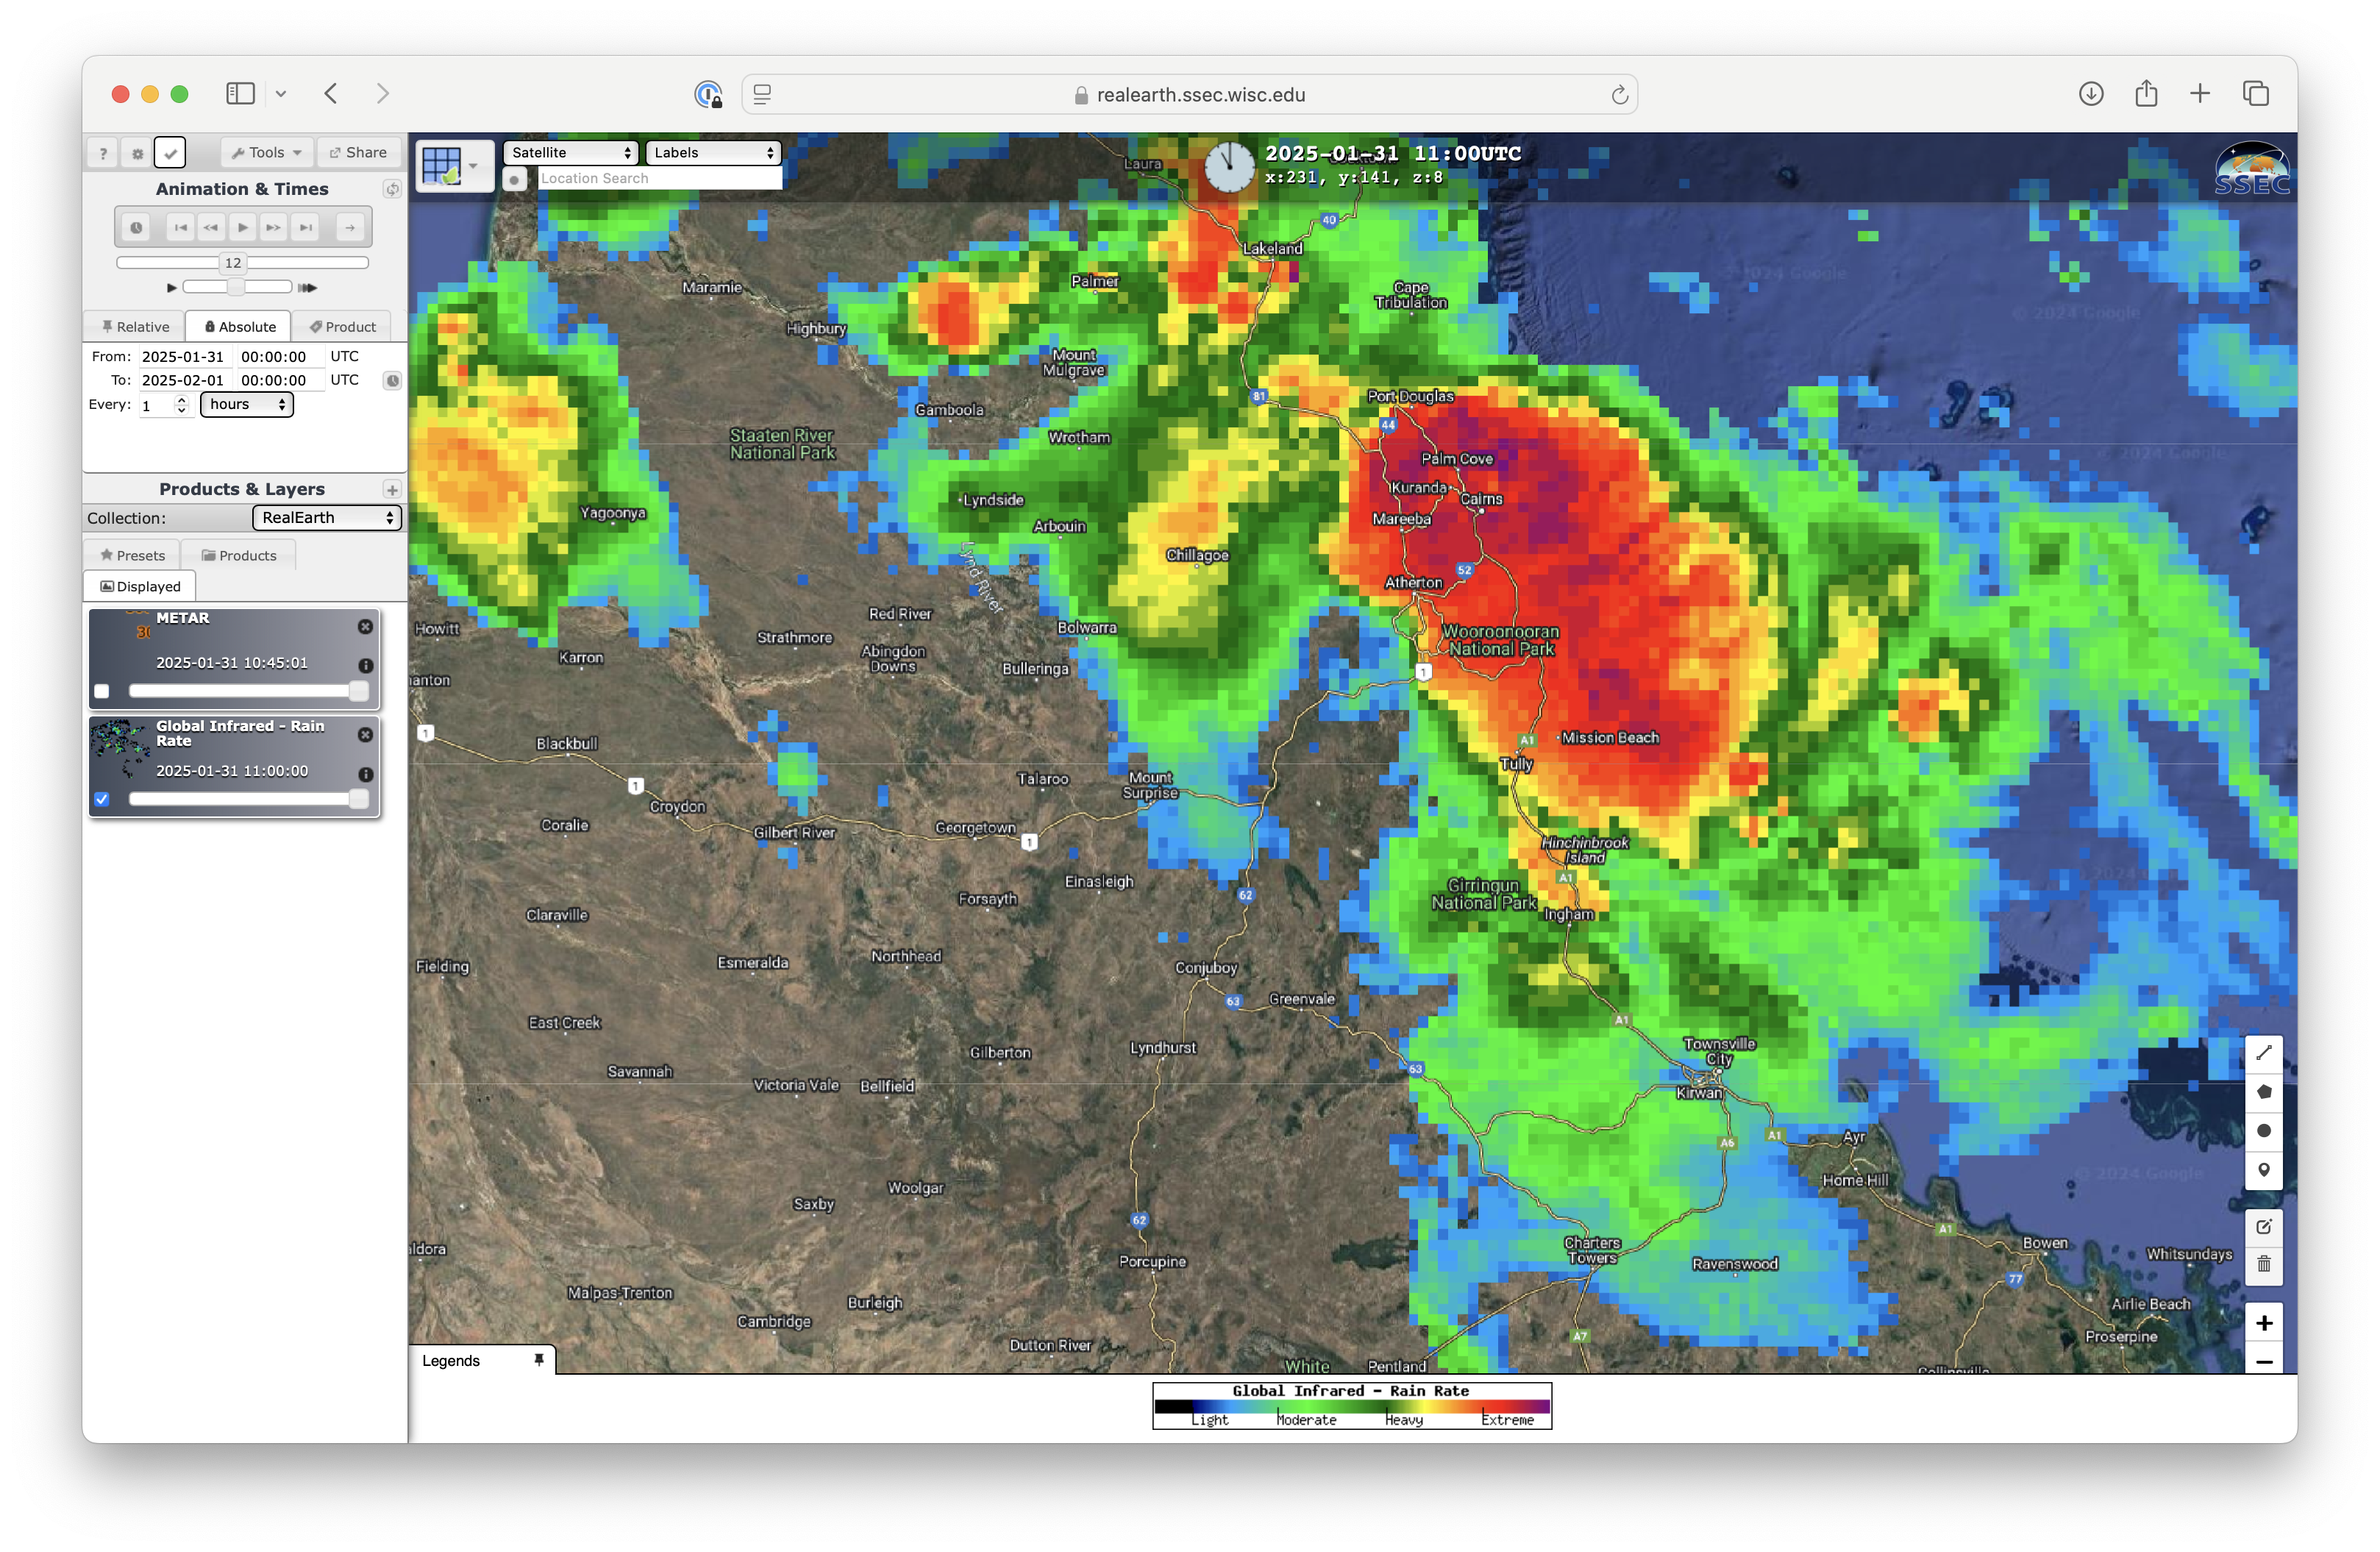
A Himawari-9 Rain Rate derived product from the RealEarth site is shown below — Extreme rates (shades of red to violet) were associated with some of the convective clusters.
Himawari-9 Rain Rate derived product, from 0000 UTC on 31 January to 0000 UTC on 1 February (courtesy Scott Bachmeier, CIMSS) [click to play MP4 animation]


