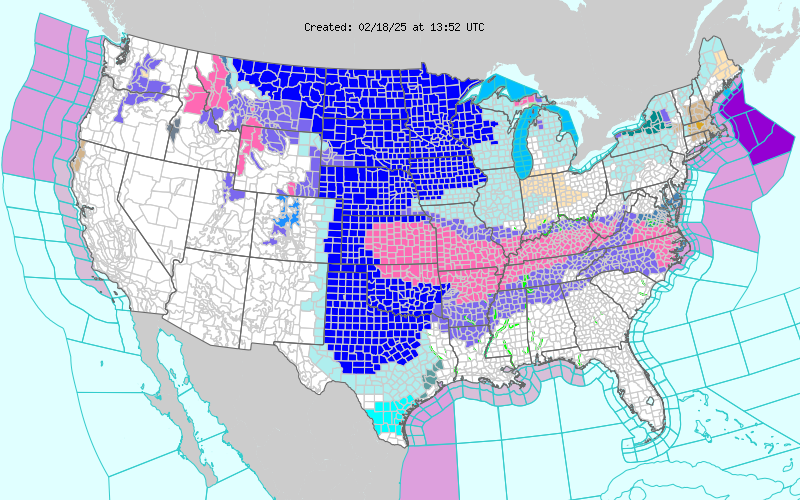
The dominant story in the continental United States on February 18 is the significant winter weather that is impacting nearly every state east of the Rocky Mountains. A glance at this morning’s National Weather Service alert map shows a continuous band of cold weather warnings from the Canadian border down to central Texas, with a fierce winter storm stretching from Kansas to the Atlantic Ocean. NWS forecasters are reporting that they are camping out in their offices in order to ensure continuity of coverage so that the public they serve can remain safe and aware of these dangerous conditions.
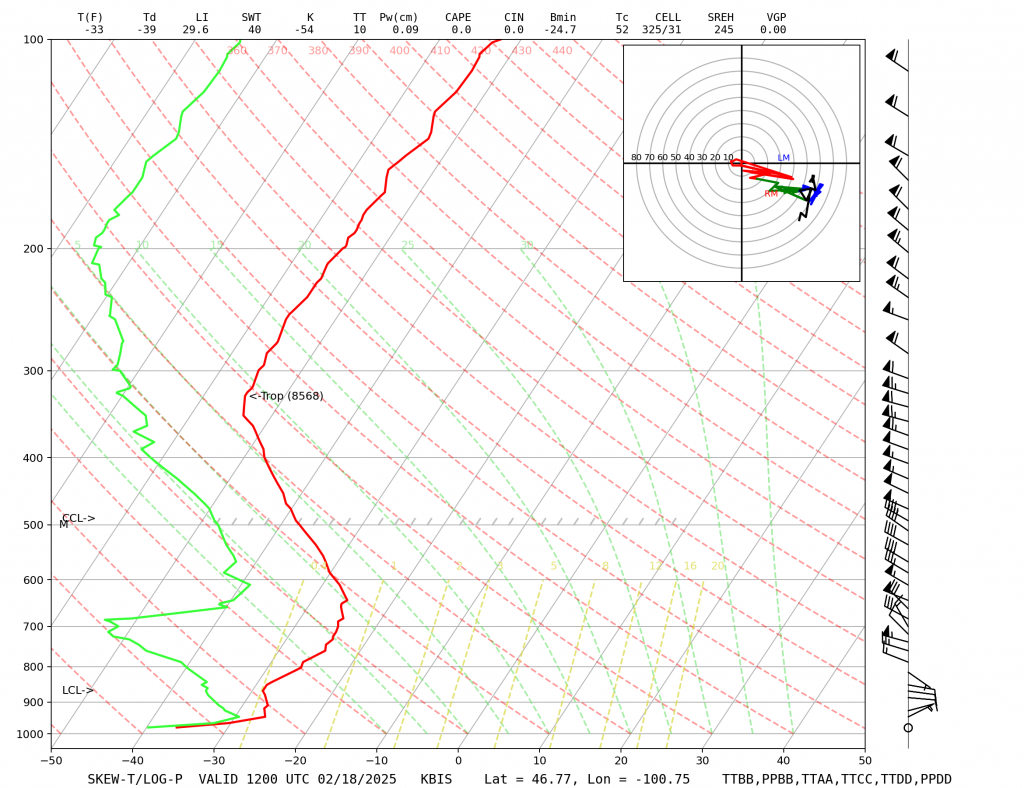
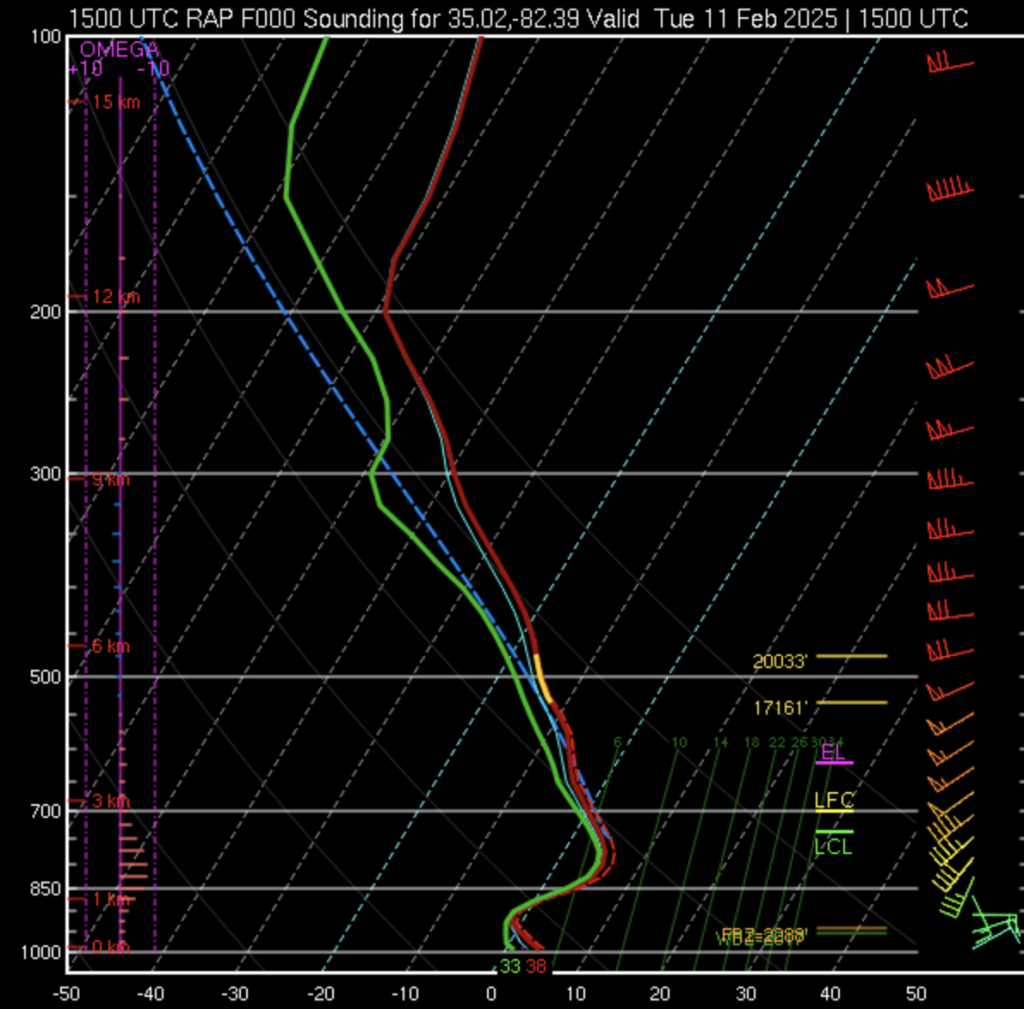
Overnight lows in the upper midwest were particularly cold, with temperatures below -30 F in parts of the Dakotas (the coldest minimum temperature was -45 F at Antelope Creek ND). These extremely cold temperatures are often associated with notable temperature inversions above the surface. As surface temperatures cool overnight, the strong infrared emissivity of snow enhances the radiative cooling. However, as air is a poor conductor of heat, temperatures aloft remain relatively unaffected. This is particularly clear in the 1200 UTC balloon launched from Bismarck, North Dakota. Note how the surface temperature (-36.3 C) is barely warmer than the temperature at 500 mb (-37.7 C). The sounding also notes that the lifting condensation level (LCL) of around 890 mb is substantially warmer than the surface.
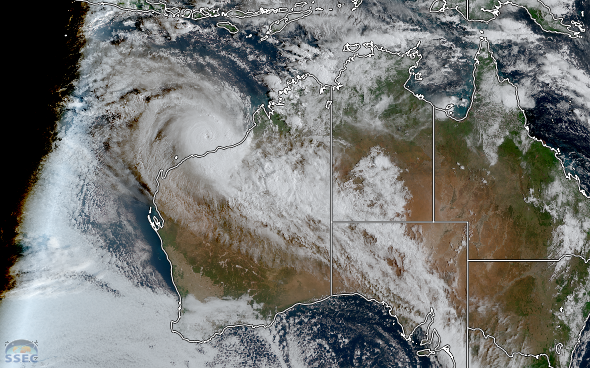
When cloud temperatures are the same or warmer than surface temperatures, it can be challenging to interpret infrared satellite imagery. For example, here is the GOES-16 ABI Band 13 image from 1150 UTC as displayed using the enhanced infrared color scale.
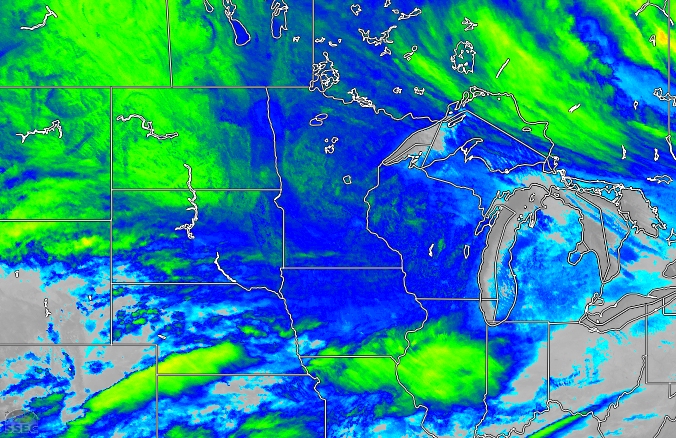
Looking at the northern shore of Michigan’s upper peninsula and the western shore of the lower peninsula, it appears that the banded structures of lake effect snows are present in the shades of blues. Therefore it is reasonable to assume that a lake effect event is ongoing in that region of the image, but given that the temperatures of the clouds are basically the same as the underlying surface, it’s not obvious. But discerning what is happening in the Dakotas and Minnesota is far more difficult. Are there large stratiform clouds present, or are the surface temperatures so cold that they have cloud-like temperatures? This is where products like the night microphysics RGB can be very useful.

Normally, the noisy orange regions seen in the upper midwest and northern great plains indicate high, thick, very cold clouds. The speckles appear when brightness temperatures are less than -30 C due to noise in the 3.9 micron channel at extreme cold temperatures. However, there are clues in here that we’re actually looking at clear skies in those orange regions. Let’s zoom in on northern Minnesota.
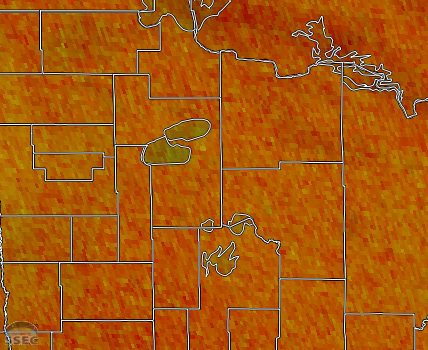
Here, it is clear that the lakes, most notably Upper and Lower Red Lake in the center of the image, are differently colored than the surrounding regions. The greener tinge is a result of reduced influence of the 12.4-10.4 micron difference and enhanced influence of the 10.4-3.9 micron difference. This likely is surface ice which means this region is clear. Therefore, the orange regions in the RGB product indicate that skies are basically clear in Minnesota and North Dakota, with some cloud coverage in southern and western South Dakota showing up as darker reds. The lake effect snows are much more clearly visible as yellow in the RGB compared to the IR image where they are basically the same temperature as the surface. Since the RBG recipe uses the 3.9 micron channel as an ingredient, this product shouldn’t be used for interpretation much after 1200 UTC this time of year as the sun is about to rise and solar reflectance at 3.9 will dominate over emission.
View only this post Read Less


