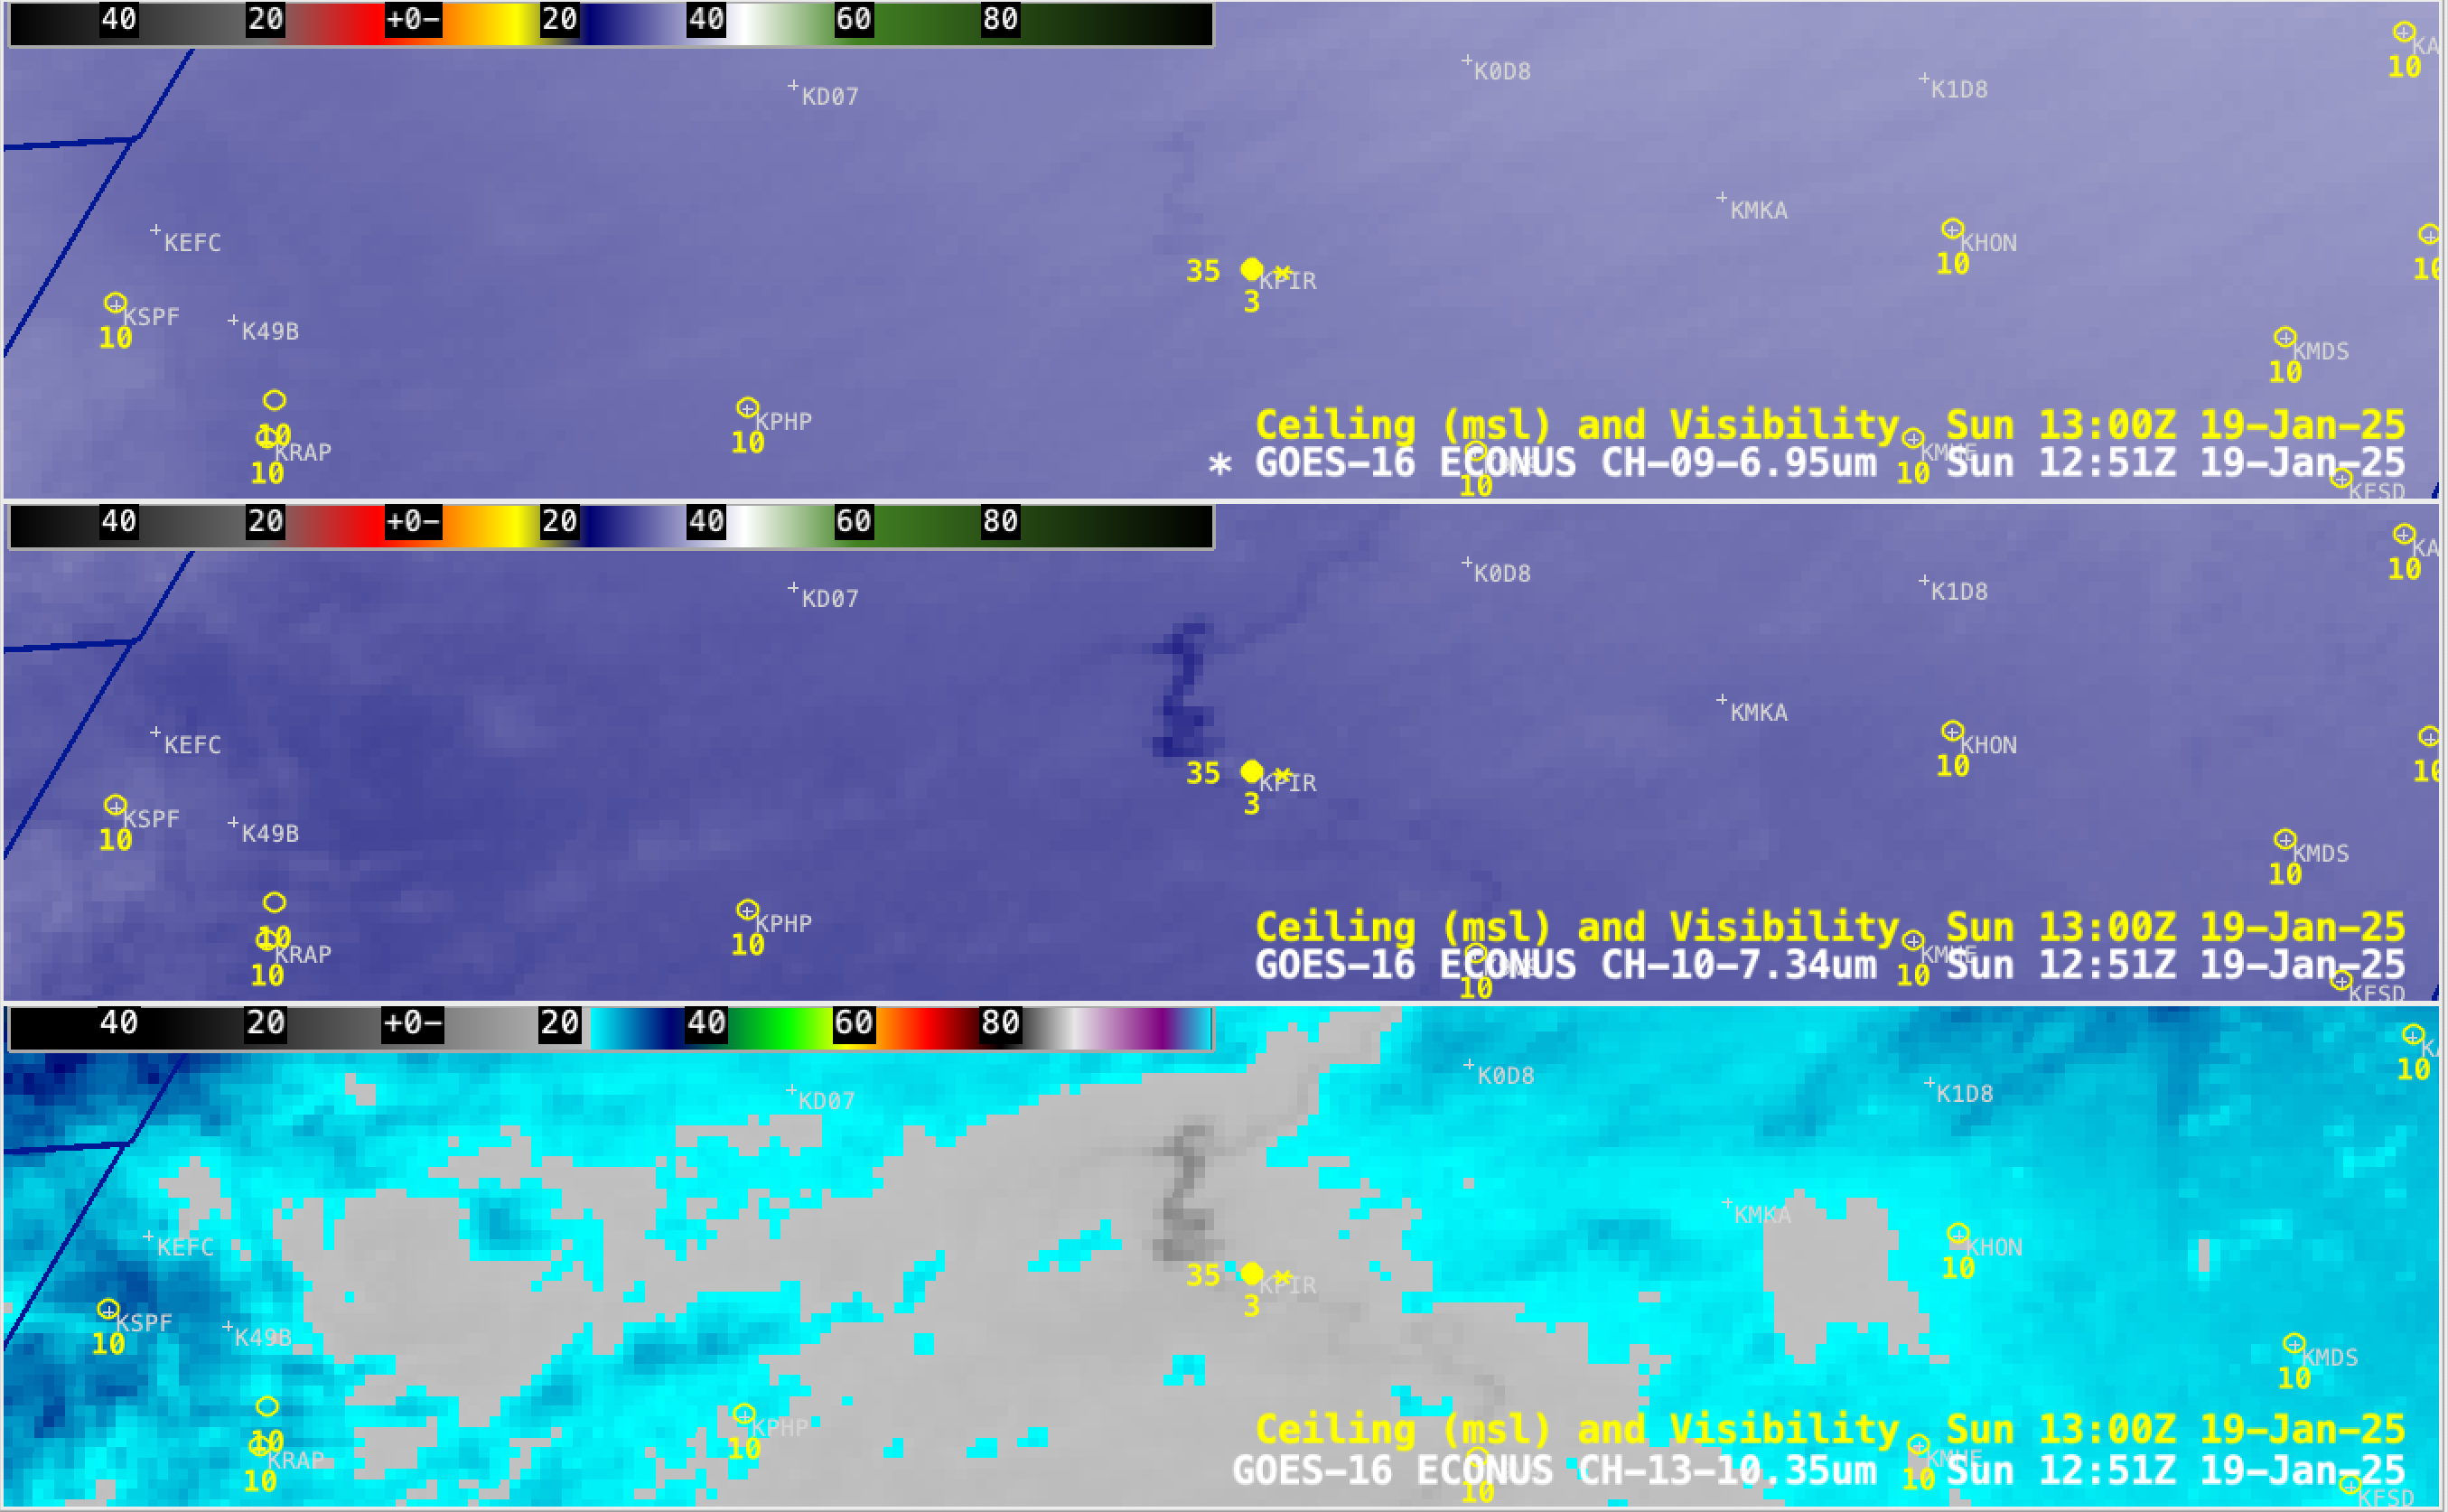
GOES-16 Upper-level water vapor infrared imagery for the 2.5 days ending at 1331 UTC on 22 January 2025, above as an mp4 (click here for a 125-megabyte animated gif) shows an active subtropical jetstream initially across the Gulf States. The jet deforms as an impulse drops south through California. Note the development on 21 January of cold cloud tops (white and green in the enhancement used) especially after 1100 UTC over east Texas and Louisiana in response to the eastward propagation of that digging shortwave indicated by yellow (warmer brightness temperatures) moving across northern Mexico into west Texas at that time. The combination of this storm and an unusually cold and dry airmass over the deep south (and the rest of the country east of the Rockies) has resulted in a near-unprecedented snowstorm over the Gulf Coast states into the south Atlantic states. Numerous locations set all-time record snowfalls!
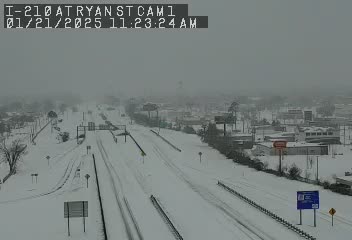
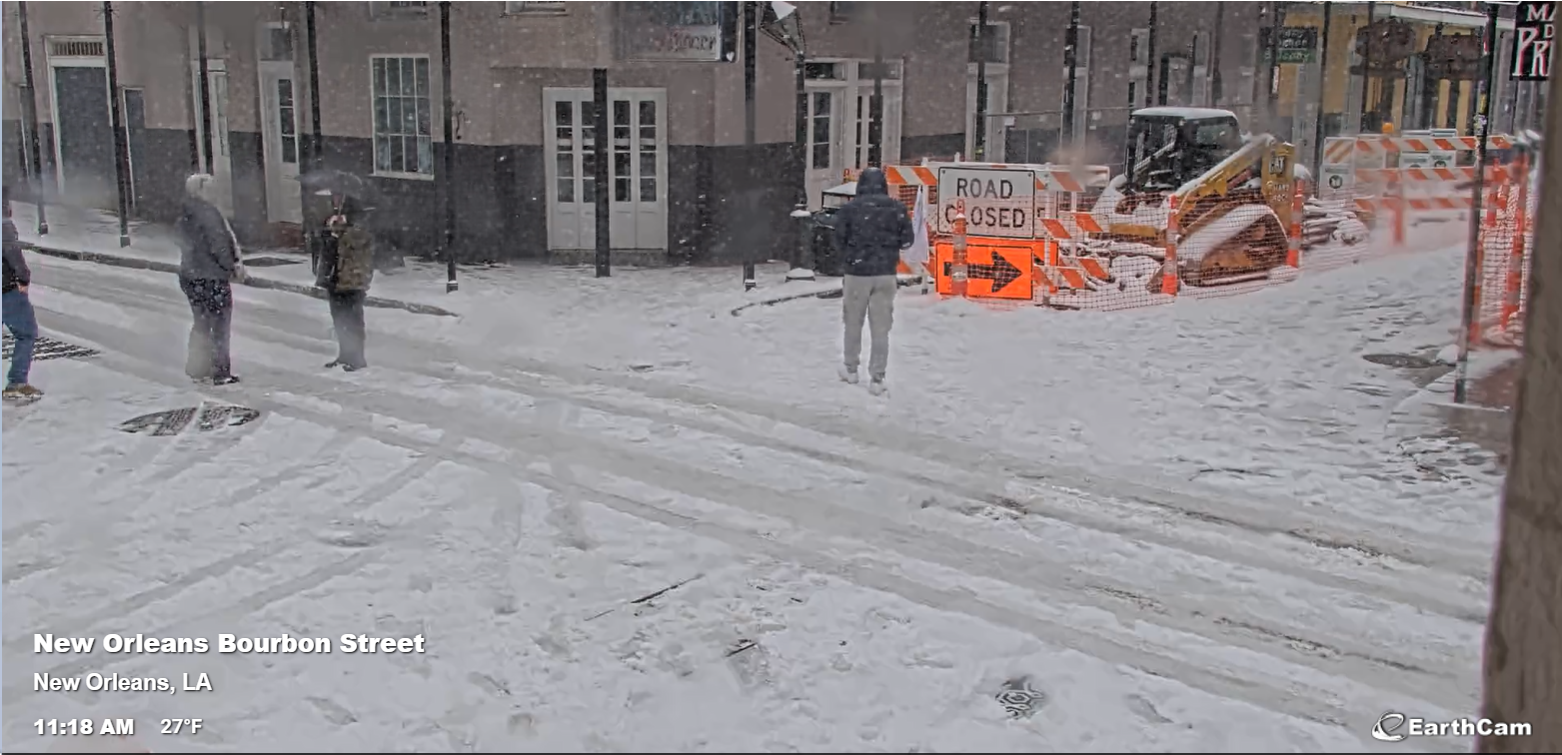
Webcam Imagery from just before Noon Central Time (1800 UTC) on 21 January included this Traffic Cam shot from Lake Charles, LA, this view of Galveston TX (from here) and this view of Bourbon Street in New Orleans (source).
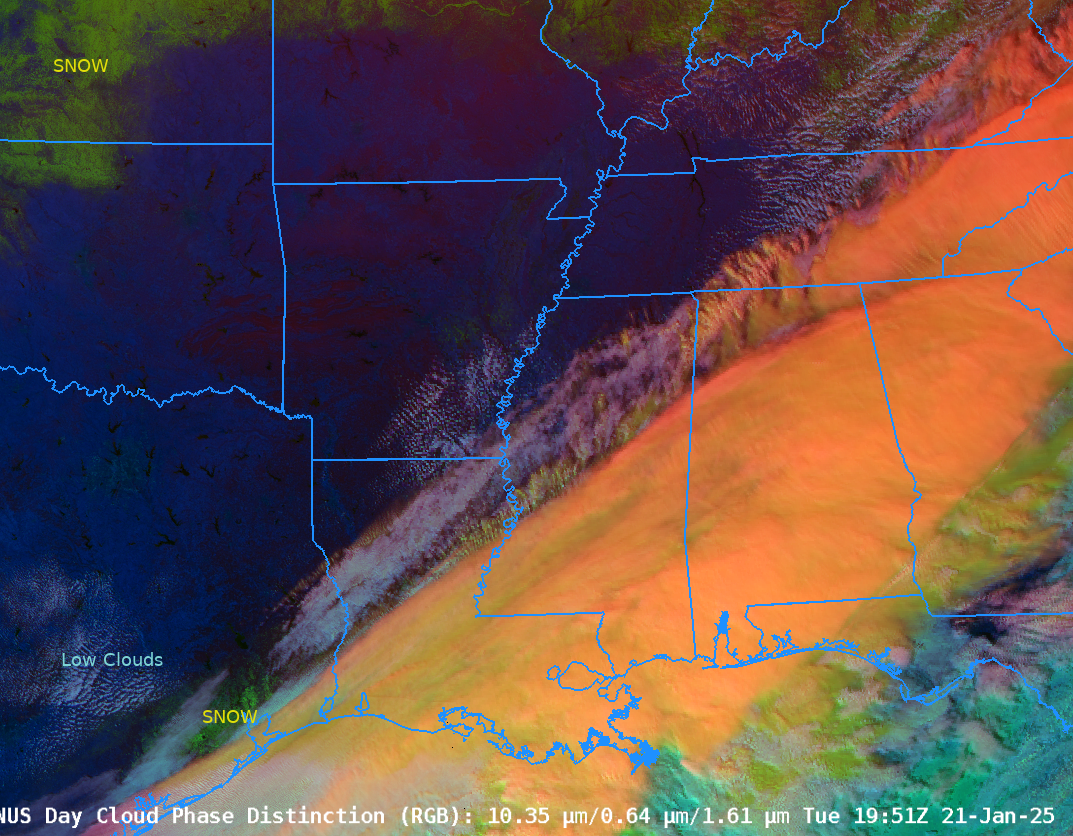
GOES-16 Day Cloud Phase Distinction from 1816-1951 UTC, below, shows the strengthening storm. You can use the cloud texture over Louisiana to infer regions where precipitation is occurring (all in the form of snow!). Day Cloud Phase Distinction also highlights — in green — snow that is on the ground in Kansas and Oklahoma, and also in southeast Texas that becomes apparent as the deeper clouds (orange/yellow in this RGB) pull away. That snow on the ground in southeast Texas is inhibiting the development of cumulus clouds (white/cyan).

The toggle below includes annotations highighting regions of snow and low clouds.
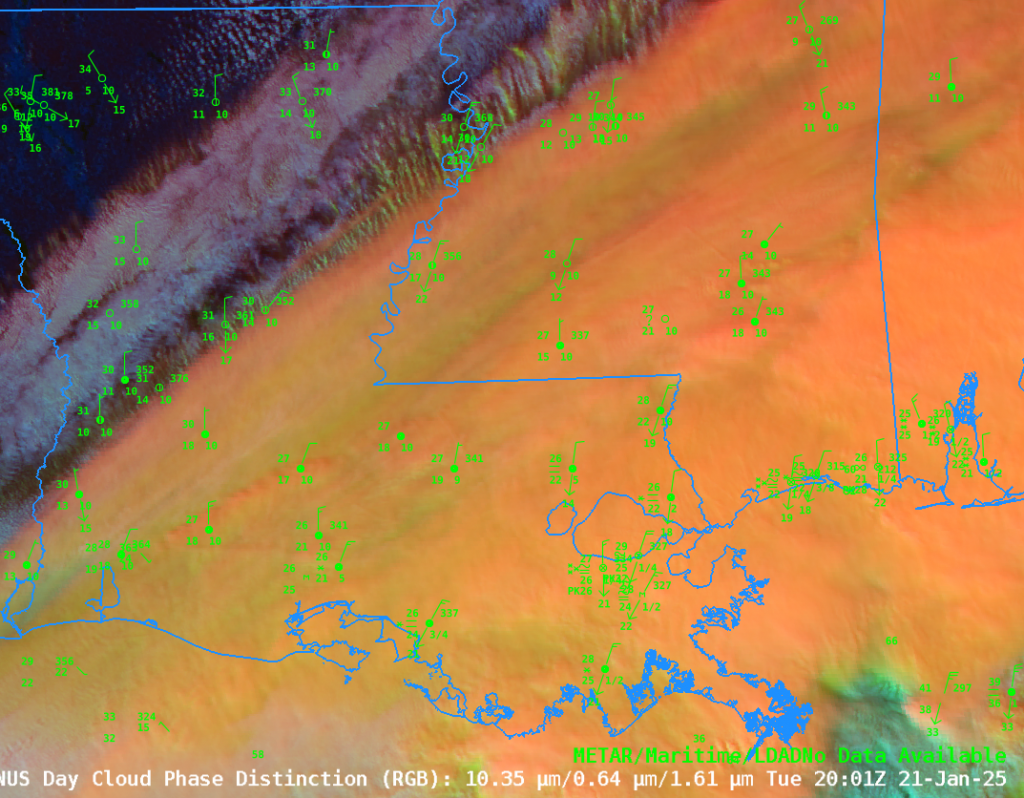
A zoomed-in Day Cloud Phase Distinction RGB over Louisiana at 2001 UTC, below, shows how one might use this RGB, both the color and texture, to infer regions where precipitation is occurring.
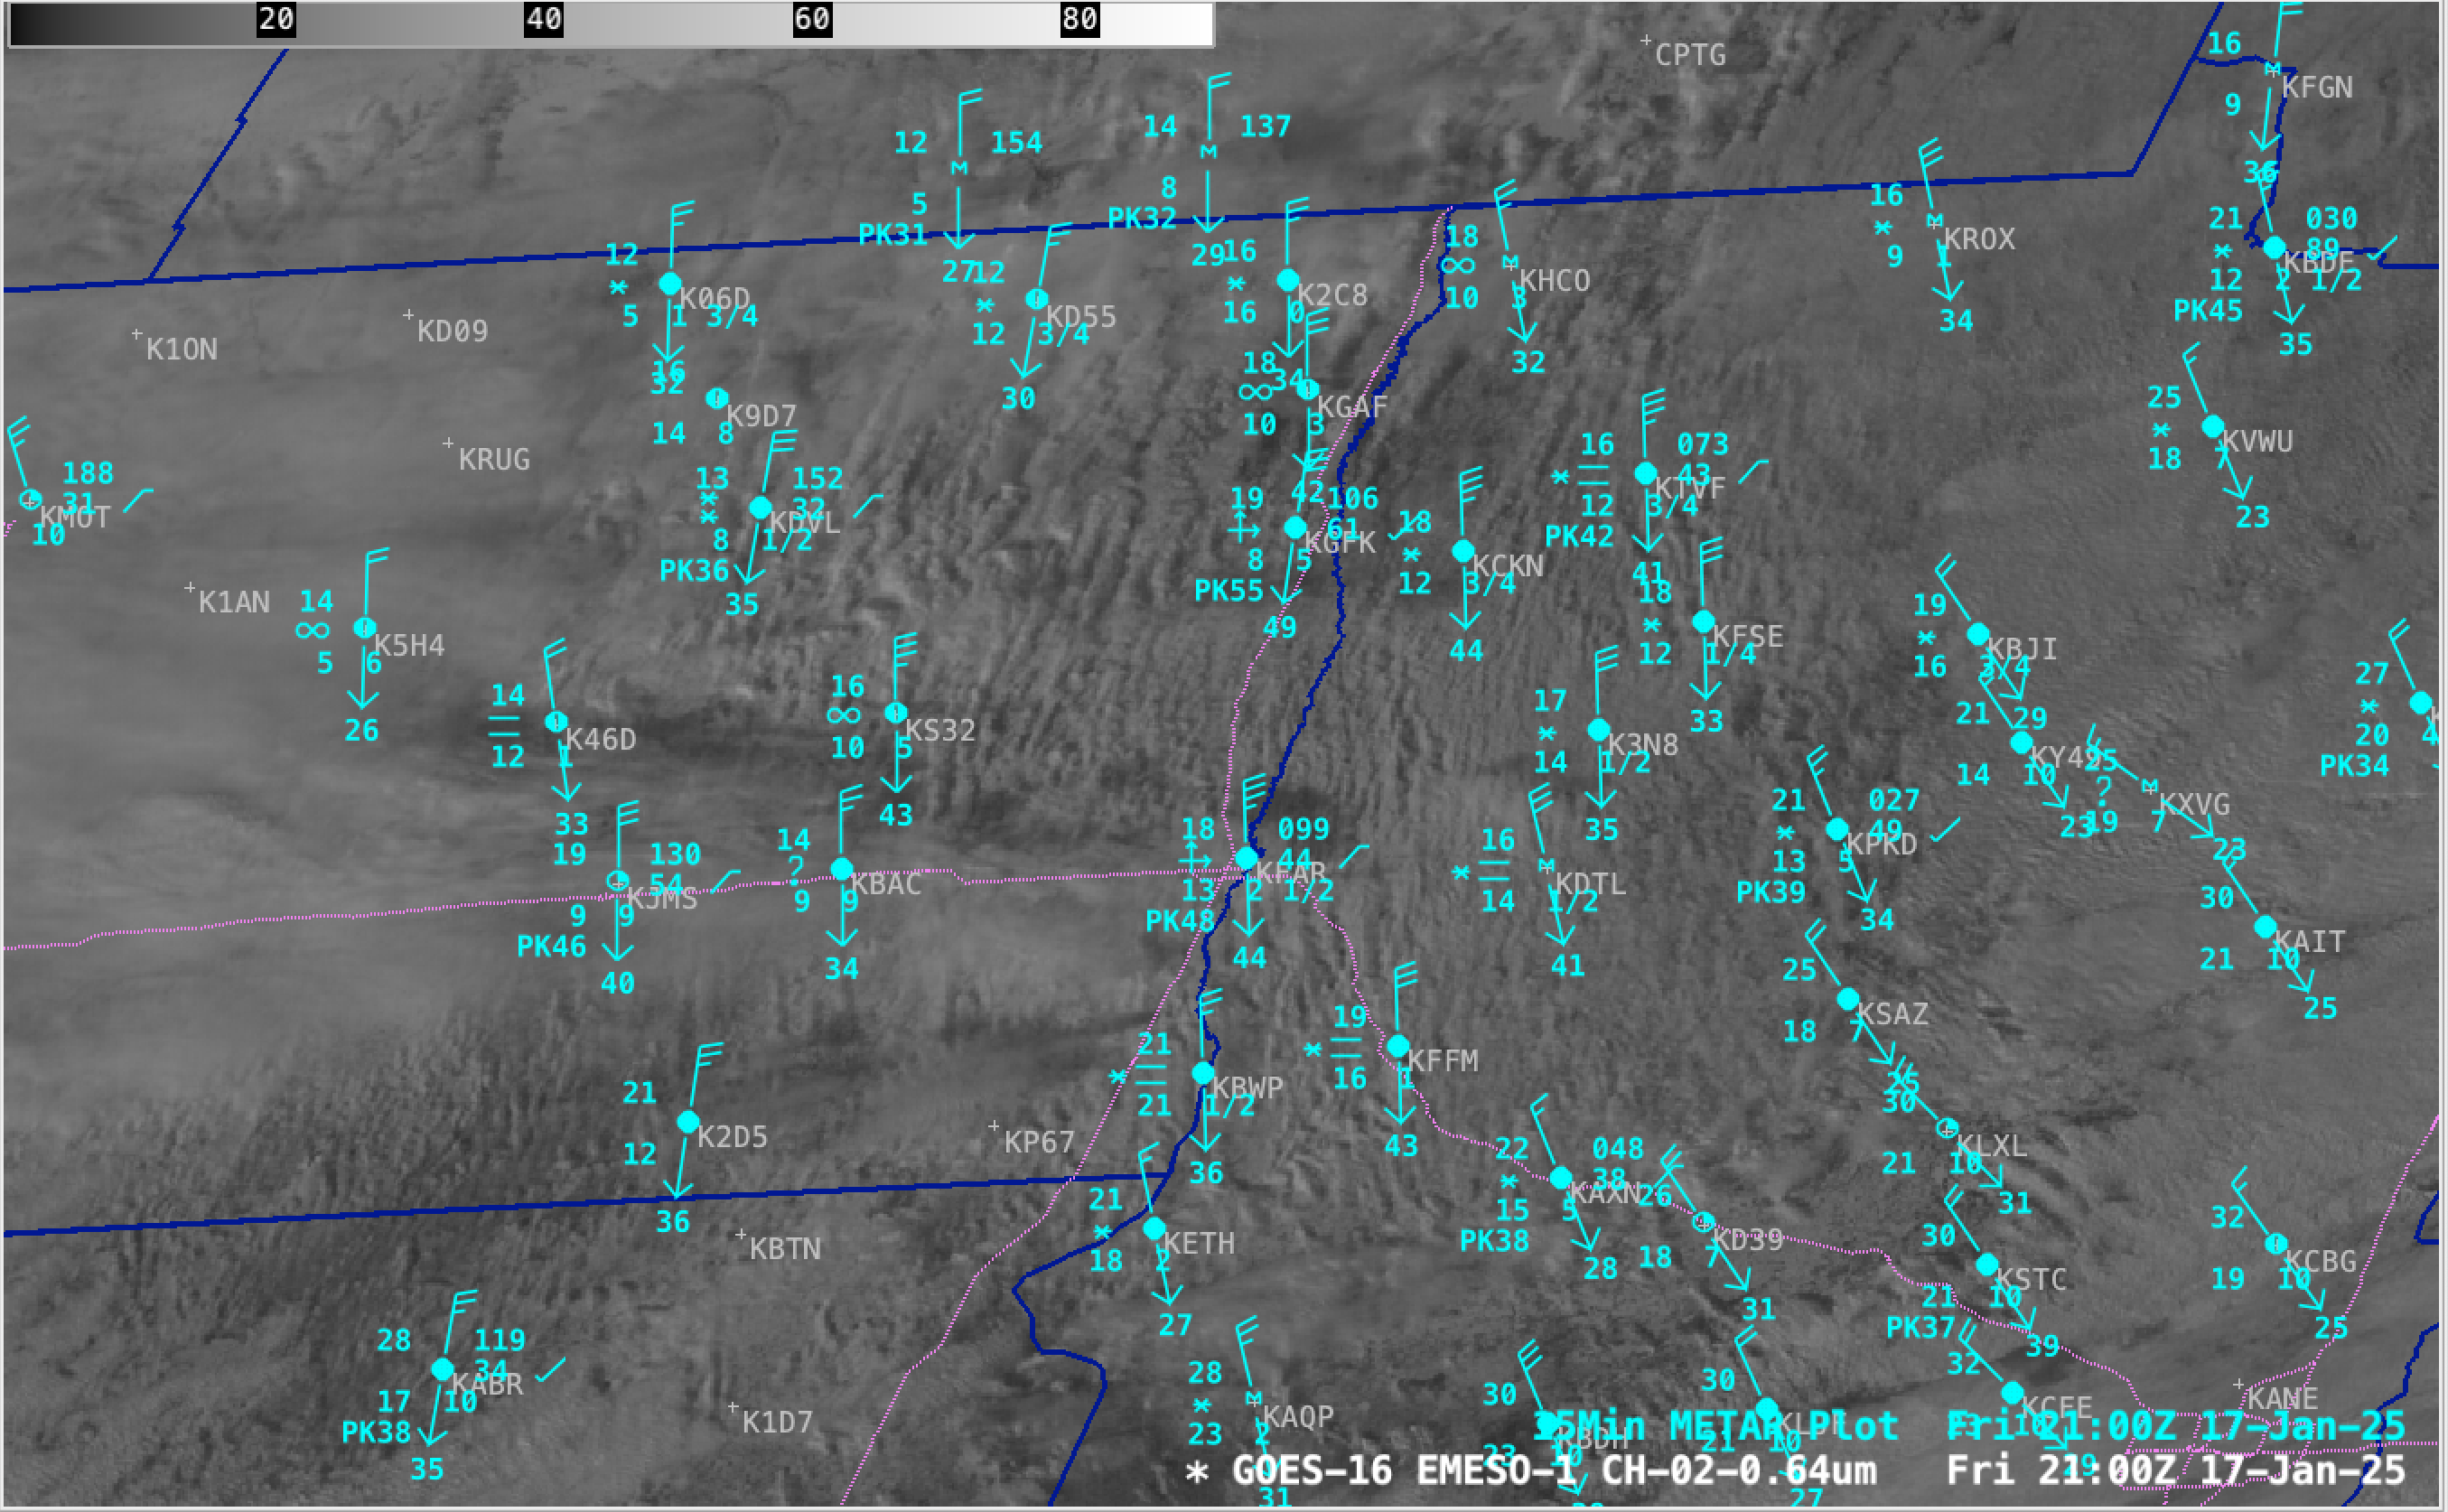
GOES-16 Clean Infrared Window (10.3 µm) images — with plots of Surface Wind barbs (white), Peak Wind gusts (yellow and red), Surface Weather symbols (red) and Ship Reports (beige) — from 0536-2201 UTC on 21 January (courtesy Scott Bachmeier, CIMSS) [click to play MP4 animation]
A closer look at the Gulf Coast — from Bay City, Texas across Louisiana to Gulfport-Biloxi, Mississippi — using GOES-16 Infrared (10.3 µm) images (above) showed the eastward progression of snow observations (which were occasionally moderate to heavy at some sites) during the 16.5 hours ending at 2201 UTC. Cloud-top infrared brightness temperatures became increasingly colder (-40s to -50s C, shades of green to yellow) as snowfall rates increased across the region. A corresponding animation with overlays of Winter Watches, Warnings and Advisories is available here — which included the first-ever Blizzard Warning issued by the NWS Lake Charles forecast office (that extended all the way to the coast!).
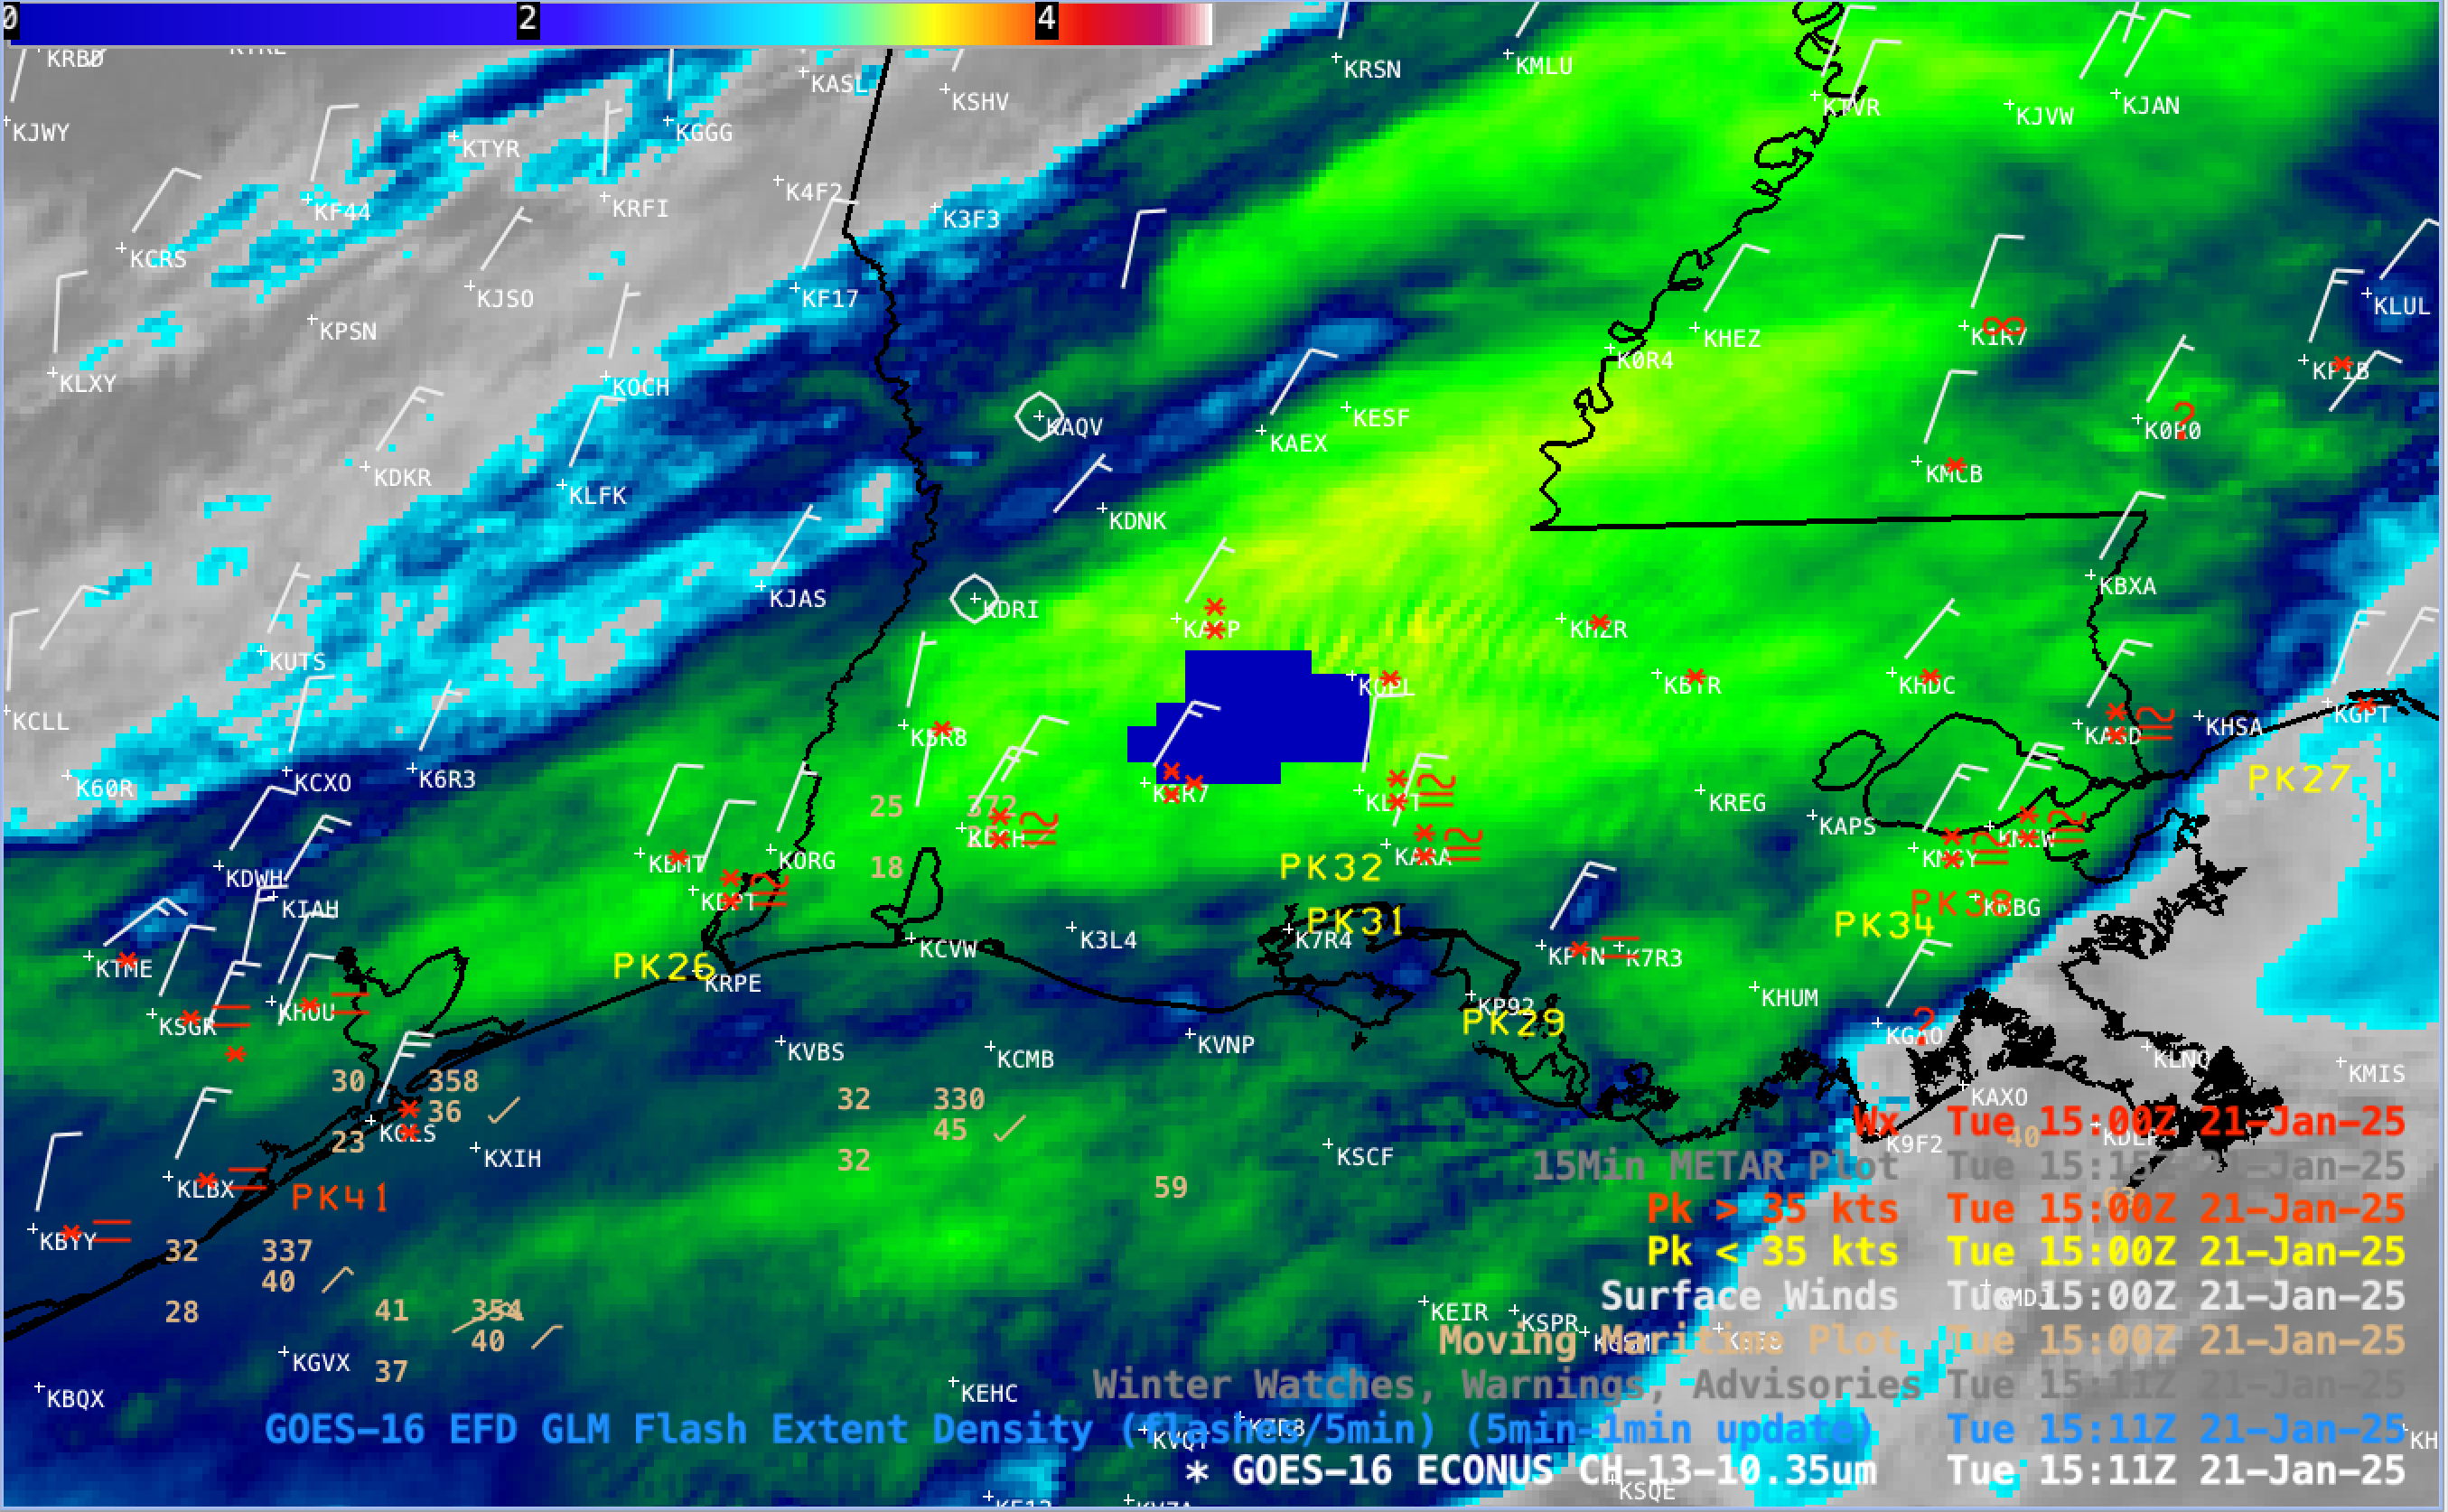
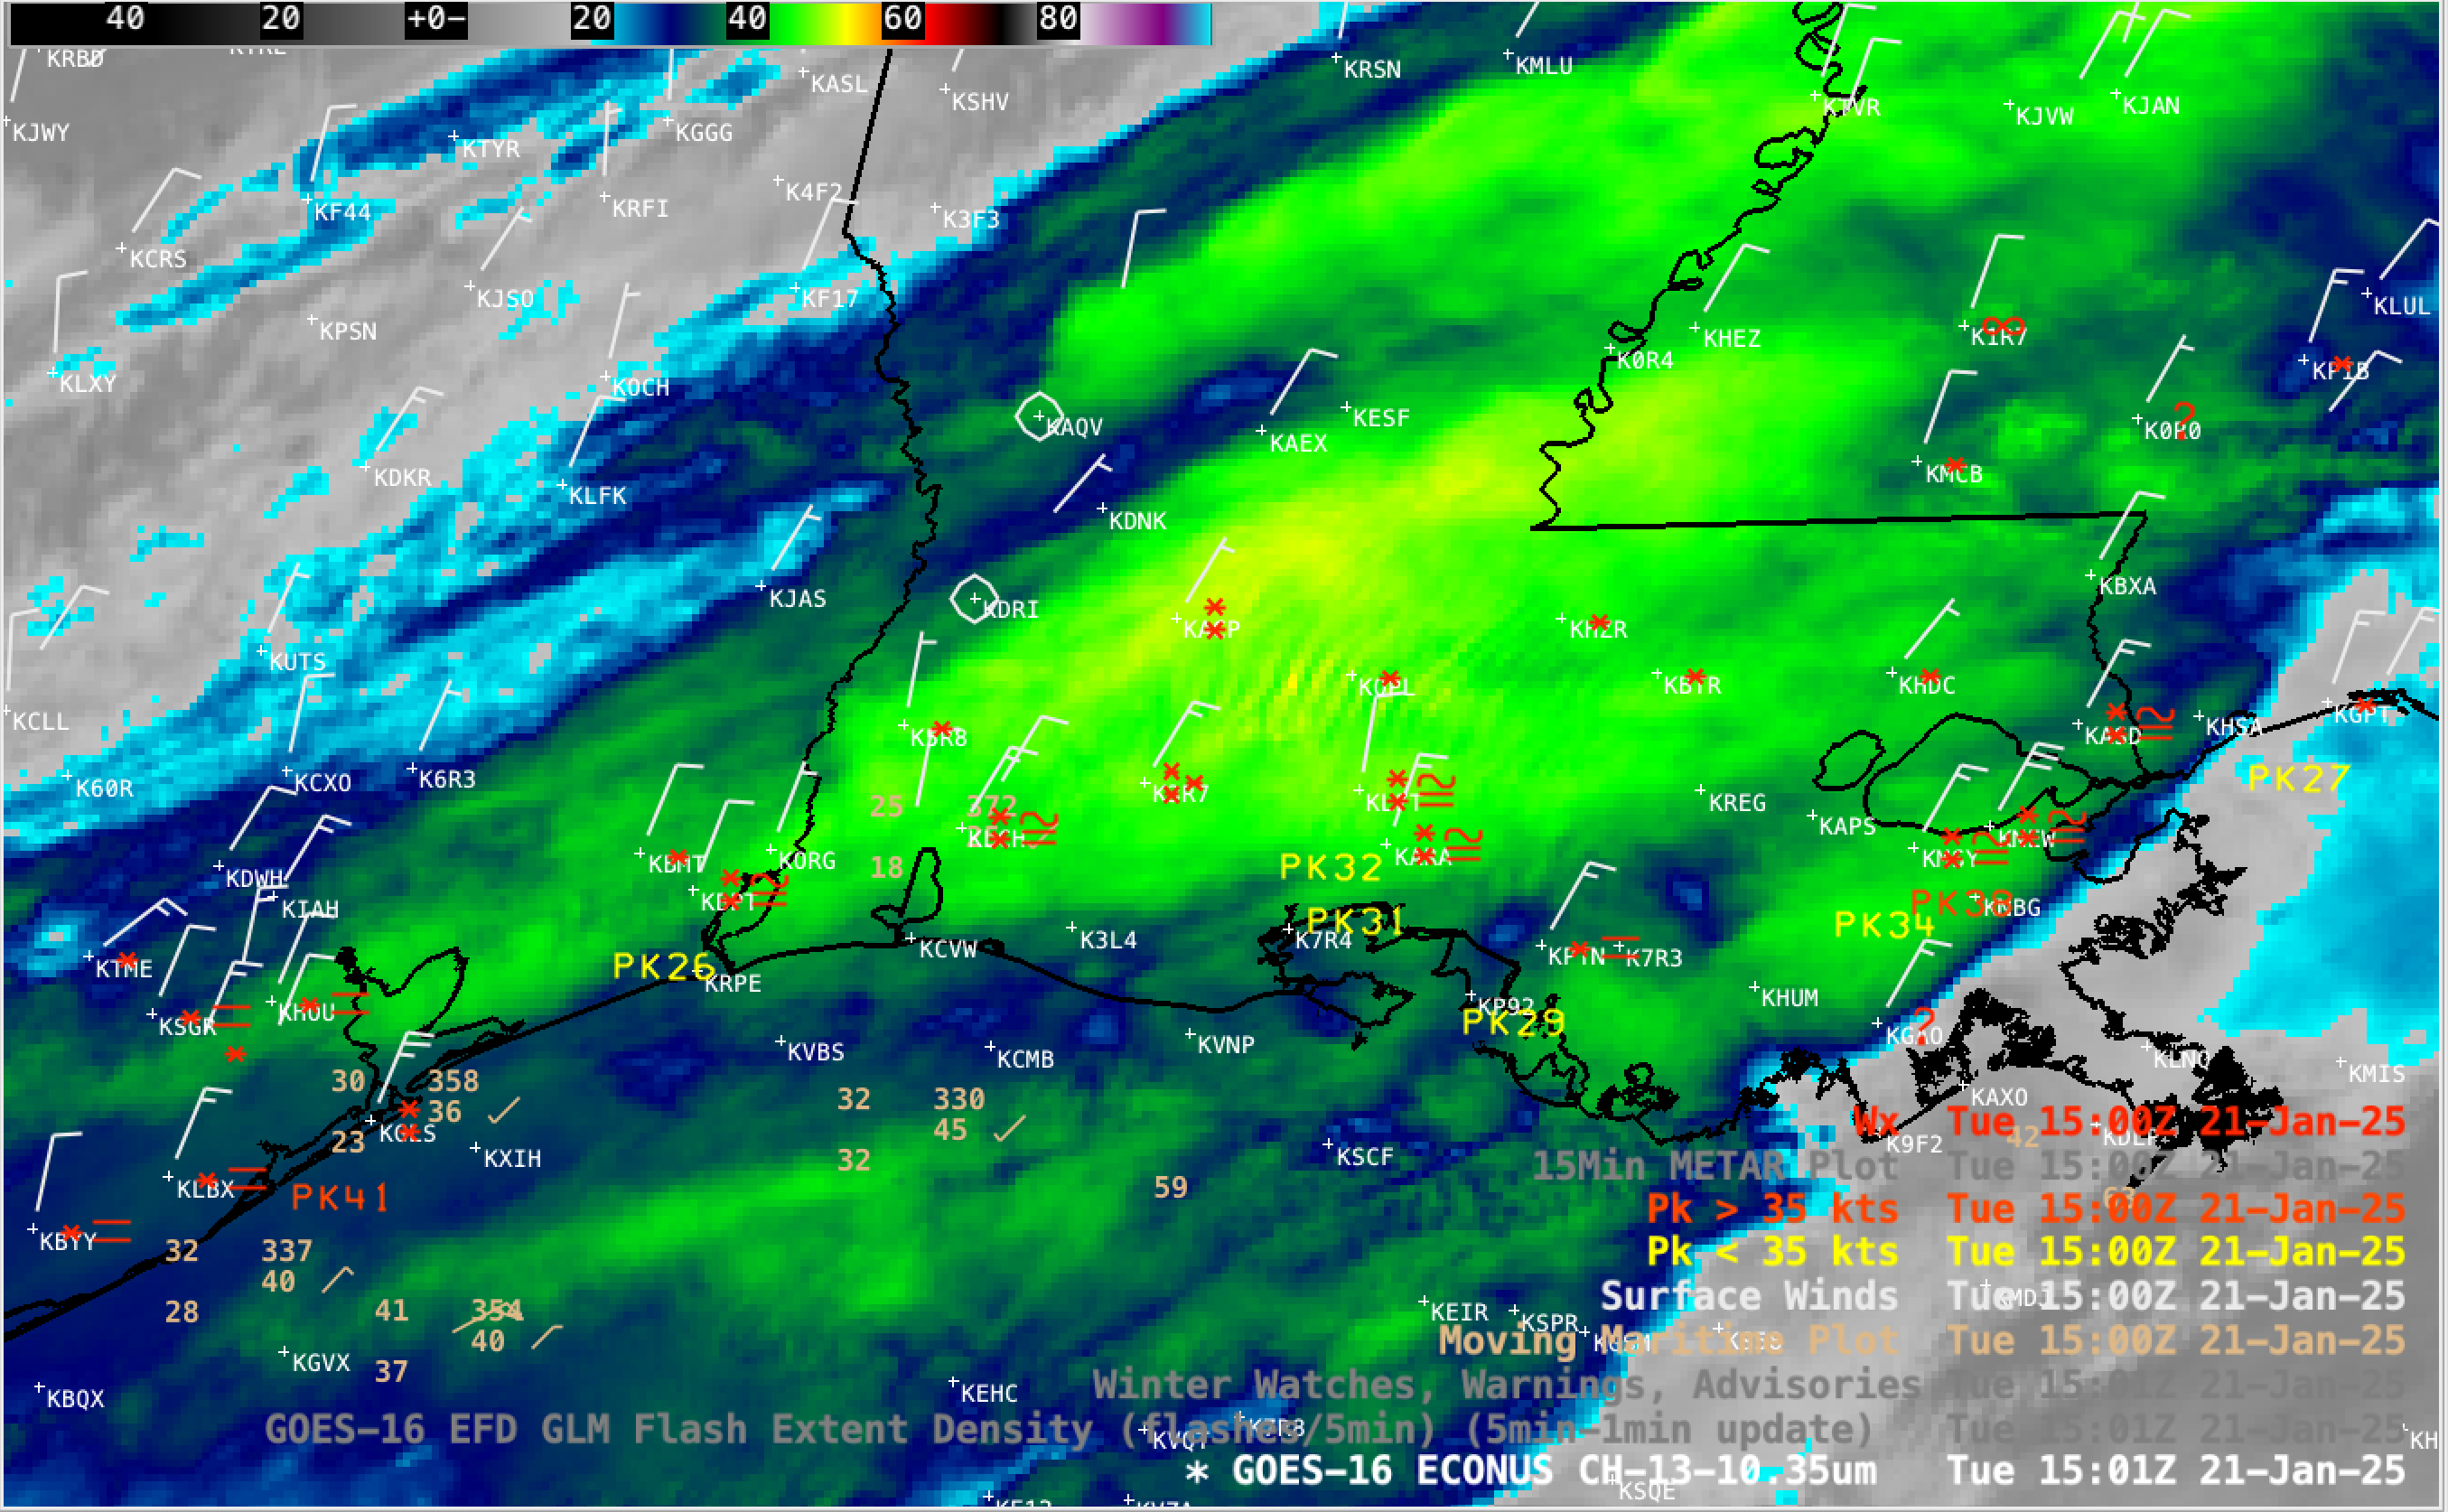
GOES-16 Infrared (10.3 µm) image, with an overlay of GLM Flash Extent Density (cluster of large blue pixels) at 1511 UTC on 21 January (courtesy Scott Bachmeier, CIMSS) [click to enlarge]
Two features of note occurred during that time period: (1) a brief cluster of GOES-16 GLM Flash Extent Density (FED) pixels over southwest Louisiana at 1511 UTC (above), suggesting that thundersnow may have occurred (none of the 3 nearby METAR sites explicitly reported lightning or thundersnow, although the southernmost site was reporting heavy snow) — however, the heaviest storm total snowfall amounts occurred near the eastern edge of the FED signature; it is also interesting that a small packet of cloud-top Kelvin-Helmholtz waves traversed that same area immediately preceding the FED signature (possibly an indicator of enhanced snowfall rates), and (2) a Ship Report of moderate to heavy freezing rain off the coast of Louisiana at 1800 UTC (below); there was quite a difference between that ship report air temperature (32ºF) and sea surface temperature (61ºF)!
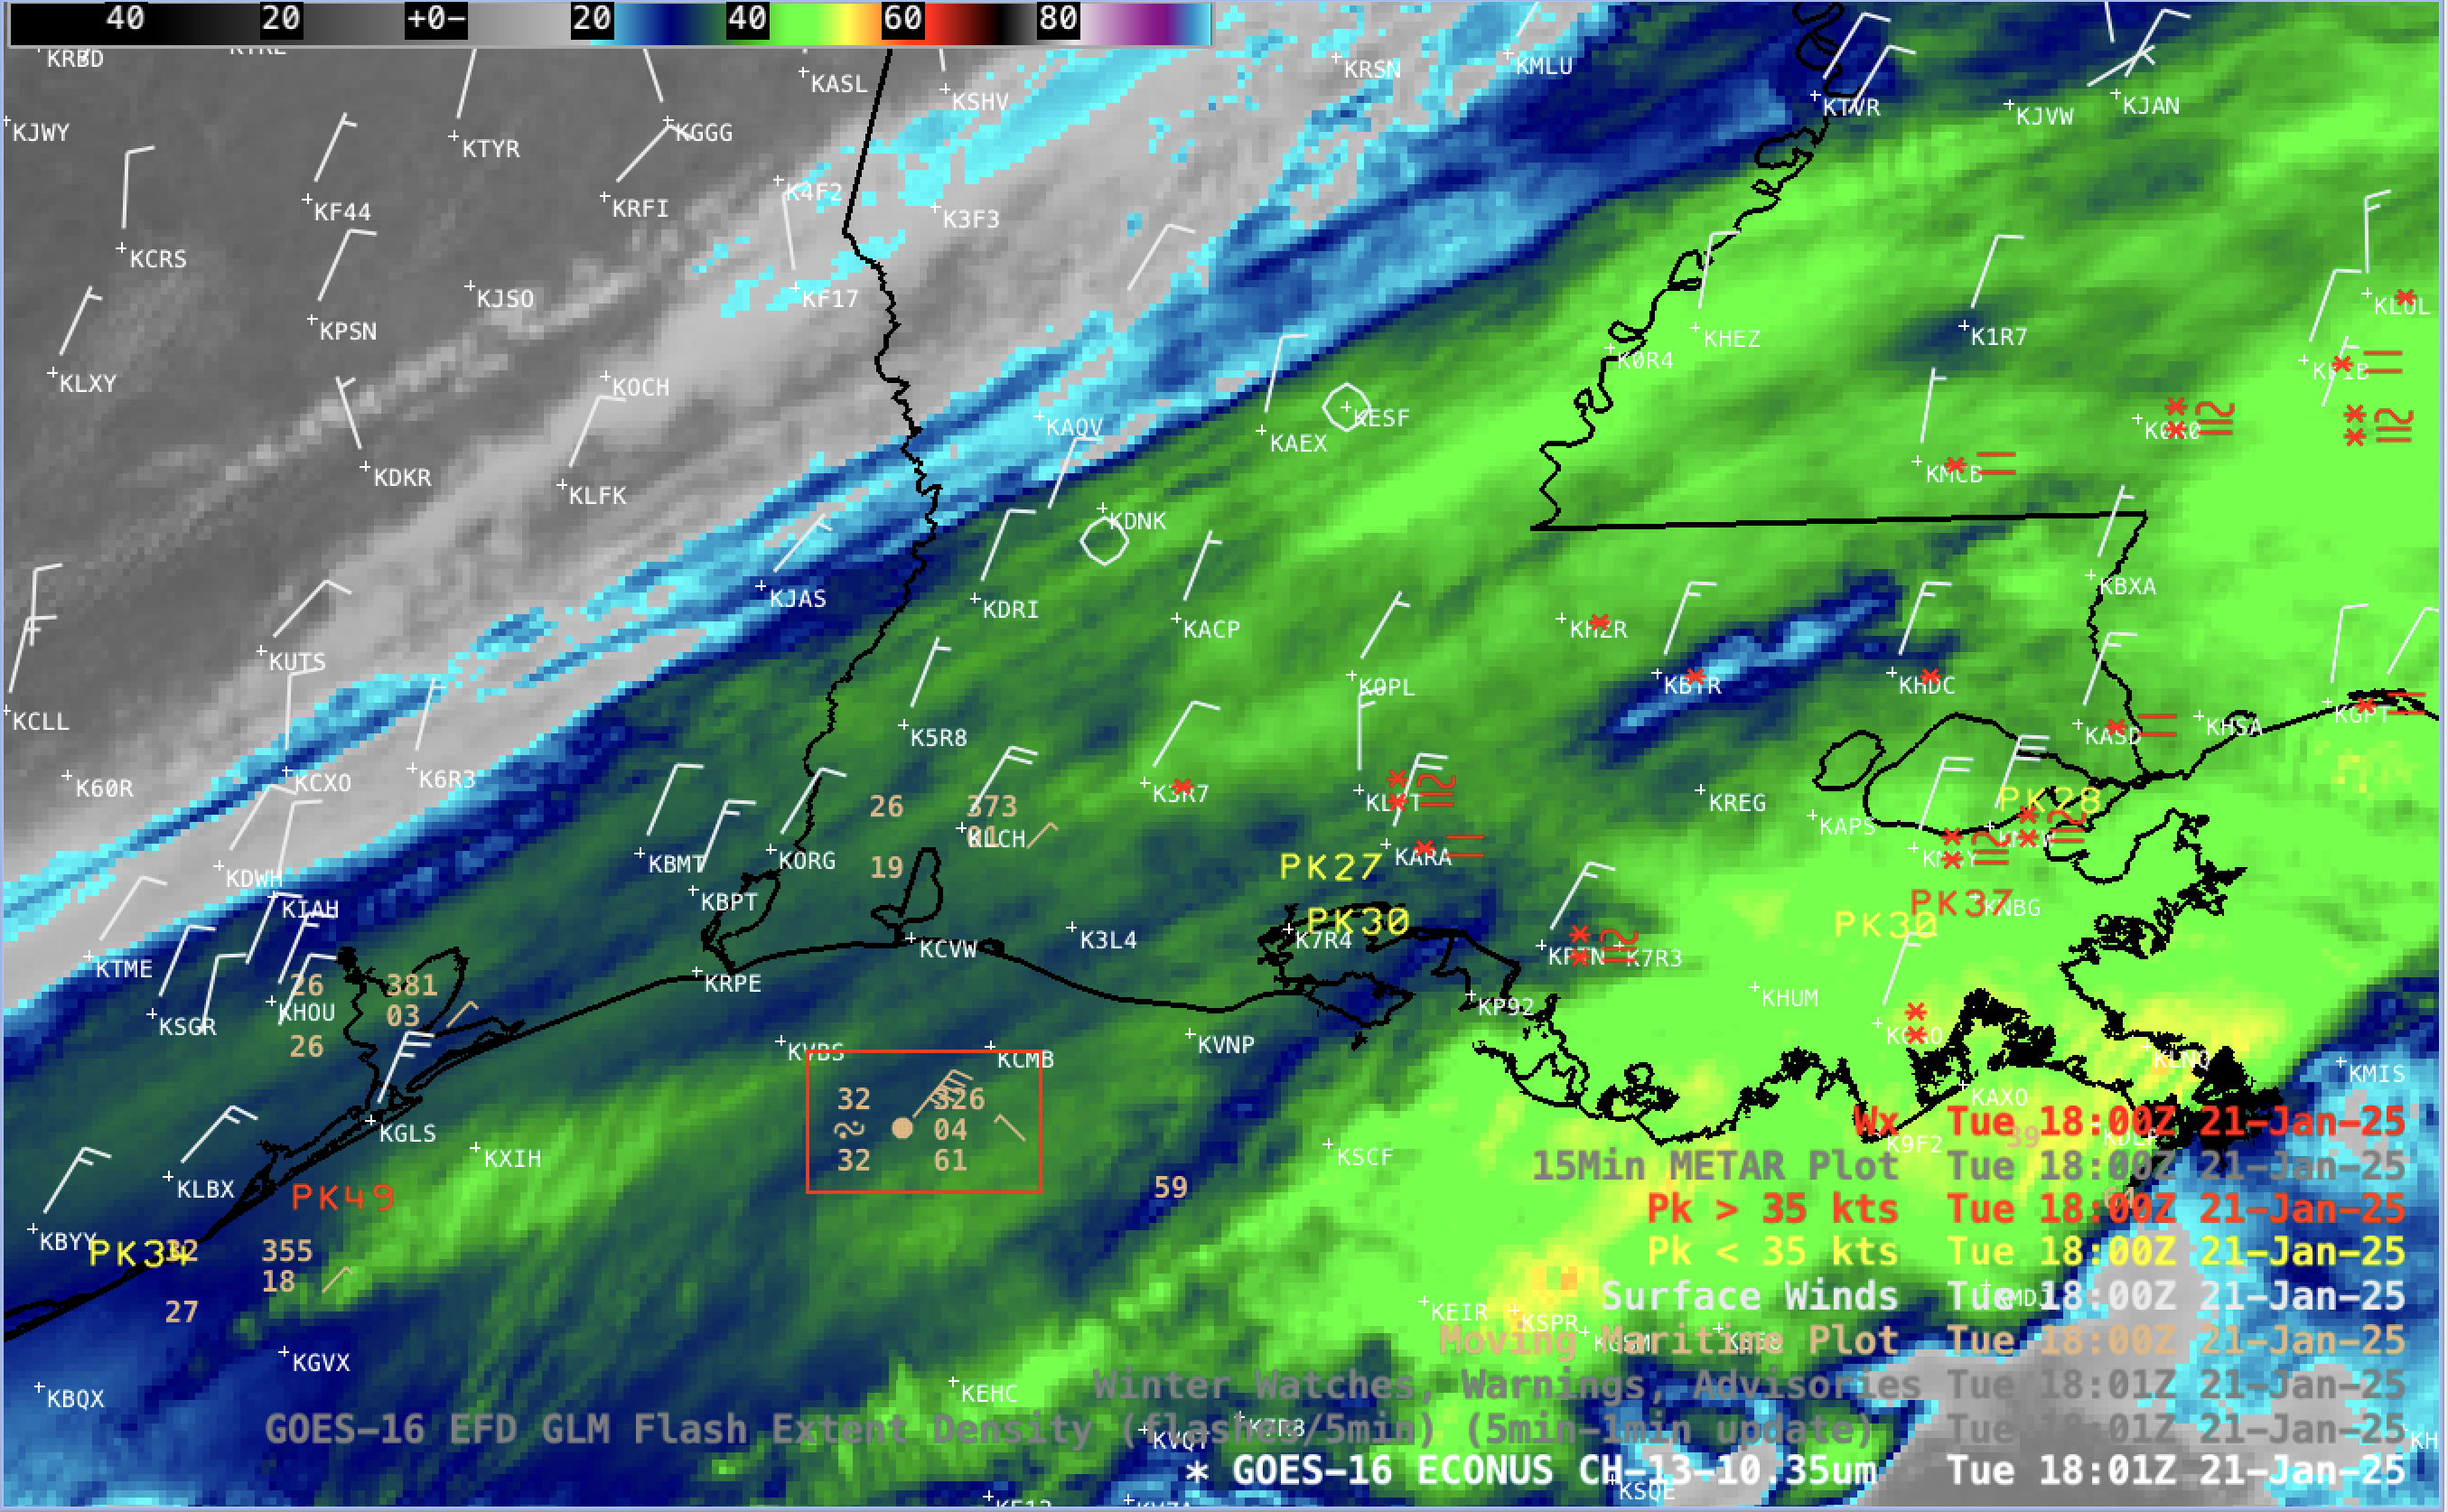
GOES-16 Infrared (10.3 µm) image at 1801 UTC on 21 January, with a red box highlighting a Ship Report of freezing rain off the coast of Louisiana (courtesy Scott Bachmeier, CIMSS) [click to enlarge]
GOES-16 Land Surface Temperatures at 1301 UTC on 22 January 2025 showed sub-zero (oFahrenheit; the region in white in the toggle highlights values between -5 and 0) values over Florida, Alabama and Louisiana. Surface observations (recorded at 1.5 m) were in the single digits above zero.
An hour earlier, at 1201 UTC, the coldest GOES-16 Land Surface Temperature (LST) in southern Louisiana was -8.12ºF (the darker purple pixel west-southwest of Baton Rouge, KBTR) (below). That morning, the coldest air temperatures in that area were -1ºF near Lafayette, KLFT (there were 2 dark purple LST pixels northeast of KLFT, with a value of -6.4ºF). The coldest LSTs generally corresponded with the area that received the highest snowfall amounts.
GOES-16 Land Surface Temperature at 1201 UTC (with/without plots of surface observations) on 22 January, which include a sample of the coldest LST value of -8.12ºF in Louisiana (courtesy Scott Bachmeier, CIMSS) [click to enlarge]
GOES-16 daytime True Color RGB images (source) on 21 January and 22 January (below) provided a good view of the areal coverage of snow cover across northeast Texas, southern Louisiana and southern Mississippi. The southwest and south-central portion of Louisiana that received the most snowfall exhibited a brighter white appearance.

GOES-16 daytime True Color RGB images, from 2001-2311 UTC on 21 January and from 1351-2001 UTC on 22 January [click to play animated GIF | MP4]
Early morning satellite imagery, below, shows the snowband across the south. The toggle below between Band 2 (visible, 0.64 µm, at which wavelength snow is highly reflective) and Band 5 (near-infrared, 1.61 µm, at which wavelength snow absorbs energy and therefore appears dark) helps to highlight the snow band. You will be able to watch the snow area decrease in size on satellite imagery as the southern Sun shines soothingly.

Because of the reflectivity difference over snow in GOES-R Bands 2 and 5, any RGB that includes those two channels will produce a snowband with a different color than low cloud or adjacent land. That’s demonstrated in the toggle below. I chose 1441 UTC rather than 1401 UTC as shown above to take advantage of increased solar reflectance. In AWIPS, I could have used the 1401 UTC and adjusted the RGB bounds — via ‘Composite Options’ accessed by left-clicking on the product legend — to create a brighter image.
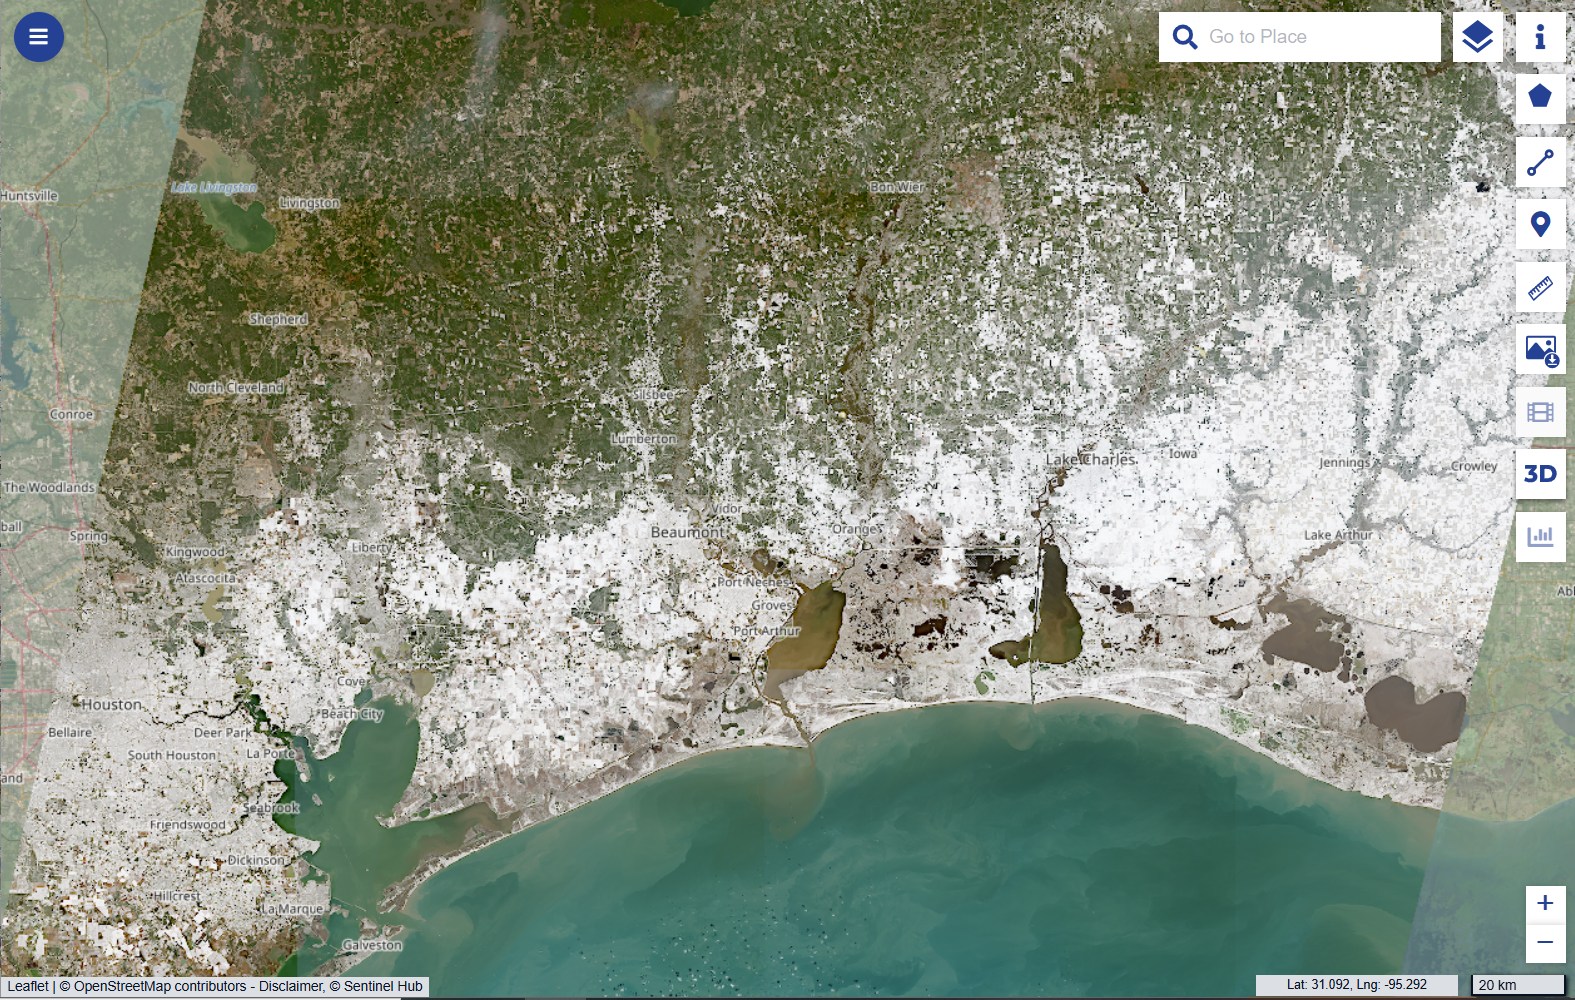
Sentinel-2A True-Color imagery of the snow over western Lousisiana/northeast Texas on 22 January 2025 (from this link) is shown below.
The Satellite Liaison Blog also discussed this storm here.
View only this post Read Less


