GOES-13 0.63 µm visible channel images with METAR surface reports (click to play animation)
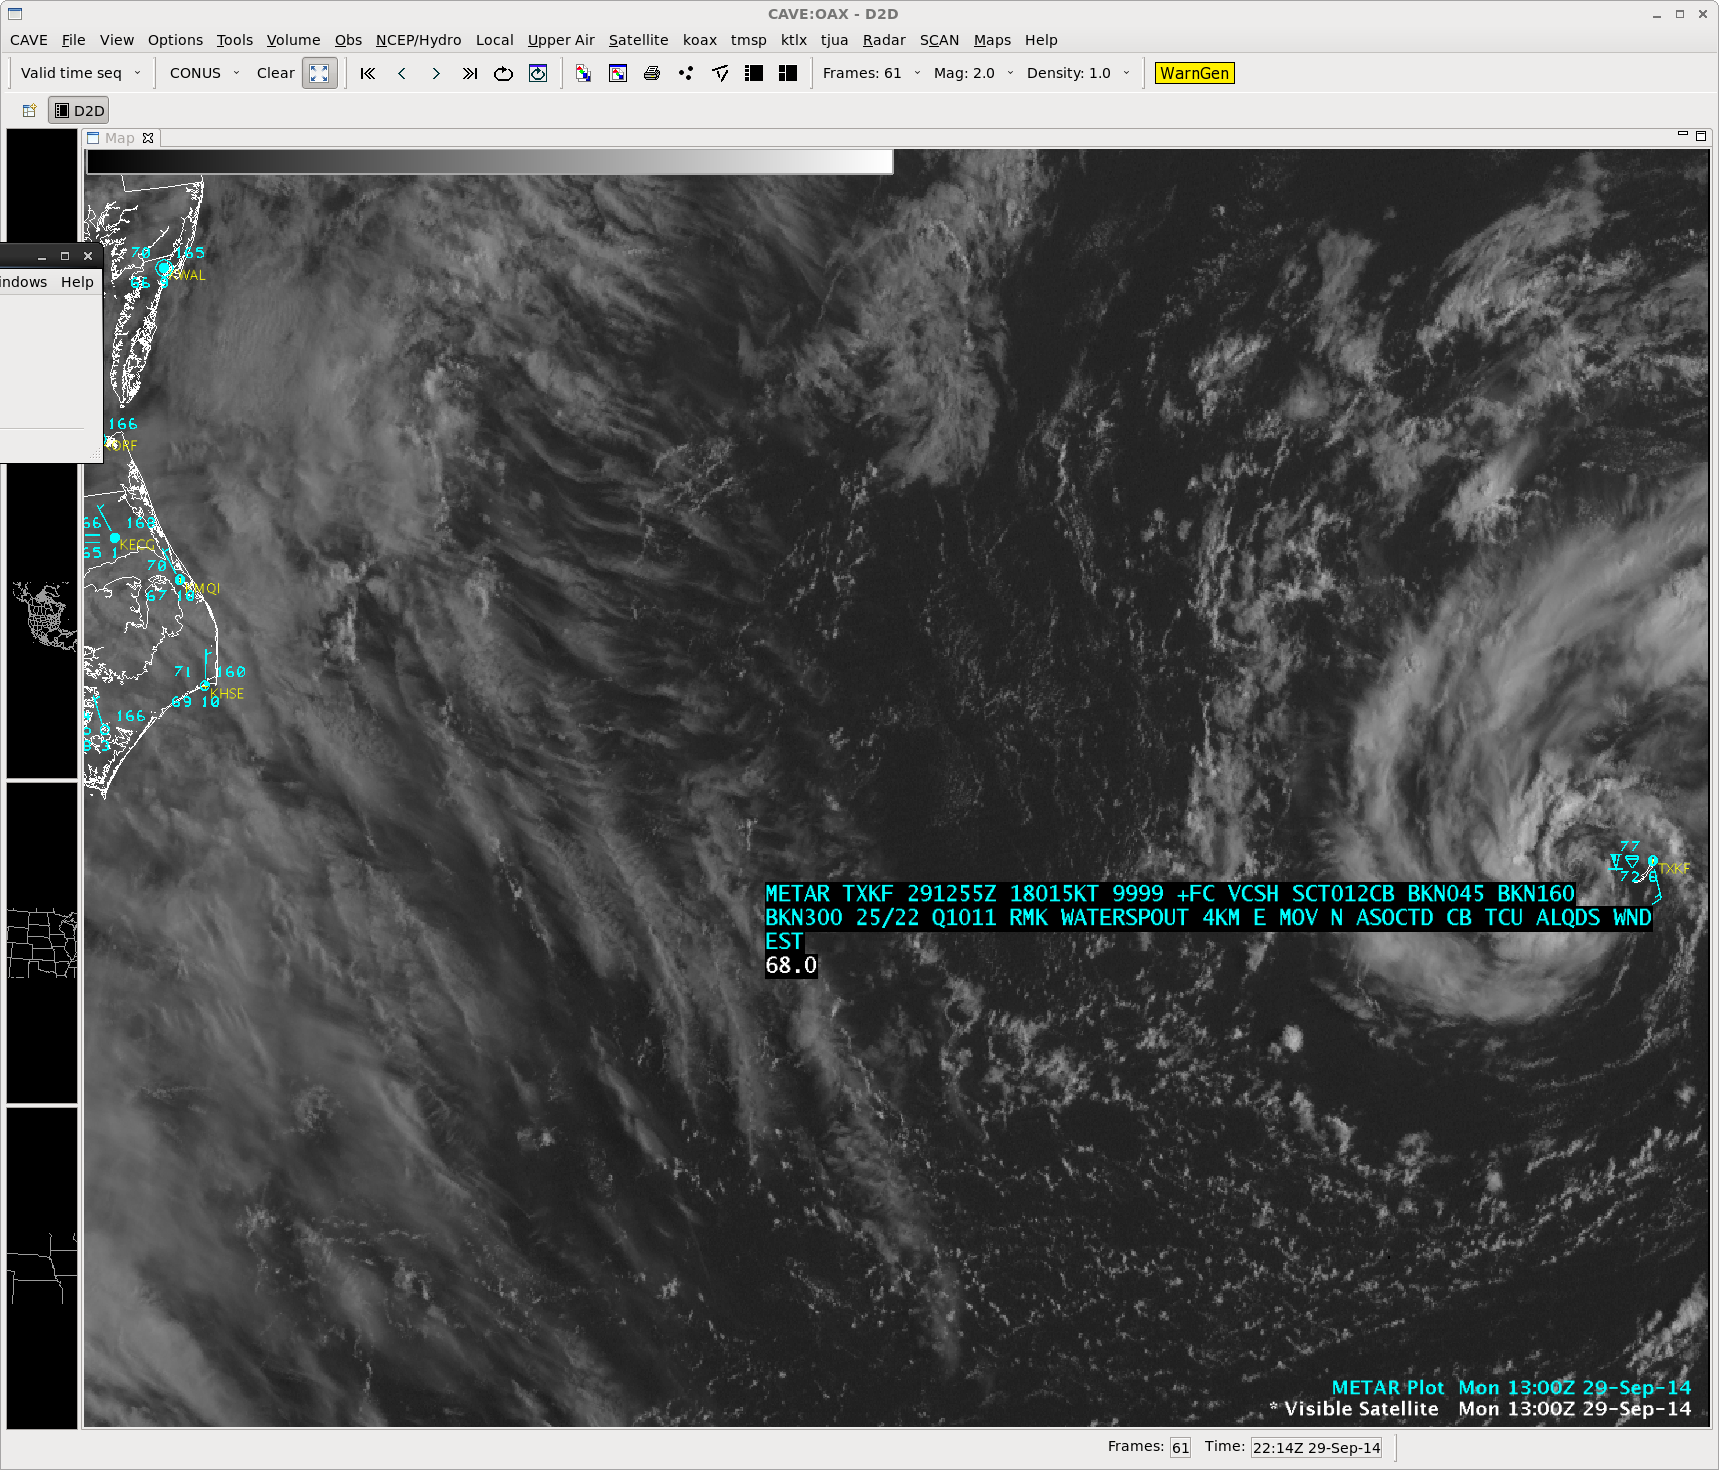
Tropical Invest 97L formed near Bermuda during the pre-dawn hours on 29 September 2014. After sunrise, AWIPS II images of GOES-13 0.63 µm visible channel data (above; click image to play animation) revealed a well-defined low-level circulation spinning just to the west of Bermuda. It is interesting to note that at 12:55 UTC a waterspout was reported 4 km to the east of the Bermuda International Airport (station identifier TXKF), associated with a band of deep convection that was moving northward (below).

GOES-13 0.63 µm visible channel image with Bermuda METAR observation
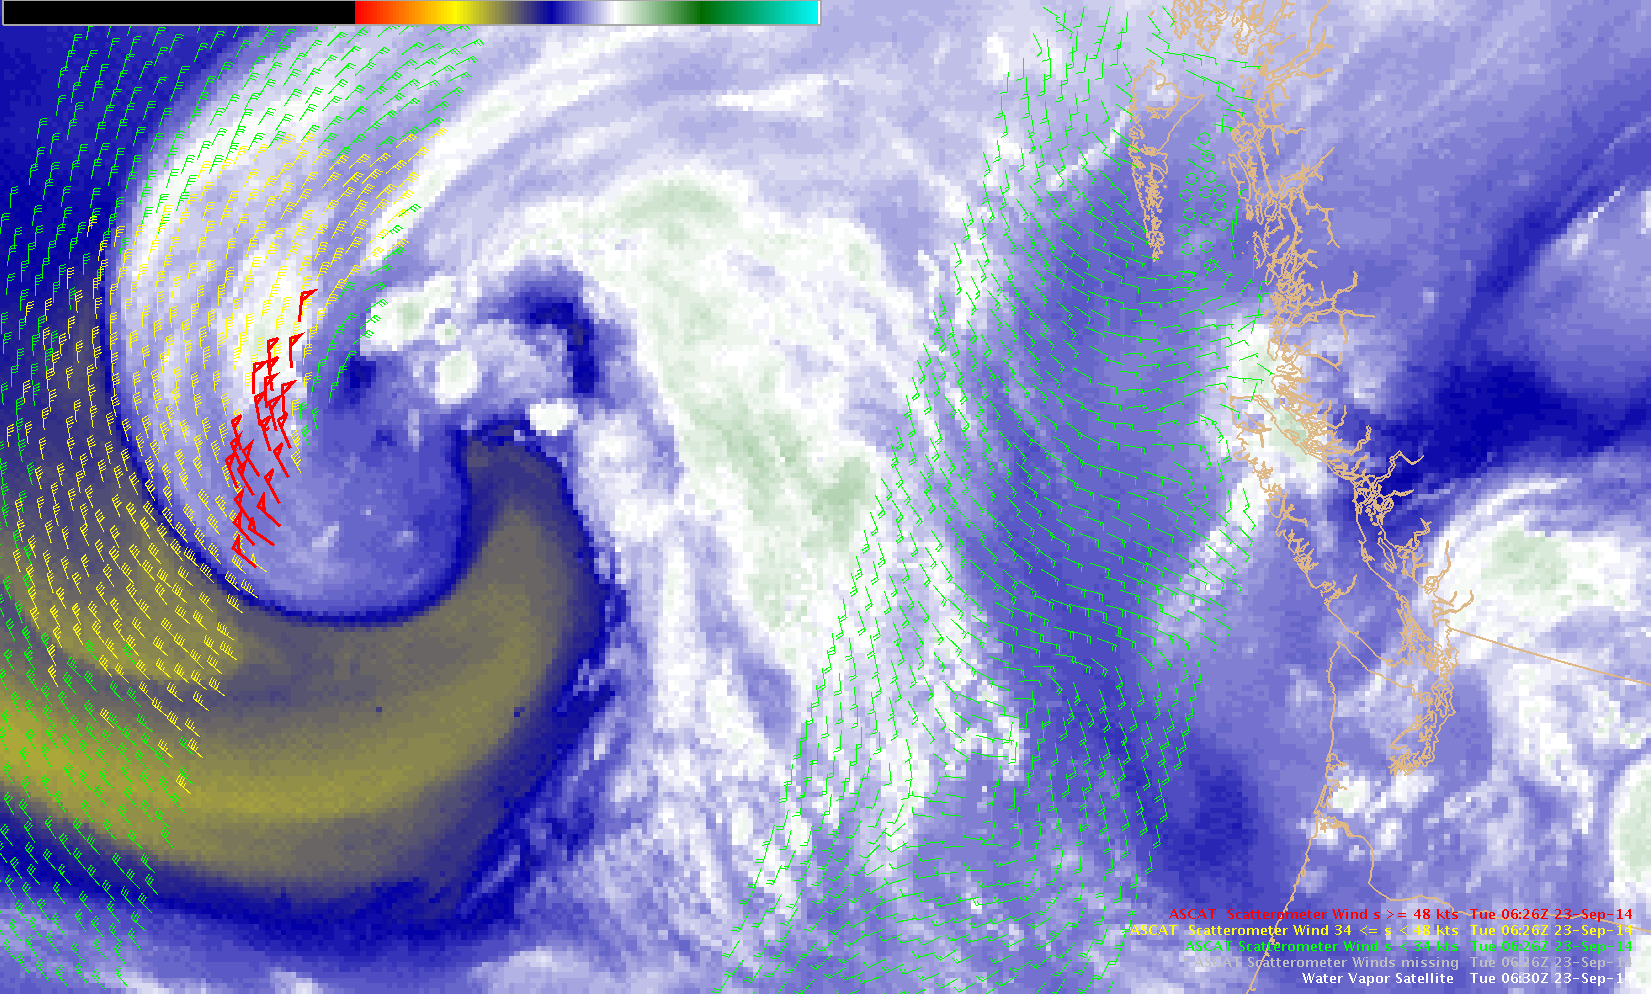
An overpass of a Metop satellite at 14:38 UTC provided a good view of the surface wind field with data from the ASCAT scatterometer instrument (below). There was one wind vector with a speed around 30 knots (green) just to the east of the center of circulation.
GOES-13 0.63 µm visible channel image with Metop ASCAT scatterometer surface winds
A comparison of Terra MODIS 0.65 µm visible channel and 11.0 µm IR channel images at 15:25 UTC (below) showed that the coldest cloud-top IR brightness temperatures of -55º C (orange color enhancement) were located to the north of the circulation center.
Terra MODIS 0.65 µm visible channel and 11.0 µm IR channel images
View only this post Read Less


