
An intense extratropical cyclone over the central United States spawned a Quasi-Linear Convective System that moved through the Deep South on 12-13 October 2014; the QLCS was responsible for a spate of severe weather including wind damage, hail and tornadoes (Storm reports from 12 October, 13 October). The image above, from 1933... Read More

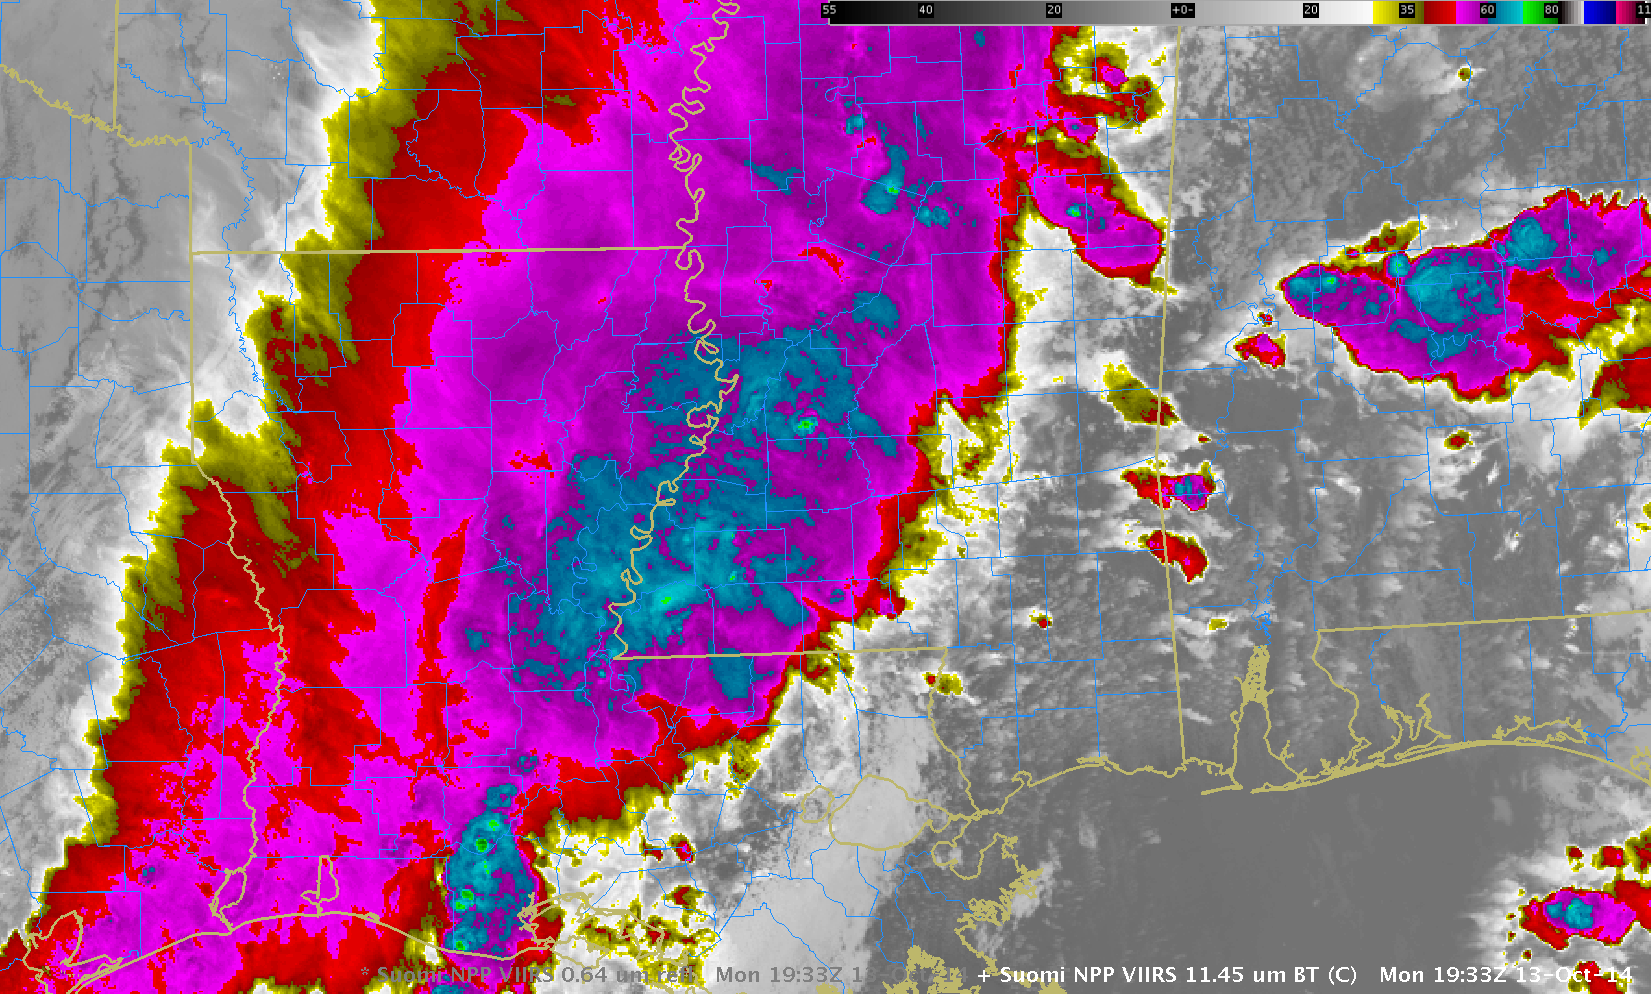
Suomi NPP 11.35 µm Infrared Imagery, 1933 UTC 13 October 2014, with Lightning strike data overlain (click to enlarge)
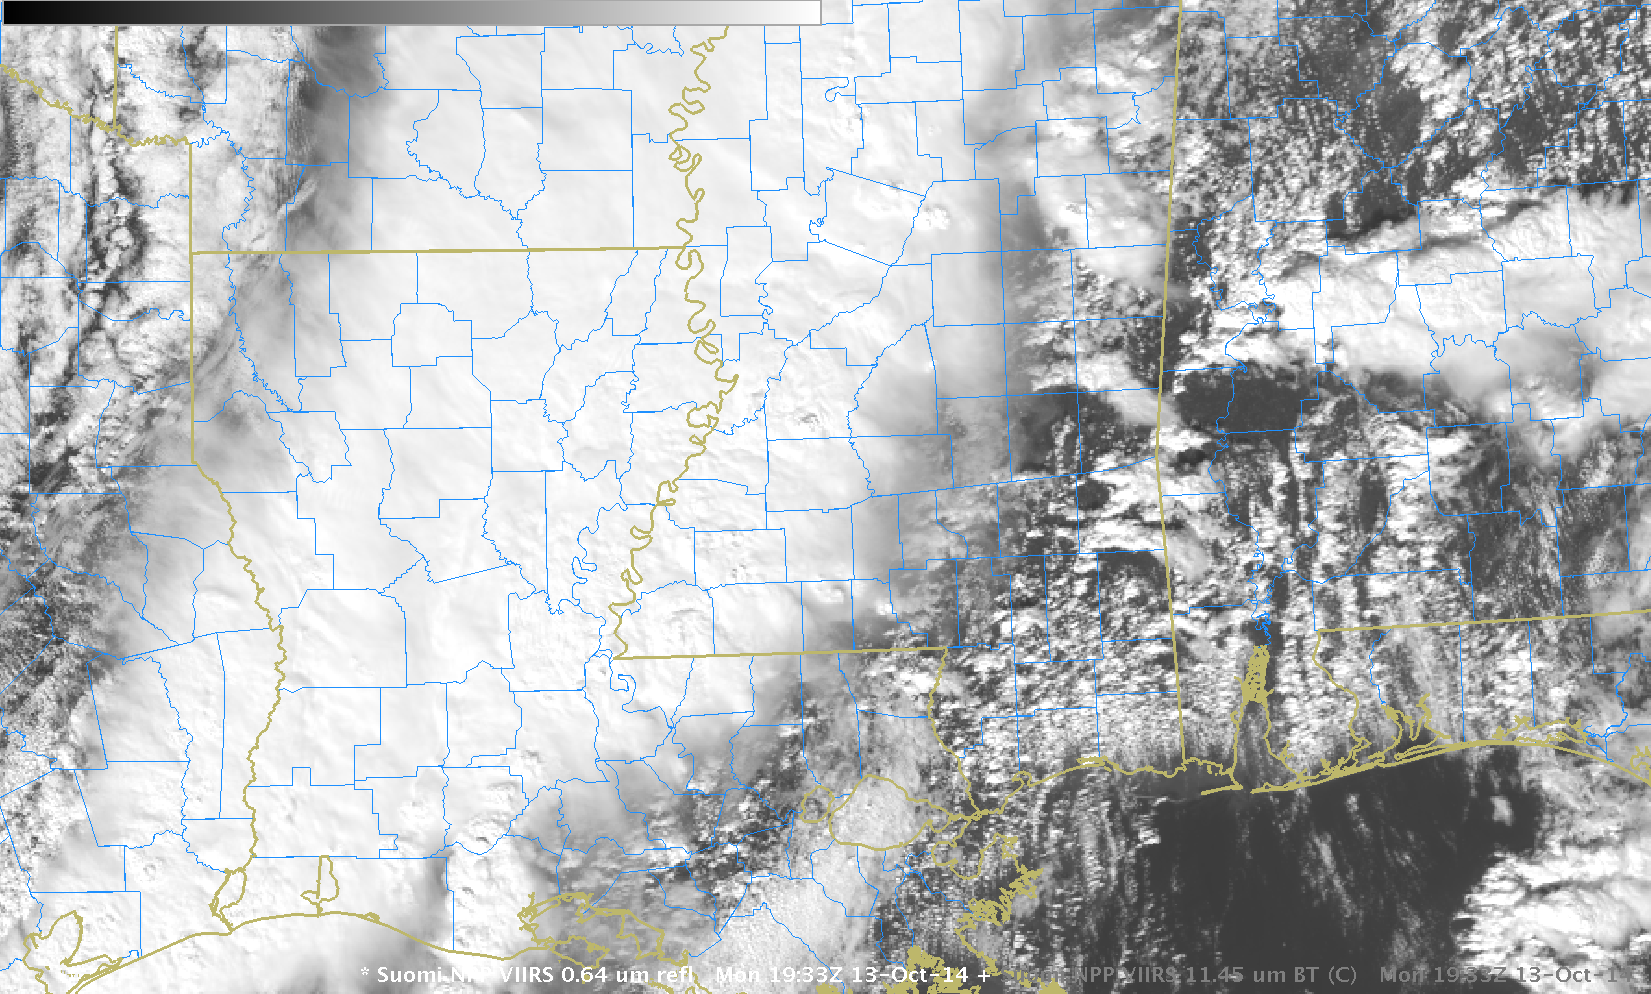
An intense extratropical cyclone over the central United States spawned a Quasi-Linear Convective System that moved through the Deep South on 12-13 October 2014; the QLCS was responsible for a spate of severe weather including wind damage, hail and tornadoes (Storm reports from 12 October, 13 October). The image above, from 1933 UTC on 13 October, shows Suomi NPP 11.35 µm imagery over Mississippi. Widespread cold cloud tops are apparent, with embedded overshooting tops. Indeed, the top in southern Hinds County may have been associated with severe Hail. Visible imagery from Suomi NPP (link) also show overshooting tops. The amount of solar reflectance at mid-day, however, makes it difficult to identify all features. The 1.61 µm imagery, below, is darker because ice crystals at cloud top will absorb some energy at that wavelength, yet most features are still recognizable.
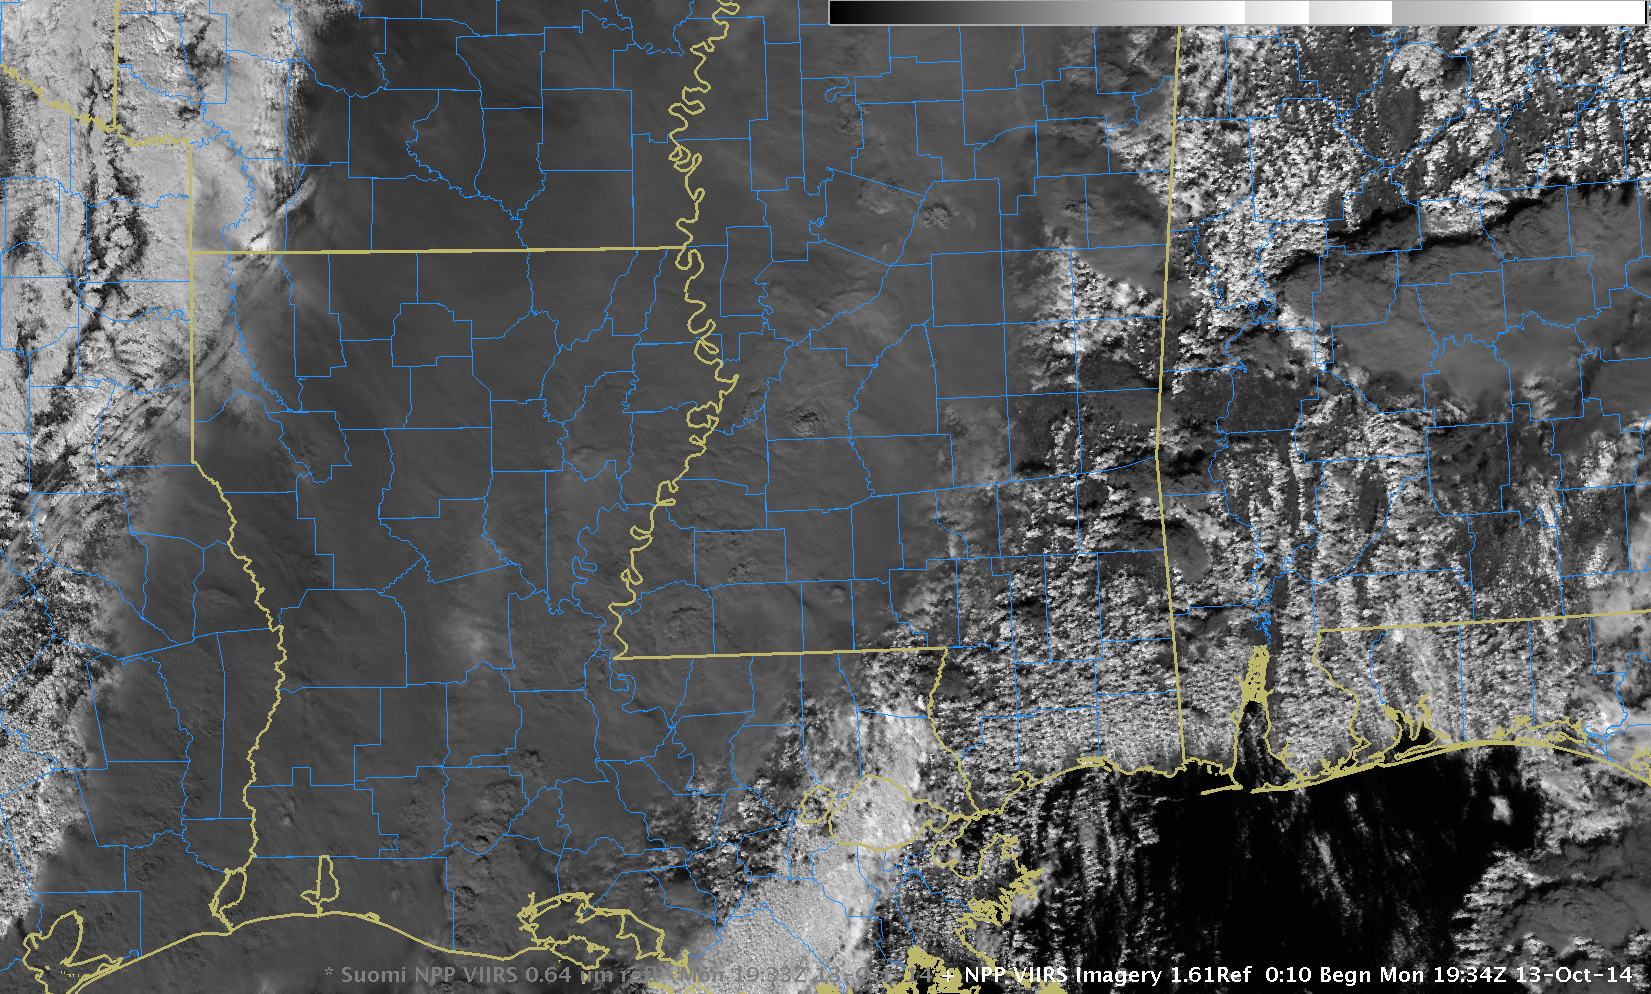
Suomi NPP 1.61 µm Near-Infrared Imagery, 1933 UTC 13 October 2014 (click to enlarge)
The GOES-13 Water Vapor Animation, below, is a textbook example of cyclogenesis. Strong sinking in and around the comma head is indicated by the warm water vapor brightness temperatures observed there. This system is also characterized by a very sharp upstream trough and developing warm conveyor belt that turns anticyclonic as it moves over the upper Great Lakes.
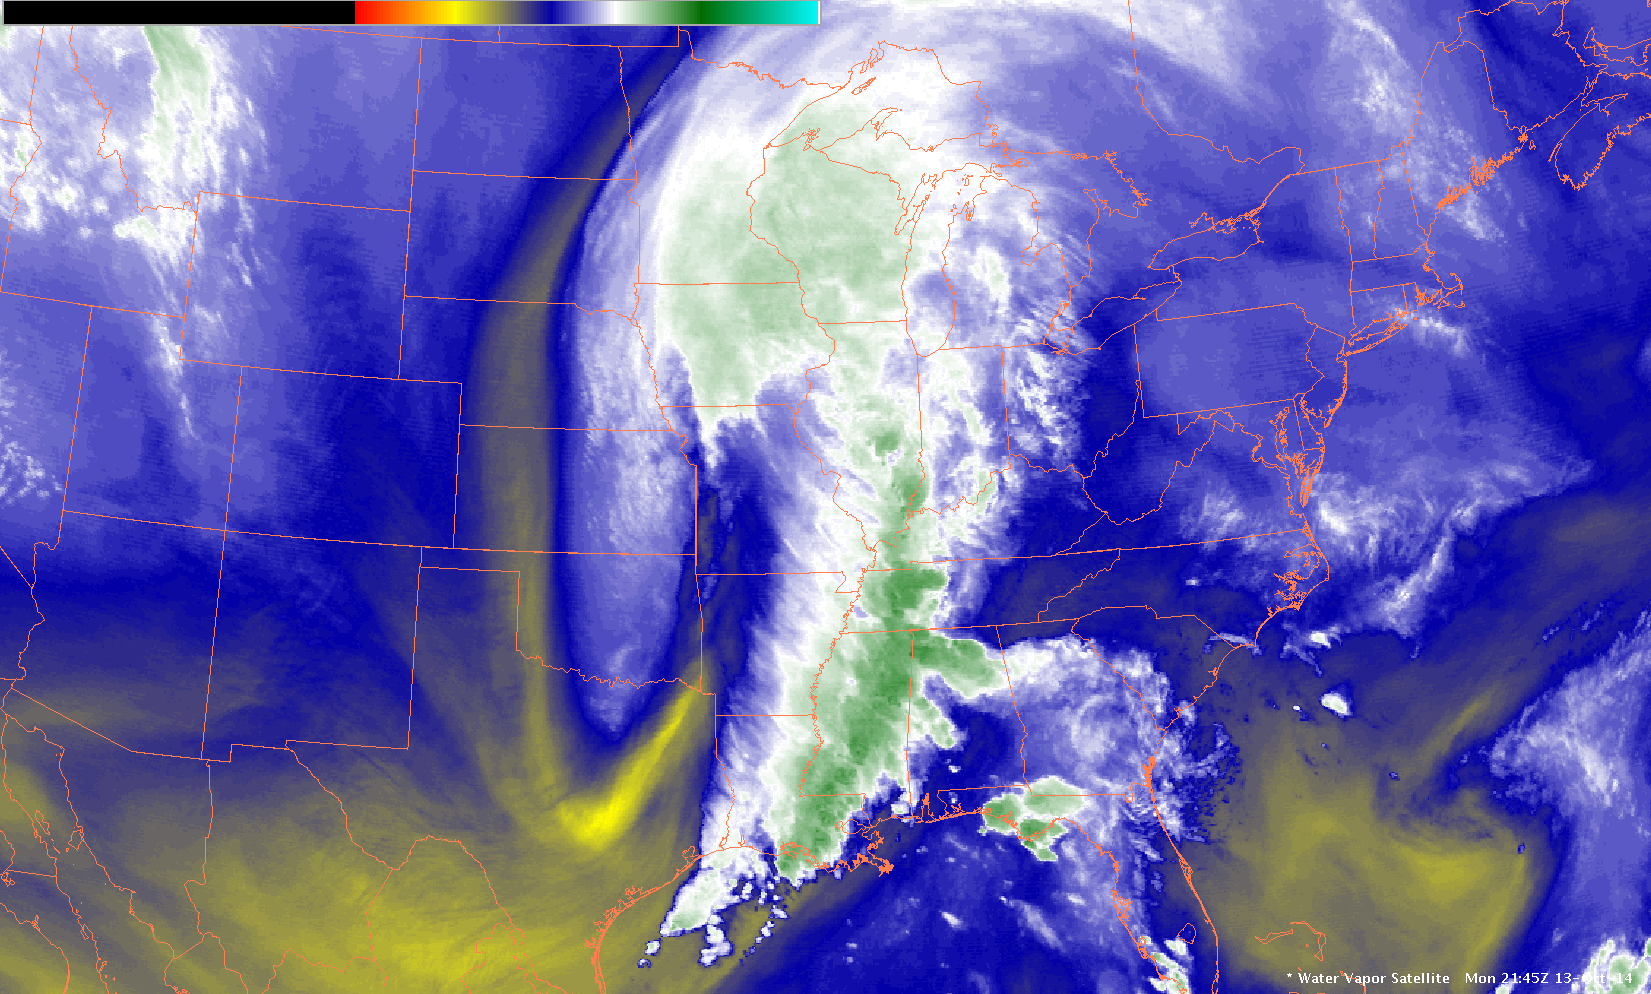
GOES-13 Water Vapor 6.7 µm Infrared Imagery, 1200-2100 UTC 13 October (click to animate)
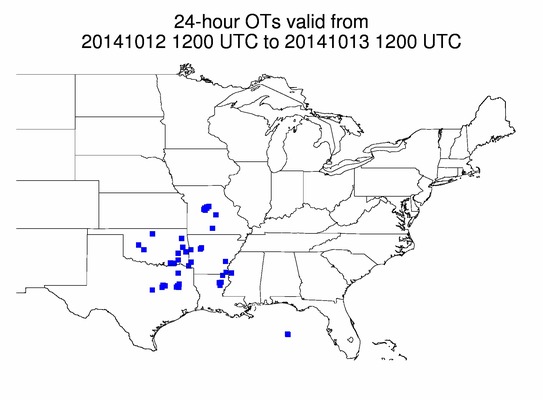
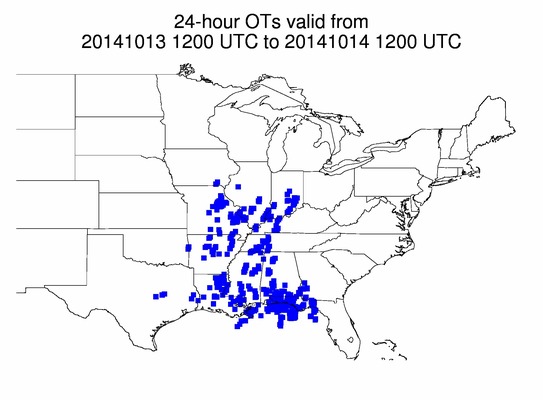
GOES-13 10.7 infrared imagery animation, below (also available here as an mp4 file or here as a YouTube video), shows evidence of many overshooting tops in the strong thunderstorms that developed across the deep south. (Indeed, automatic detection of overshooting tops — (and cumulative totals from this website) — show some on the 12th, but many more on the 13th) as the extratropical cyclone became organized.
GOES-13 10.7 µm Infrared Imagery, 1600 UTC 13 October – 0700 UTC 14 October 2014 (click to animate)
The strong system enjoyed a vigorous moisture feed from the Gulf of Mexico, as shown in the MIMIC Total Precipitable Water animation below. Moisture surged northward especially after 1200 UTC on 13 October, and the 24-hour precipitation totals ending at 1200 UTC on 14 October (from this site) showed heavy rain over much of Tennessee and Alabama (and adjacent states).
MIMIC Total Precipitable Water for 72 hours 1200 UTC 14 October 2014 (click to enlarge)
GOES Sounder data also shows a quick moistening on 13 October as high Precipitable Water air over the Gulf of Mexico surges northward. Moisture from Pacific Hurricane Simon is unlikely to be a contributing factor to this storm.
MIMIC Total Precipitable Water for 72 hours 1200 UTC 14 October 2014 (click to enlarge)
=======================================================================================
MTSAT-2 and GOES-15 Water Vapor (6.5 µm)Infrared imagery, times as indicated (click to enlarge)
An interesting question arises: Where did some of the energy and moisture for this (somewhat early in the season) storm originate? Water Vapor imagery from MTSAT-2 and GOES-15 show clearly that the Super-Typhoon Phanfone, that was near Japan on 4-5 October, contributed some of the energy to the impulse that moved across the Pacific Ocean and then over the Ridge on the West Coast of North America before diving southeast and forcing cyclogenesis. In the animation above, Phanfone approaches Japan, and is picked up by a mid-latitude jet that crosses the Pacific (tracked by red arrow), induces strong cyclogenesis in the Gulf of Alaska on 8 October and then continues up and over the ridge on the west coast of North America.
View only this post
Read Less


