Advanced Dvorak Technique (ADT) intensity estimate plot for Ana
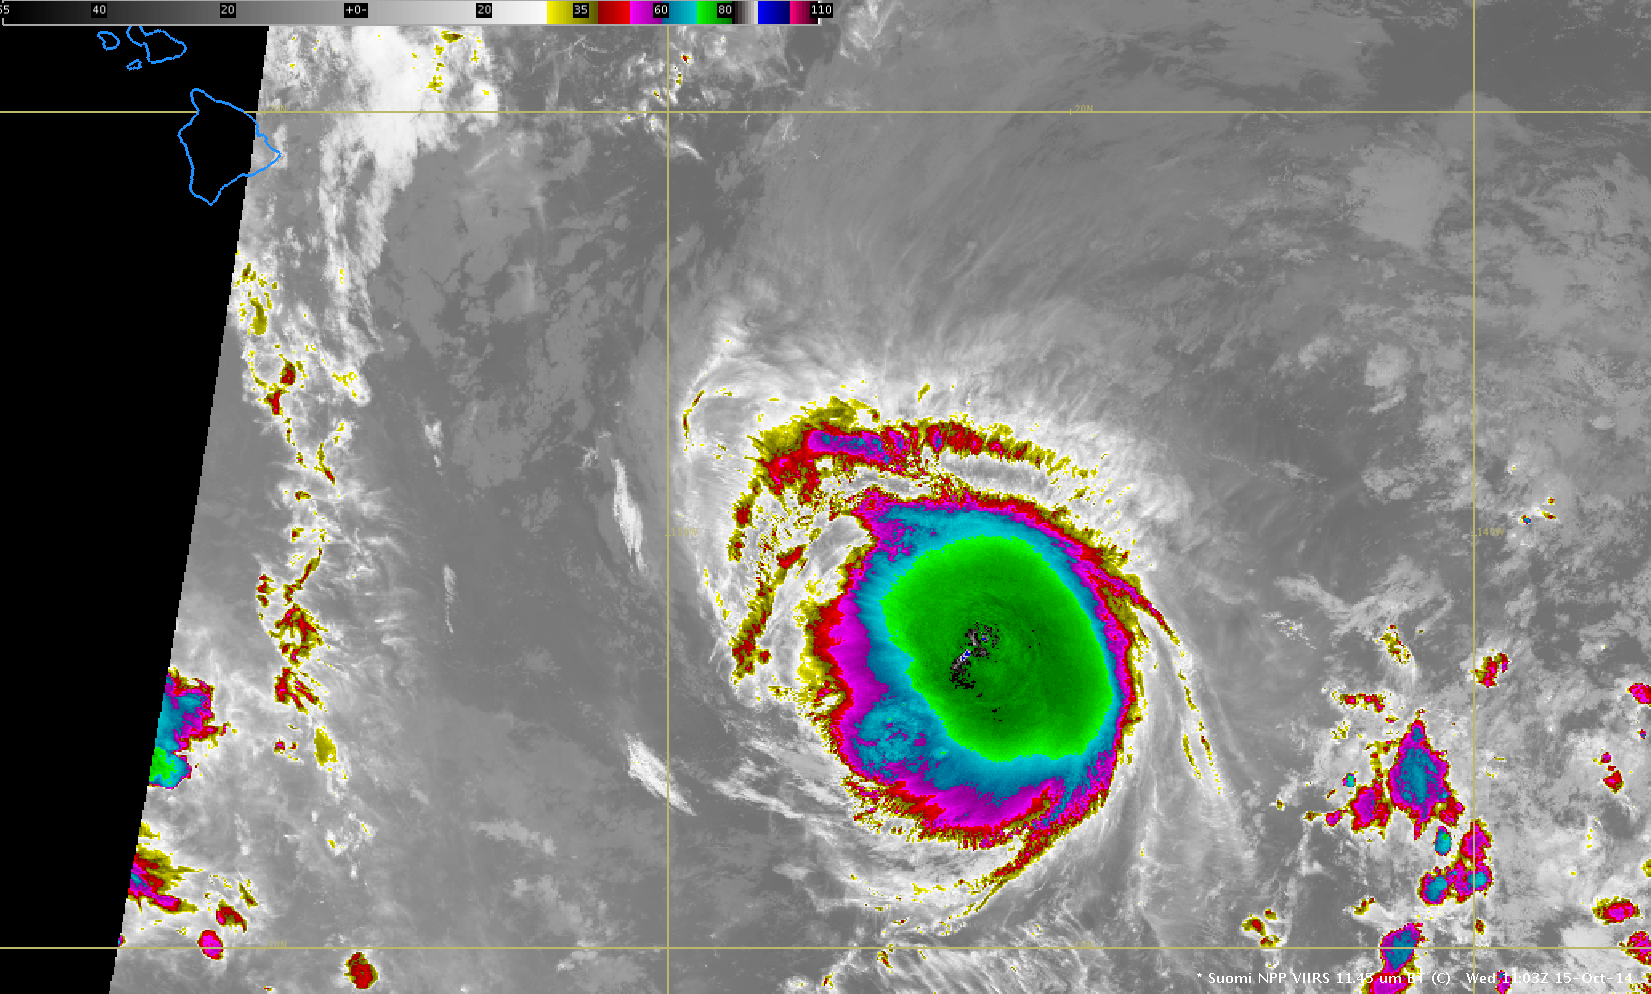
A plot of the Advanced Dvorak Technique (ADT) intensity estimate for Ana (above) shows that the strength of the tropical cyclone fluctuated during its multi-day lifetime (storm track), initially becoming a strong Tropical Storm on 15 October, weakening on 16 October, and then slowly intensifying into a Category 1 Hurricane. A sequence of Suomi NPP VIIRS 11.45 µm IR channel images (below; click image to play animation) shows Ana at various stages during the 15-21 October period; the coldest cloud-top IR brightness temperature seen was -95º C at 00:40 UTC on 19 October.
Suomi NPP VIIRS 11.45 µm IR channel images (click to play animation)
After prior testing of additional Rapid Scan Operations (RSO) capabilities, the GOES-15 satellite was placed into RSO mode over the Hawai’i region to monitor Ana. During the 17-19 October period that Ana was classified as a Hurricane, GOES-15 10.7 µm IR channel images (below; click image to play a 75 MB animated GIF; also available as an MP4 movie file) revealed a number of robust convective bursts, with some exhibiting cloud-top IR brightness temperatures in the -80 to -85º C range (violet color enhancement). This was the first operational implementation of GOES-West RSO imagery over the Hawai’i region since the early 1990s, and the higher frequency of images — 8 images per hour, instead of the routine 4 images per hour — proved to be helpful for monitoring Ana (CPHC forecast discussion).
Longer-term animations of GOES-15 RSO imagery covering the lifetime of Ana are available in YouTube format (IR | visible). Much of the Hawaiian Islands received heavy rain, with amounts in excess of 11 inches reported on Hawai’i and Oahu.

GOES-15 10.7 µm IR channel images (click to play animated GIF)
Even after Ana was downgraded to a Tropical Storm early on 20 October, a Suomi NPP VIIRS 11.45 µm IR image showed that cloud-top IR brightness temperatures were still as cold as -90º C (yellow pixels within the violet-enhanced cloud tops). Also note the presence of cloud-top gravity waves propagating outward away from the storm center.
Suomi NPP VIIRS 11.45 µm IR channel image, with overlays of surface analysis and surface observations
Late in the day on 20 October, GOES-15 0.63 µm visible channel images (below; click to play animation; also available as an MP4 movie file) revealed that the Low-Level Circulation Center (LLCC) of Ana became exposed as it moved to the southwest from beneath the canopy of deep convective cloud tops. This was a result of moderate southwesterly deep-layer wind shear across the region.
GOES-15 0.63 µm visible channel images (click to play animation)
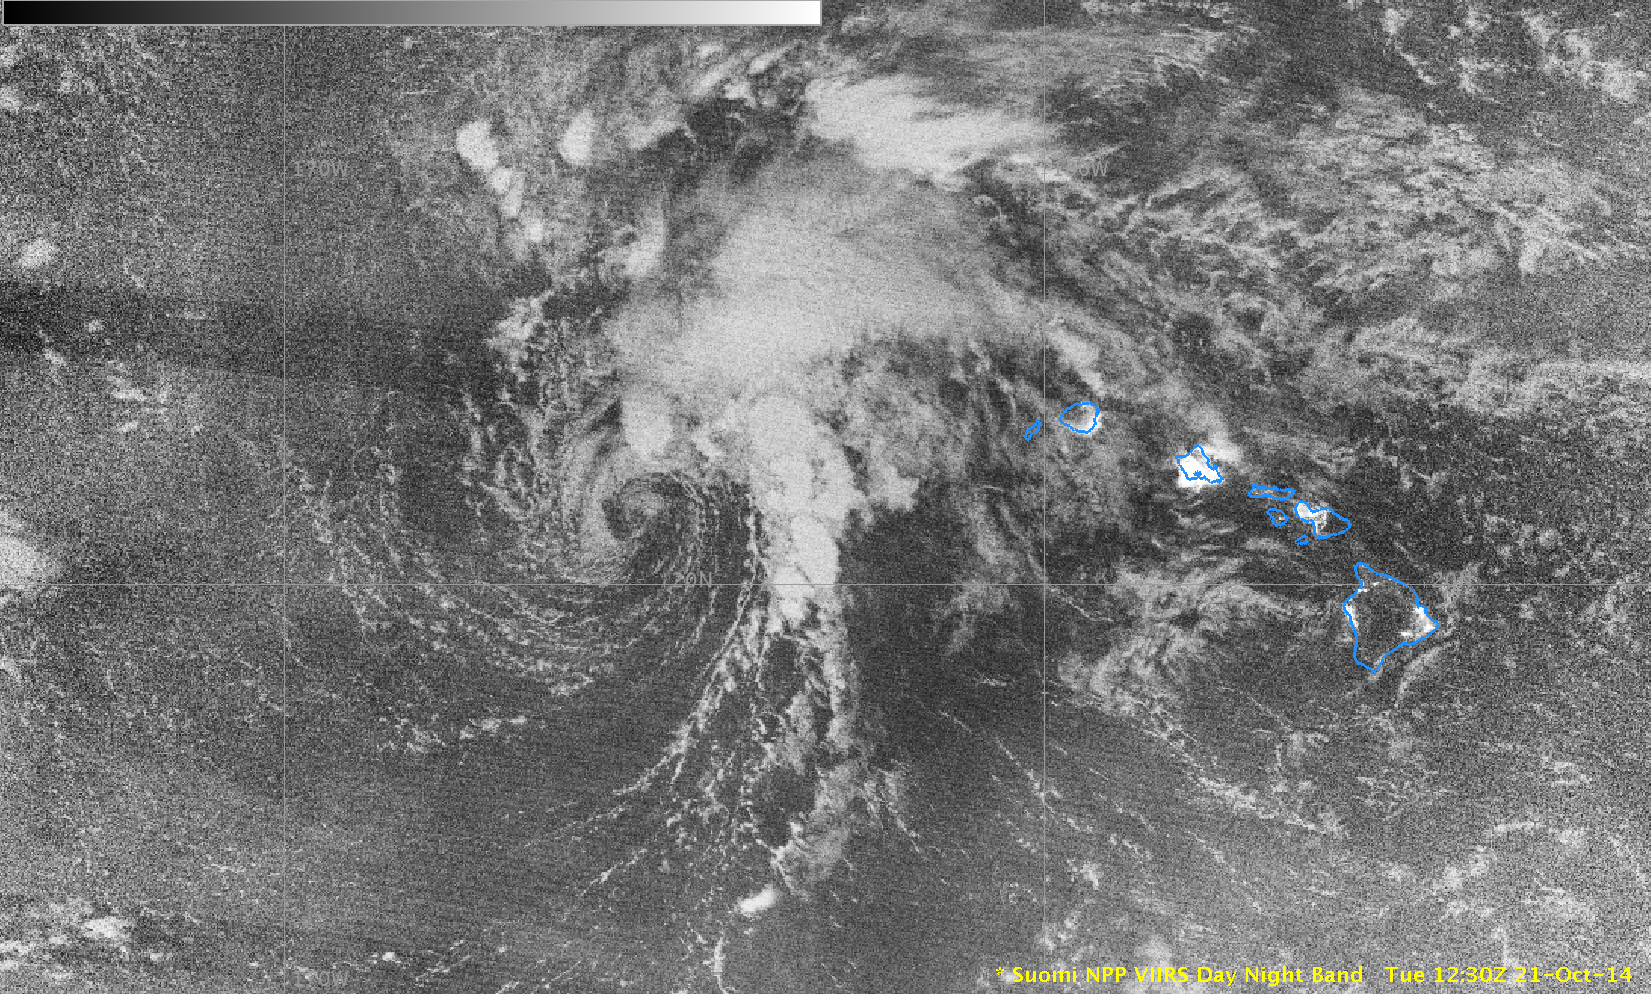
During the following night, the exposed LLCC was still very apparent on a Suomi NPP VIIRS 0.7 µm Day/Night Band image at 12:30 UTC or 2:30 am local time (below).
View only this post Read Less


