Suomi NPP 0.7 µm Day Night Band imagery at 0907 and 1048 UTC over central California with surface observations of ceilings and visibilities (click to enlarge)
The Suomi NPP VIIRS Day Night Band during a Full (or near-Full) Moon yields striking visible imagery at night because of abundant reflected lunar illumination. Sequential orbits along the west coast of the Pacific on the morning of 10 October showed the penetration of coastal stratus and fog inland at two times (click here for the images above without the surface observations). A similar case study from 9 October is shown here. The slow inland penetration of stratus/fog is captured by the scenes: tendrils of fog extend up small valleys along the edge of the Salinas Valley, for example, and the fog extends farther down the valley at 1048 UTC. Similar expansion of fog occurs over Sonoma Valley north of San Francisco Bay.
Careful inspection of the imagery shows parallel lines along the western edge at 0907 UTC and along the eastern edge at 1048 UTC. In addition, city lights and topographic features are displaced somewhat along the eastern edge of the 1048 UTC image. These are all artifacts of the VIIRS instrument viewing geometry (that is, parallax) and post-processing that is necessary near the edges to maintain high-resolution imagery there.
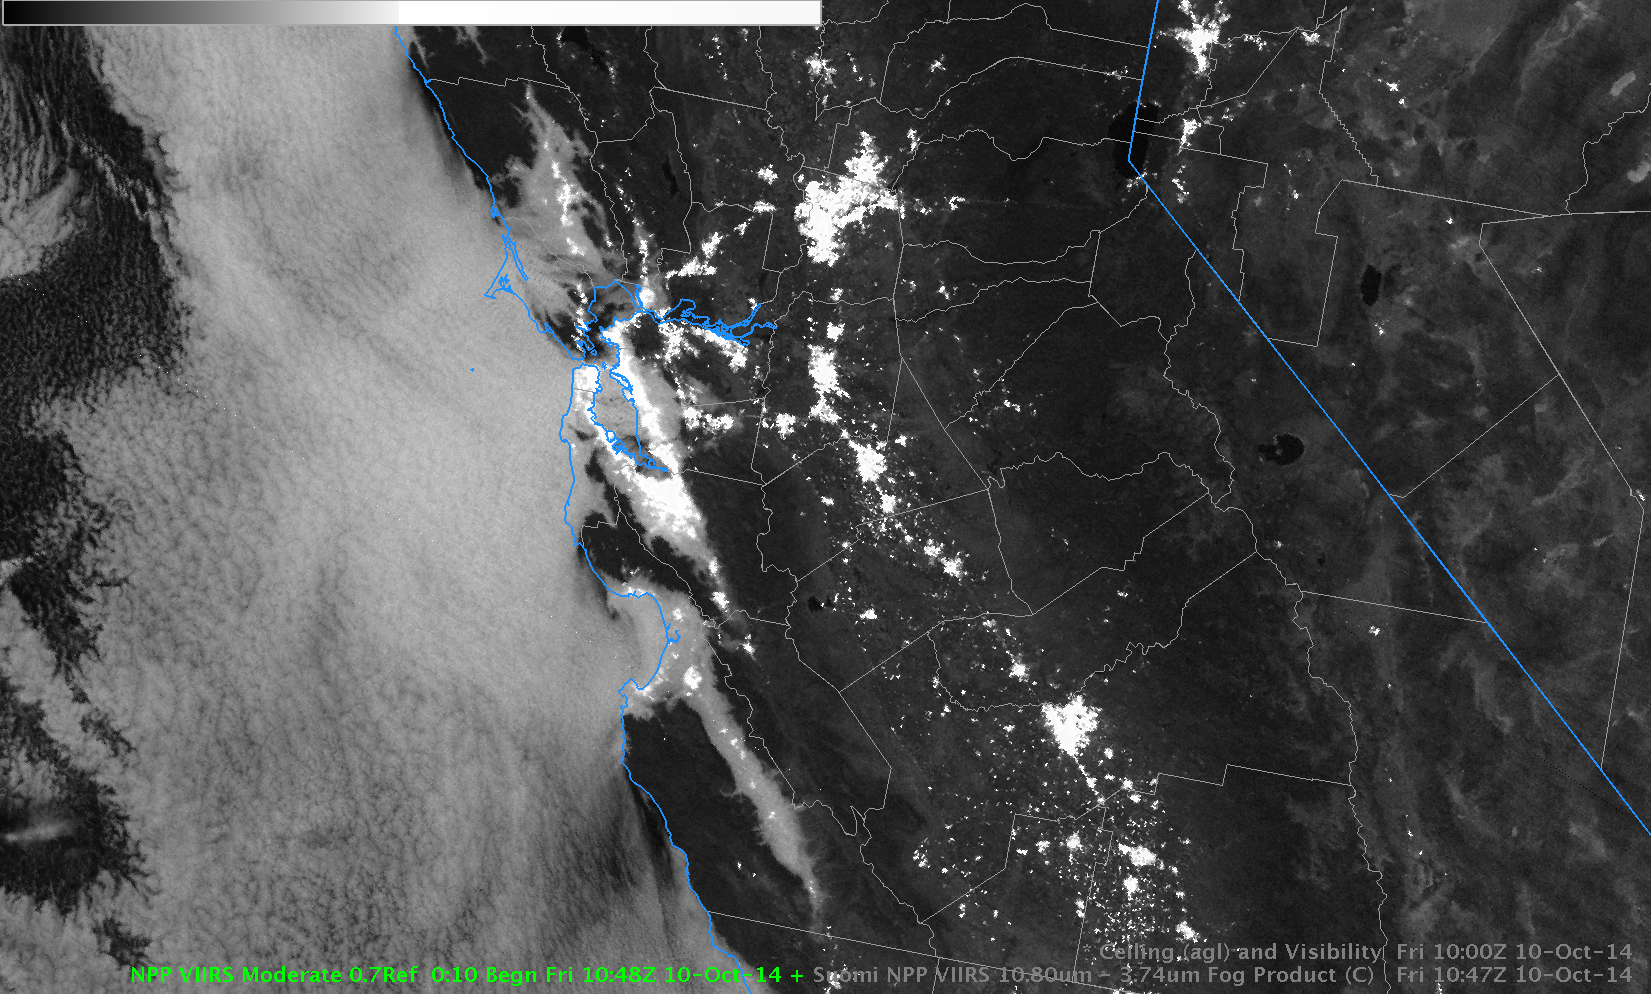
A toggle between the corresponding VIIRS 11.45 µm – 3.74 µm infrared brightness temperature difference images (commonly referred to as the “fog/stratus product”), below, similarly shows gradual expansion of water-based clouds between 0907 and 1048 UTC. There are also image features, color enhanced as black, that suggest very thin cirrus is moving over the coast. These clouds are thin enough that they cannot be discerned in the Day Night Band imagery, but their presence nevertheless inhibits the detection of low clouds in places, such as over the southernmost part of the Salinas Valley at 1048 UTC.
Suomi NPP Brightness Temperature Difference (11.45 µm – 3.74 µm) Imagery at 0907 and 1048 UTC over central California (click to enlarge)
Suomi NPP 0.7 µm visible Day Night Band imagery at 0907 and 1048 UTC over Washington State with surface observations of ceilings and visibilities (click to enlarge)
The image toggle above shows similar features over Washington State. Fog/stratus tendrils move up river valleys in the ~90 minutes between the two polar-orbiting satellite passes, and areas of fog increase in size. (click here for the same images without observations). Because the first image is very near the edge of the VIIRS instrument scan swath, there is also a shift in city lights and some geographic features, again an artifact of scanning geometry (parallax) and the post-processing to maintain high-resolution imagery at the scan edges.
Suomi NPP Brightness Temperature Difference (11.45 µm – 3.74 µm) Imagery at 0907 and 1048 UTC over Washington State (click to enlarge)
The IR brightness temperature difference product over Washington, above, also shows evidence of a slow increase in the areal coverage of fog/stratus near the coast. The effects of limb brightening are also present in the first image. When a satellite scans near the edge of its domain, the path from the point on the Earth to the satellite traverses more of the upper atmosphere, and a colder sensed temperature results. This effect is wavelength-dependent. For example, at one point (47º N, 125º W) in the stratus (with fairly uniform temperature) off the west coast of the Washington, in the stratus (which should have a fairly constant temperature), brightness temperatures were about 1º C cooler in 11.35 µm imagery, but closer to 2.5º C cooler in the 3.74 µm imagery. Hence, the brightness temperature difference signal is larger at 0906 UTC.
Both brightness temperature difference fields show signals over dry land that are related to emissivity differences in the soils. These occur over central Washington, above and over Nevada in the images centered over California.
View only this post Read Less


