A disorganized subtropical system (Invest Area 90L) located over the southwest Atlantic to the east of Georgia and north of the Bahamas has the potential to become the first named system of the 2015 Atlantic Tropical Season (if named as a subtropical storm, this would be Ana). Visible imagery, above,... Read More
GOES-13 0.63 µm Visible images (click to play animation)
A disorganized subtropical system (Invest Area 90L) located over the southwest Atlantic to the east of Georgia and north of the Bahamas has the potential to become the first named system of the 2015 Atlantic Tropical Season (if named as a subtropical storm, this would be Ana). Visible imagery, above, shows a low-level swirl that is separated from any convection. However, during the 6 hours of the animation, the low-level swirl moves westward, moving more closely to active convection over the Gulf Stream. [Update, 2100 UTC 7 May: later images in the visible animation, above, showed strong convection developing over the surface circulation; another visible image animation with ship reports can be seen here]
Sea-surface temperatures (link) and wind shear (link) from the CIMSS Tropical Cyclones site show nominal conditions for strengthening.
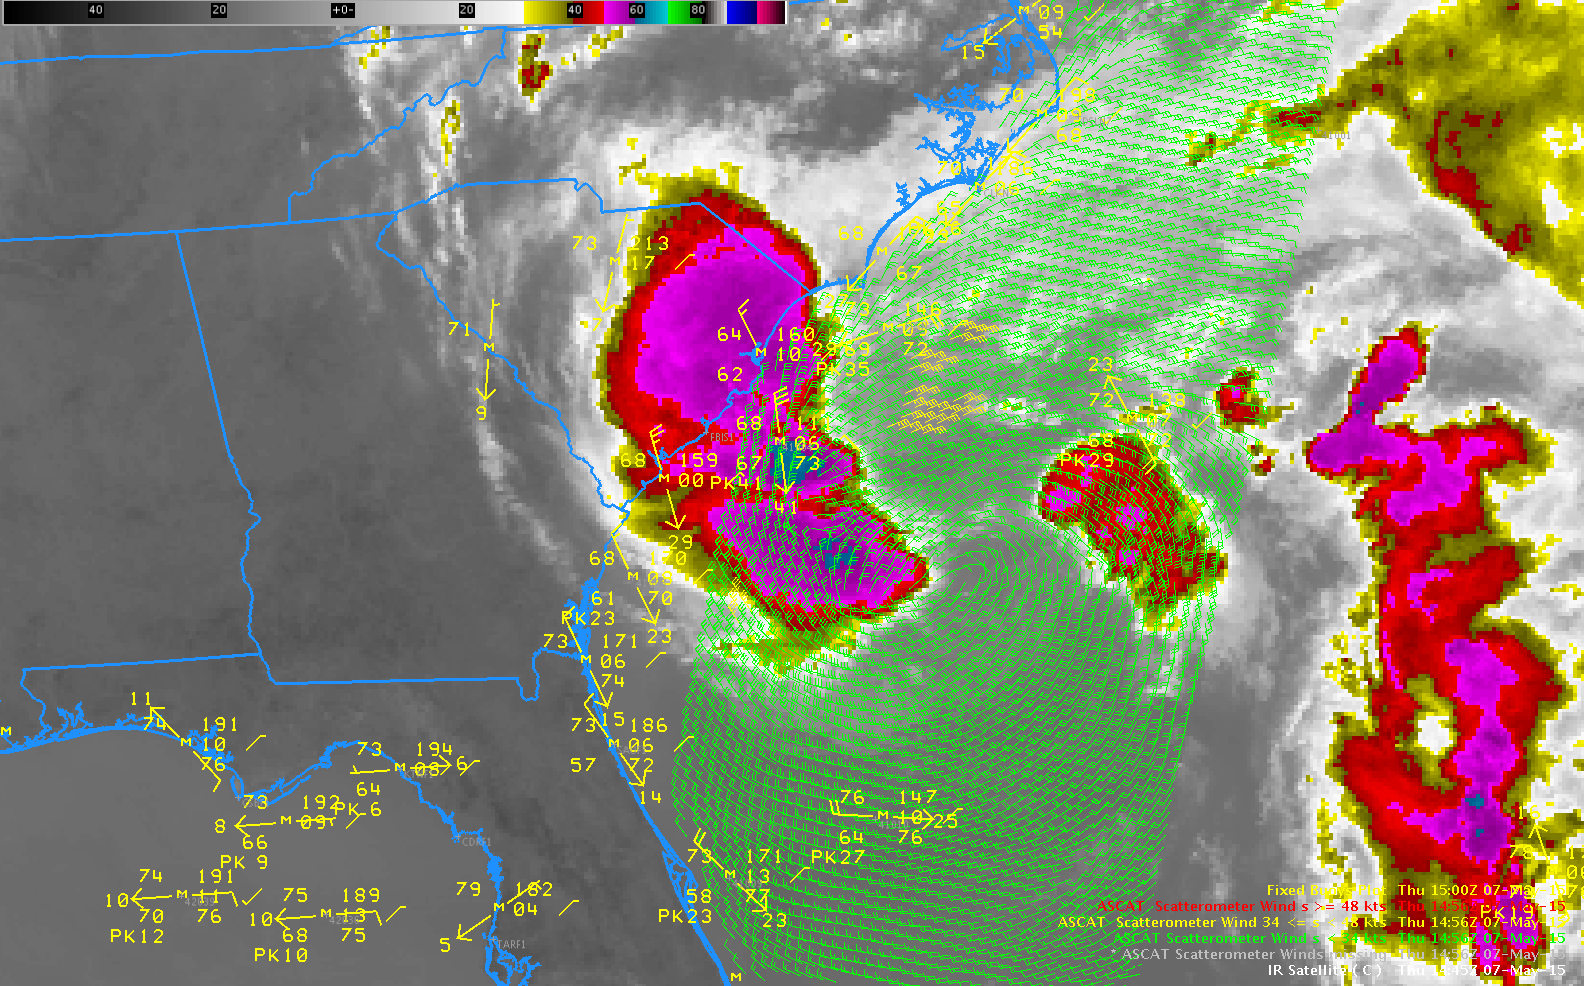
MetOp-A passed over the southeast United States just after 1500 UTC on 7 May. The ASCAT scatterometer data (below) show a well-defined low-level circulation (with most winds just below tropical storm force) south and east of the deepest convection off the South Carolina/Georgia coasts.

ASCAT winds from Metop-A and GOES-13 10.7 µm imagery, both near 1500 UTC on 7 May 2015; Surface observations from Fixed Buoys are also plotted (click to enlarge)
Suomi NPP overflew this system at 0700 UTC on 7 May, and imagery from the VIIRS Day/Night Band gave information that allowed a definitive estimate of the location of a low-level circulation. A comparison of the 0702 imagery, below, and the 1826 UTC imagery, following, shows changes in the organization and vertical structure of the developing system.
Suomi NPP 11.45 µm infrared and 0.70 µm DayNight band visible imagery at 0702 UTC on 7 May 2015 (click to enlarge)
As above, but at 1826 UTC on 7 May 2015 (click to enlarge)
Suomi NPP 1.61 µm near-infrared imagery can be used during the day to identify cirrus clouds: ice particles absorb (and do not reflect) radiation in these near-infrared wavelengths, but water droplets reflect. Thus, ice clouds appear dark. In the visible, both water and ice clouds are bright. The toggle below shows the 1.61 and the Visible imagery from Suomi-NPP.
Suomi NPP 1.61 µm near-infrared and 0.65 µm visible imagery at 1826 UTC on 7 May 2015 (click to enlarge)
At 2006 UTC, the International Space Station’s RapidScat instrument provided surface scatterometer winds (below) that depicted the broad circulation of Invest AL90; the strongest winds were located farther away from the center of the feature.
GOES-13 0.63 µm visible image with an overlay of RapidScat surface scatterometer winds
08 May Update: Invest Area AL90 was upgraded to Subtropical Storm Ana by the National Hurricane Center around 02 UTC. A Terra MODIS 11.0 µm IR image at 0249 UTC is shown below, with overlays of the MSLP analysis, buoy reports, and RTMA surface winds.

Terra MODIS 11.0 µm IR channel image, with MSLP analysis, buoy reports, and RTMA surface wind analysis
A few hours later, a 0643 UTC comparison of Suomi NPP VIIRS 11.45 µm IR and 0.7 µm “visible image at night” Day/Night Band data is shown below.
Suomi NPP VIIRS 11.45 µm IR and 0.7 µm Day/Night Band images
For more information on this system, see the National Hurricane Center website.
View only this post
Read Less


