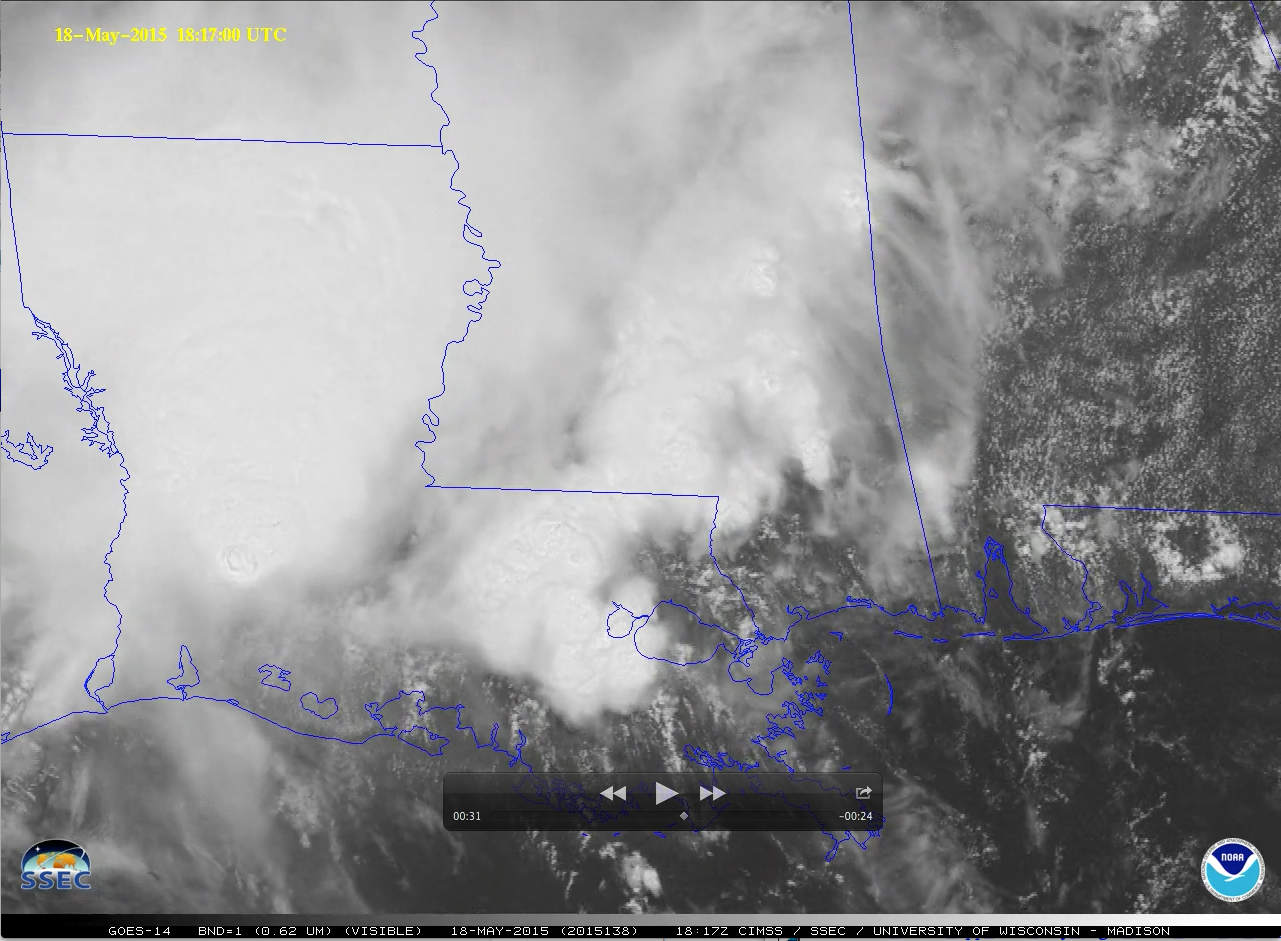
This website works best with a newer web browser such as Chrome, Firefox, Safari or Microsoft Edge. Internet Explorer is not supported by this website.

Hurricane Isaac

Isaac reached Category 1 hurricane intensity mid-day on 28 August 2012. AWIPS images of 1-km resolution visible and IR data from the VIIRS, AVHRR, and MODIS instruments (below) showed curved banding features and convective bursts with overshooting... Read More

Isaac reached Category 1 hurricane intensity mid-day on 28 August 2012. AWIPS images of 1-km resolution visible and IR data from the VIIRS, AVHRR, and MODIS instruments (below) showed curved banding features and convective bursts with overshooting tops, along with cloud top IR brightness temperatures as cold as -86º C.

Suomi NPP VIIRS 0.64 µm visible and 11.45 µm IR images at 18:33 UTC

Suomi NPP VIIRS 0.64 µm visible and 11.45 µm IR images at 18:33 UTC

POES AVHRR 0.86 µm visible and 12.0 µm IR images at 19:25 UTC

POES AVHRR 0.86 µm visible and 12.0 µm IR images at 19:25 UTC

MODIS 0.65 µm visible and 11.0 µm IR images at 19:41 UTC

MODIS 0.65 µm visible and 11.0 µm IR images at 19:41 UTC

McIDAS images of 1-minute interval Super Rapid Scan Operations for GOES-R (SRSOR) 0.63 µm visible channel and 10.7 µm IR channel data (below) showed the detail and temporal evolution of the convective bursts that developed near the center of the circulation of Hurricane Isaac as it made landfall over the Mississippi River delta region along the southeast Louisiana coast around 23:45 UTC.

GOES-14 0.63 µm visible images (click image to play animation)

GOES-14 0.63 µm visible images (click image to play animation)

GOES-14 10.7 µm IR images (click image to play animation)

GOES-14 10.7 µm IR images (click image to play animation)

===== 29 August Update =====

A comparison of night-time AWIPS images of Suomi NPP VIIRS 0.8 µm Day/Night Band data with the corresponding 11.45 µm IR data (below) at 08:29 UTC (3:29 AM local time) showed some spiral banding structure within the eastern semicircle of Isaac, along with an isolated area of deep convection immediately offshore (the minimum IR brightness temperature associated with this feature was -88 C). City lights could be seen in the northwestern portion of the image, where there were breaks in the clouds or only a thin veil of high clouds covered the area.

Suomi NPP VIIRS 0.8 µm Day/Night Band and 11.45 µm IR channel images

Suomi NPP VIIRS 0.8 µm Day/Night Band and 11.45 µm IR channel images

View only this post Read Less

Tropical Cyclone Interaction in the Western Pacific

When two tropical cyclones are within close proximity to each other, they will typically start a rotation around a common center. This interaction, called the Fujiwhara Effect, may be occurring in the image loop above. Typhoon Bolaven approaches Typhoon Tembin, and the distance between the two reaches a minimum on... Read More

MTSAT-2 10.8 µm infrared imagery (click image to animate)

MTSAT-2 10.8 µm infrared imagery (click image to animate)

When two tropical cyclones are within close proximity to each other, they will typically start a rotation around a common center. This interaction, called the Fujiwhara Effect, may be occurring in the image loop above. Typhoon Bolaven approaches Typhoon Tembin, and the distance between the two reaches a minimum on 23 August, after which time Tembin moves west and Bolaven moves northwest. Subsequent to Bolaven’s recurvature over the Korean peninsula, Tembin moves northward into midlatitudes as well.

850-mb vorticity maps from CIMSS Tropical Weather Website (click image to animate)

850-mb vorticity maps from CIMSS Tropical Weather Website (click image to animate)

The CIMSS Tropical Website includes 850-mb vorticity analyses. A 10-day loop that shows the motion of Tembin and Bolaven is shown above.

View only this post Read Less

Day-Night Band Imagery of Isaac

The Day-Night Band on VIIRS, flying on the Suomi/NPP satellite gave an excellent view of Isaac at strong tropical storm strength in the northern Gulf of Mexico shortly after midnight on August 28 2012. VIIRS is providing something unique to forecasters: Visible imagery at night that allows easy identification of overshooting... Read More

Suomi/NPP VIIRS Day-Night Band and 11.45 µm infrared channel (click image to toggle between images)

Suomi/NPP VIIRS Day-Night Band and 11.45 µm infrared channel (click image to toggle between images)

The Day-Night Band on VIIRS, flying on the Suomi/NPP satellite gave an excellent view of Isaac at strong tropical storm strength in the northern Gulf of Mexico shortly after midnight on August 28 2012. VIIRS is providing something unique to forecasters: Visible imagery at night that allows easy identification of overshooting tops and cirrus blow-off, and cumulus fields in the Gulf of Mexico. The infrared window channel on VIIRS showed coldest cloud-top temperatures of -84 C, and also the effects of dry air on the tropical system. Convection is suppressed in the northern half of the storm. A zoomed-in annotated version of the above VIIRS image comparison is available here.

VIIRS data used to produce these images was acquired by the X/L band antenna here at CIMSS in Wisconsin, and was processed using the Community Satellite Processing Package (CSPP).

GOES-14 0.63 µm visible channel imagery (click image to play animation)

GOES-14 0.63 µm visible channel imagery (click image to play animation)

During the first few hours after sunrise, GOES-14 Super Rapid Scan Operations for GOES-R (SRSOR) visible imagery at 1-minute intervals (above; click image to play animation) showed the development of a number of  convective elements around the center of Isaac’s circulation. After about 14 UTC, the rotation of the low-level circulation of Isaac could be seen as a “clear slot” opened up between areas of convection.

More information on Isaac is available at the National Hurricane Center website, and at the CIMSS Tropical Cyclones site. One-minute imagery of the storm from GOES-14 can downloaded in real time from this website.

View only this post Read Less

Tropical Storm Isaac in the Gulf of Mexico

Tropical Storm Isaac continues a track towards the central Gulf Coast of the United States (See the National Hurricane Center for further information). The GOES-14 animation above, with images shown every 5 minutes over the course of 5 hours, suggests that intensification has not occurred despite the presence of very warm waters (and low... Read More

GOES-14 0.63 µm visible channel and 10.7 µm infrared channel (click image to play animation)

GOES-14 0.63 µm visible channel and 10.7 µm infrared channel (click image to play animation)

Tropical Storm Isaac continues a track towards the central Gulf Coast of the United States (See the National Hurricane Center for further information). The GOES-14 animation above, with images shown every 5 minutes over the course of 5 hours, suggests that intensification has not occurred despite the presence of very warm waters (and low shear) over the Gulf of Mexico. The lack convective clouds over the eastern Gulf suggest the presence of relatively dry air that will inhibit development. Water Vapor imagery from this morning does suggest that any moisture between Isaac and south Florida is relatively shallow in the atmosphere (as evidenced by the warmer temperatures in the Water Vapor channel east and south of Isaac).

VIIRS 11.45 µm brightness temperature

VIIRS 11.45 µm brightness temperature

Convection associated with Isaac does have very cold cloud tops. The 11.45 µm imagery, above, from VIIRS on board Suomi/NPP shows a large area of cloud tops near -80 C.

GOES-14 0.63 µm visible channel at full resolution (click image to play animation)

GOES-14 0.63 µm visible channel at full resolution (click image to play animation)

GOES-14 continues SRSOR operations (as detailed here). The loop above covers a little more than an hour over Isaac on August 27. The region of white that does not move around the Florida Keys is turbid water that has resulted from storm winds. Clouds in the relatively dry air in that region are streaming north. Ongoing deep convection persists near the storm center. A loop from later in the day (below), continues to show dry air east of and very close to the storm center, but improved storm organization nevertheless.

GOES-14 0.63 µm visible channel at full resolution (click image to play animation)

GOES-14 0.63 µm visible channel at full resolution (click image to play animation)

View only this post Read Less