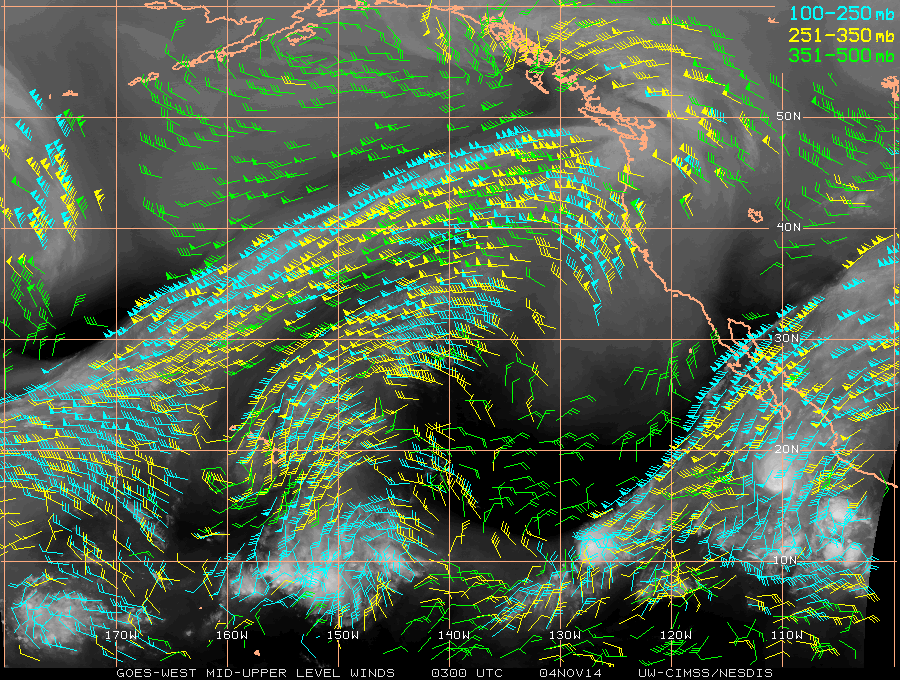
GOES-15 6.5 µm water vapor images and atmospheric motion vector (AMV) winds
As seen on a sequence of 3-hourly GOES-15 (GOES-West) 6.5 µm water vapor images with satellite-derived atmospheric motion vector (AMV) winds from the CIMSS Tropical Cyclones site (above), a weak but persistent trough aloft over the Hawai’i region was acting to destabilize the atmosphere and create an environment conducive to the development of widespread showers and thunderstorms — some of which were producing heavy downpours over parts of the island chain — during the 04-05 November 2014 period.
Due to radar outages, the NWS forecast office in Honolulu HI requested that the GOES-15 satellite be placed into Rapid Scan Operations (RSO) mode (NOAA/NESDIS bulletin), providing 10 images per hour (compared to only 4 per hour during routine operations). An animation of GOES-15 0.63 µm visible channel images (below; click image to play animation) begins at 17:30 UTC with routine 15-minute interval images, and then after 21:30 UTC transitions into the RSO images to demonstrate how the development and motion of features can be more carefully monitored with improved temporal resolution.
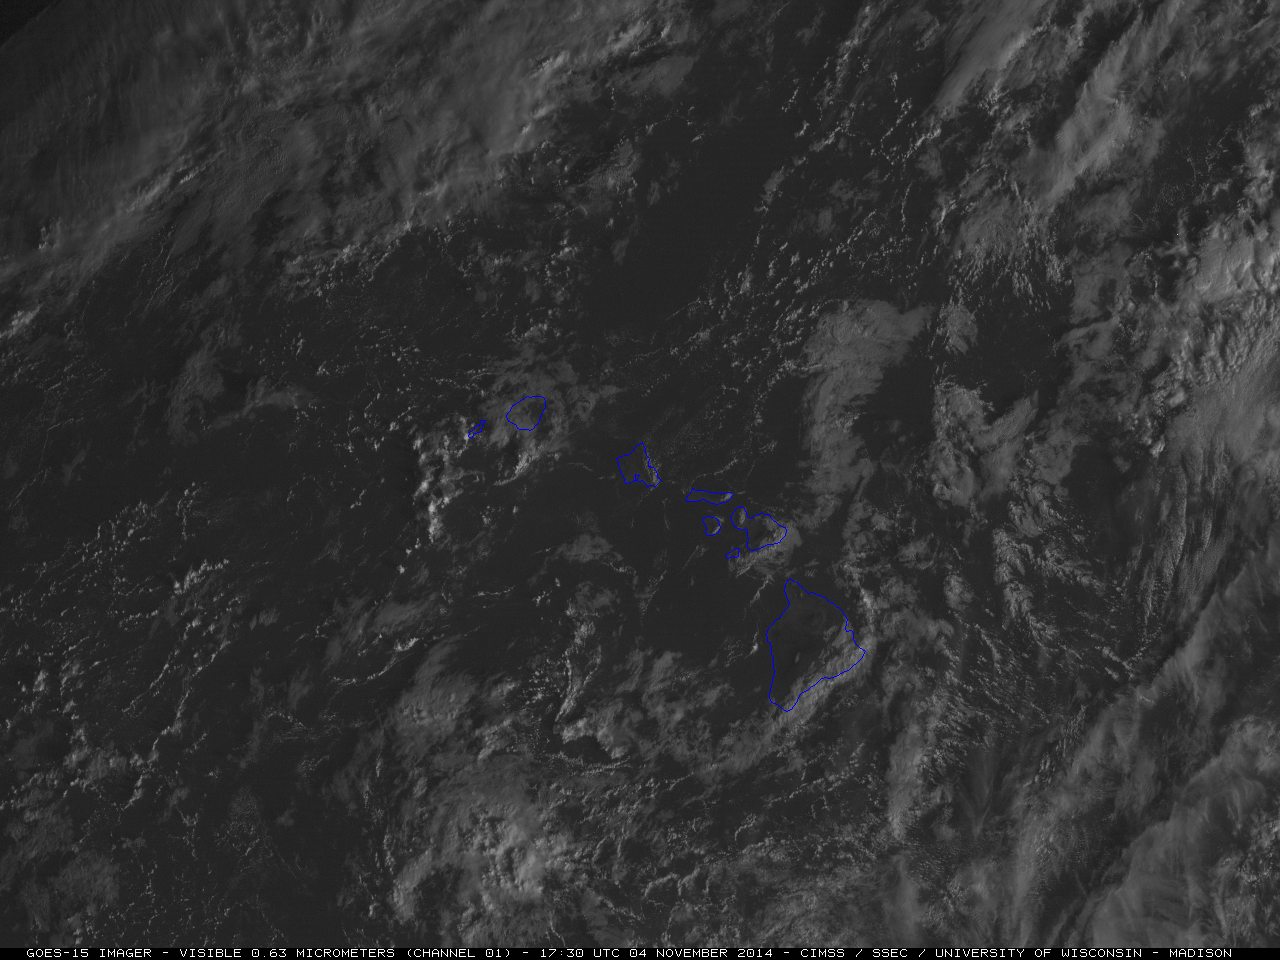
GOES-15 0.63 µm visible channel images (click to play animation)
Additional details on GOES-15 RSO sectors which were implemented during October 2014 can be found here.
View only this post Read Less