The Storm Prediction Center has revised its criteria for initiating GOES Rapid Scan Operations (RSO) calls. Previously, RSO was automatically activated when a Moderate Risk (MDT) appeared in the SPC Day 1 Convective Outlook. On October 1st that was changed per a September email from SPC:Starting October 1, the SPC Lead Forecaster... Read More
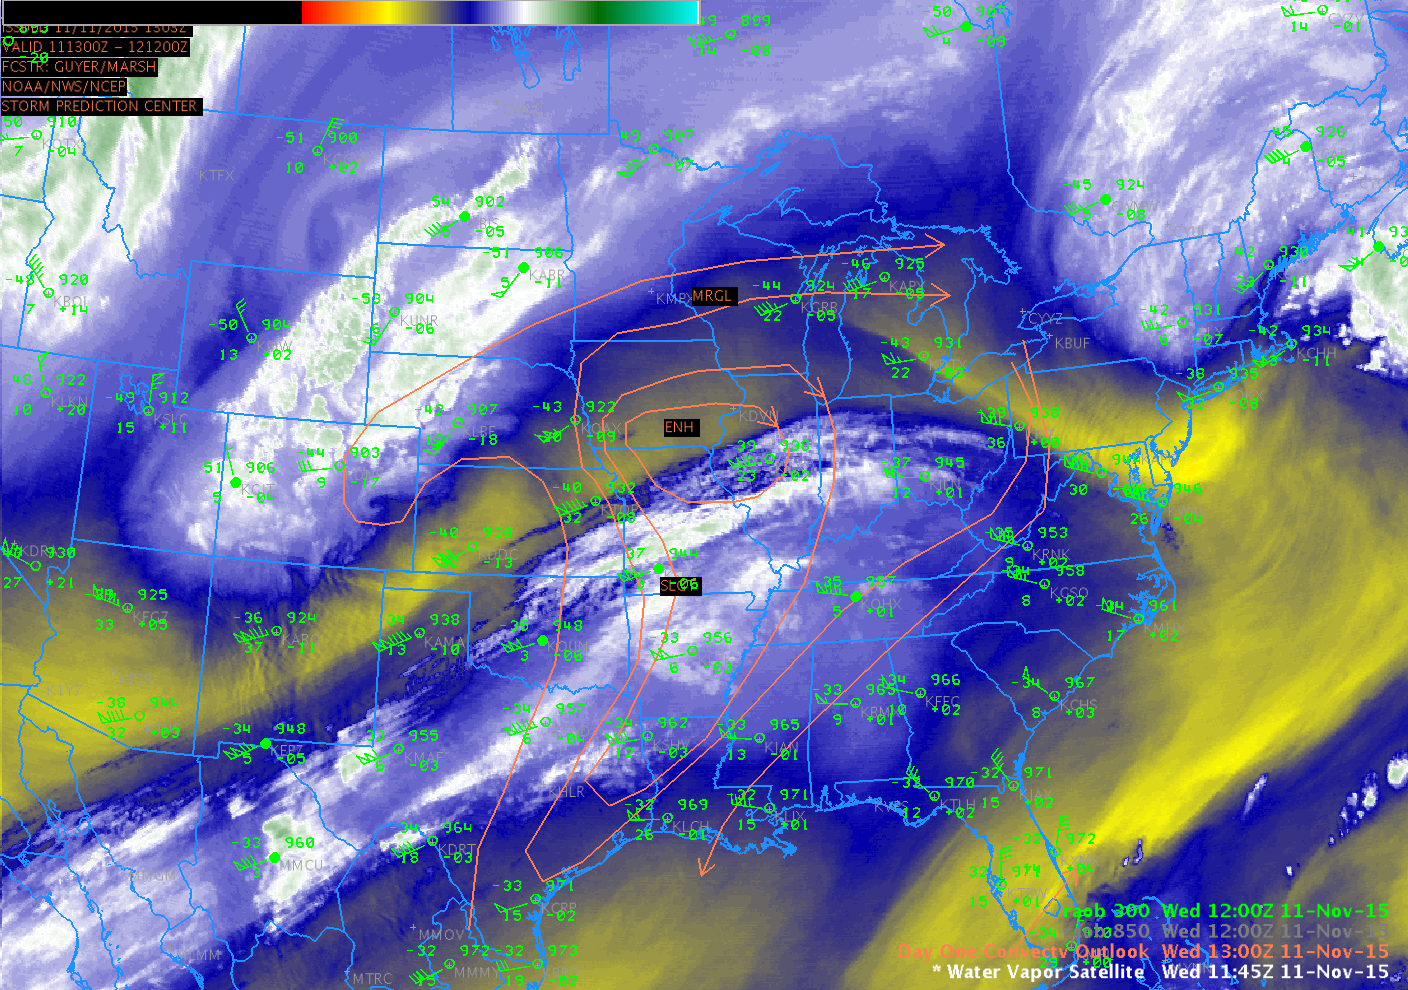
GOES-13 Water Vapor (6.5 µm) infrared imagery with Day 1 Convective Outlook and rawinsonde 850 hPa and 300 hPa observations (Click to enlarge) (Click to enlarge)
The Storm Prediction Center has revised its criteria for initiating GOES Rapid Scan Operations (RSO) calls. Previously, RSO was automatically activated when a Moderate Risk (MDT) appeared in the SPC Day 1 Convective Outlook. On October 1st that was changed per a September email from SPC:
Starting October 1, the SPC Lead Forecaster will contact the NCO/SDM to request GOES RSO whenever a Day 1 Convective Outlook includes an ENH Risk area. Data from the first six months of 2015 suggests SPC would request RSO on approximately 10-20 more days compared to the current MDT Risk criterion. Activating RSO on a more frequent basis using the ENH Risk criterion would improve NWS forecaster situational awareness on convectively active days and help prepare users for much higher temporal frequency GOES-R data.
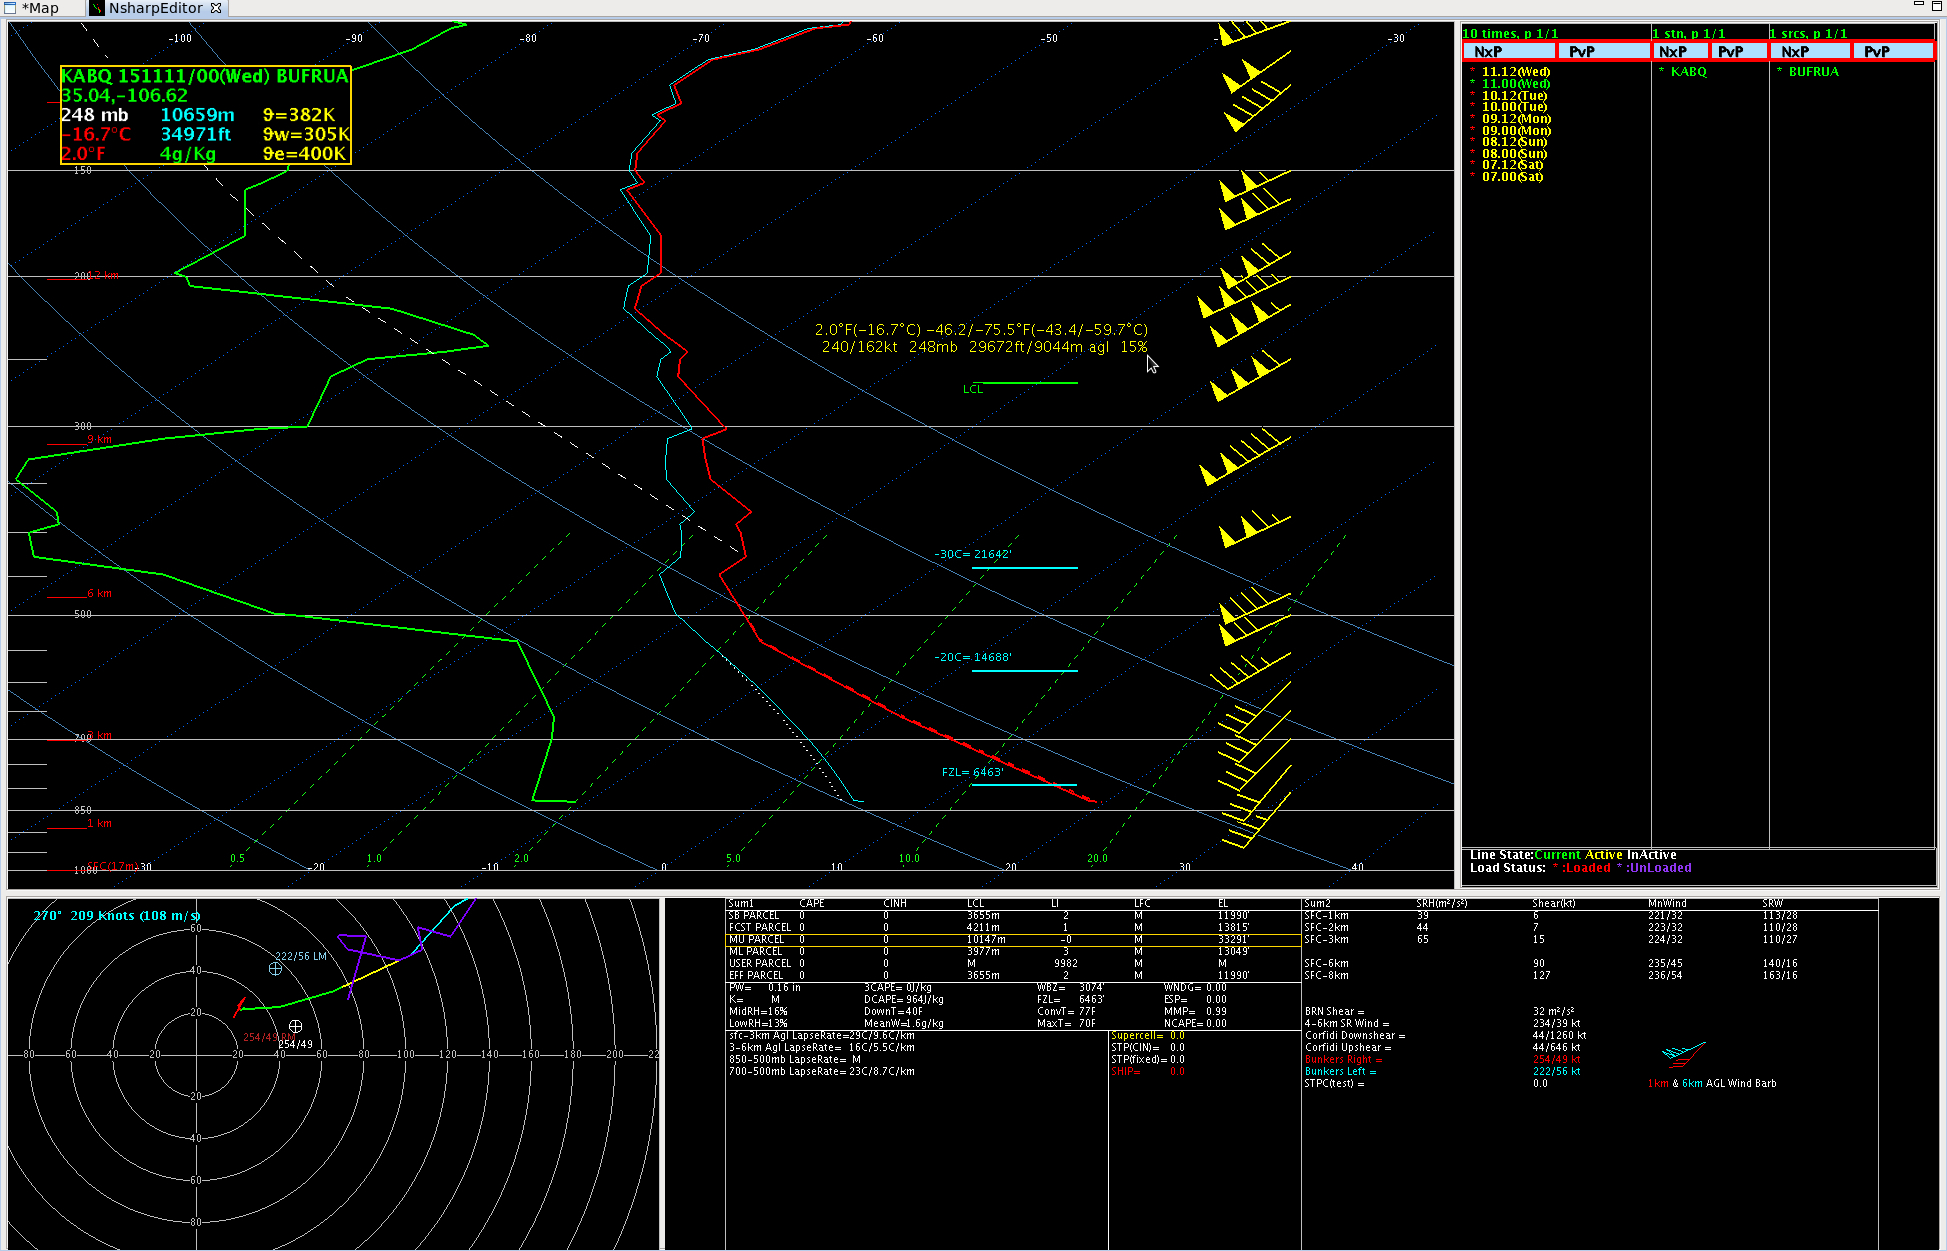
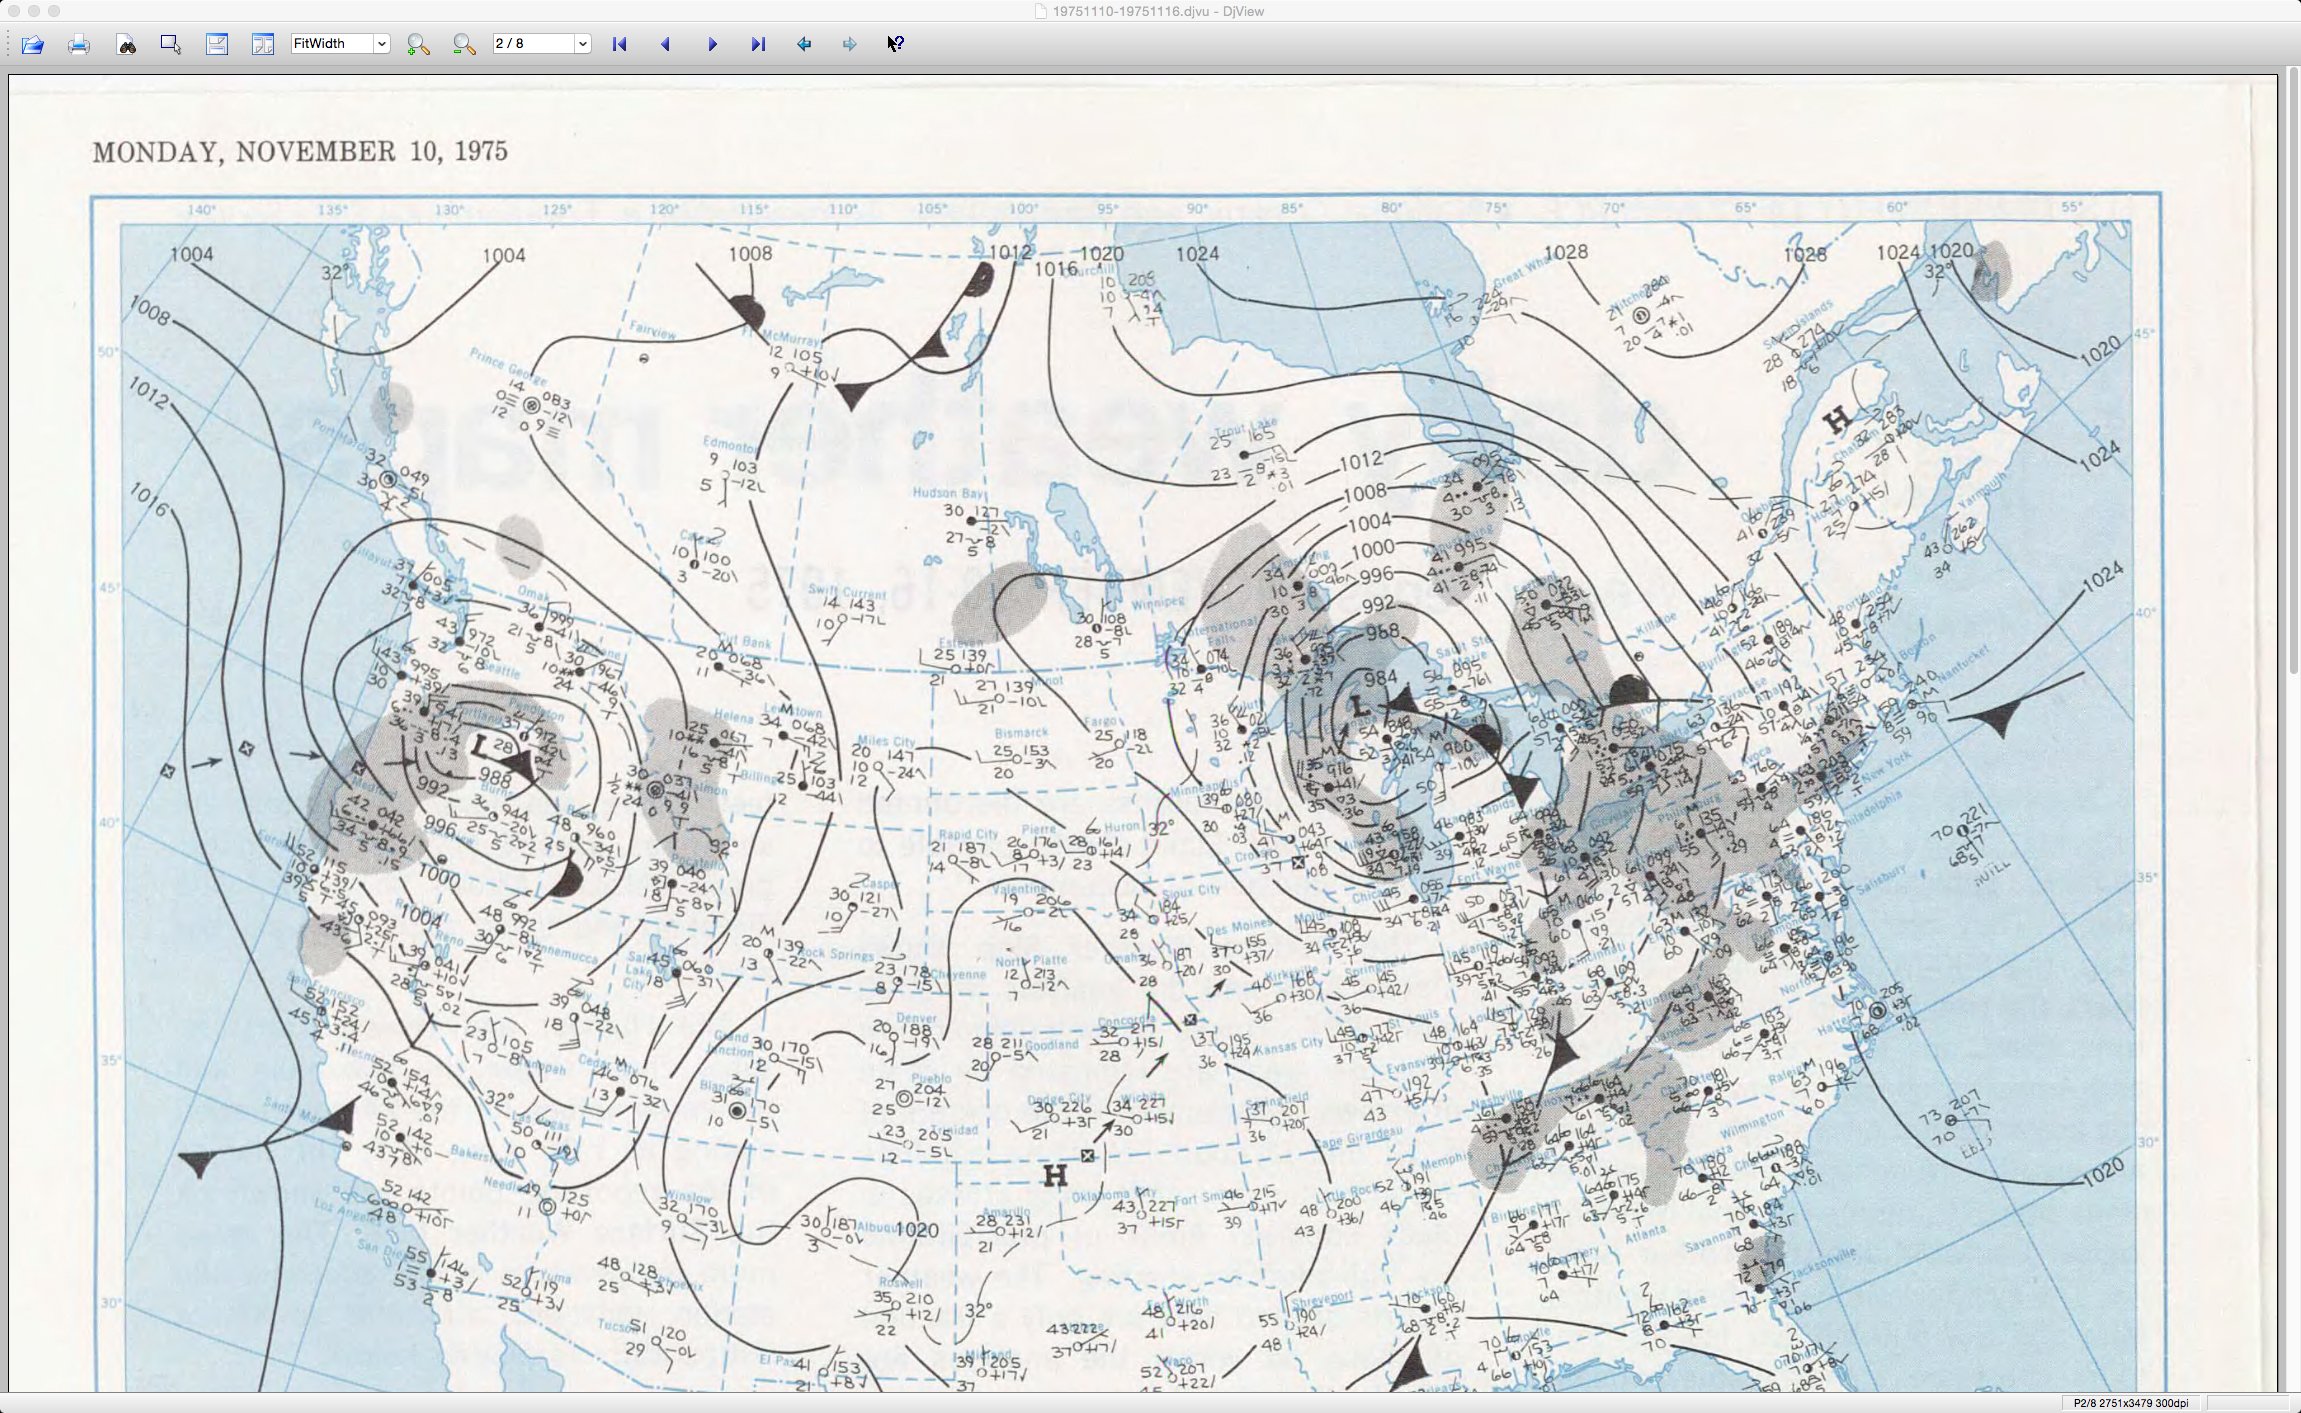
An Enhanced Risk was issued on 11 November 2015 as a strong extratropical cyclone was developing over the midsection of the country. The image above shows the GOES-13 Water vapor imagery from 1145 UTC on 11 November. A strong jet extends from the southwestern United States northeastward. On the previous day (10 November, at 12 UTC) Albuquerque reported 135-knot winds at 300 hPa (and no winds at all at 200 hPa as the balloon was lost to the tracker); at 00 UTC on 11 November, winds were 162 knots just above the 250 hPa level. Strong veering, indicating warm advection, is apparent over the mid-Mississippi River Valley. Low-level warm advection is forecast to increase as the extratropical cyclone intensifies.
Update: GOES-East began RSO at 1545 UTC on 11 November 2015 — a few image animations are shown below.
![GOES-13 Water vapor (6.5 µm) images [click to play animation]](https://cimss.ssec.wisc.edu/satellite-blog/wp-content/uploads/sites/5/2015/11/goes13_water_vapor-20151111_193000.png)
GOES-13 Water vapor (6.5 µm) images [click to play animation]
Of particular interest on 6.5 µm water vapor imagery, above, was the tightly-wrapped signature of the middle-tropospheric vorticity center moving northeastward along the Kansas/Nebraska border.
![GOES-13 Infrared (10.7 µm) images [click to play animation]](https://cimss.ssec.wisc.edu/satellite-blog/wp-content/uploads/sites/5/2015/11/goes13_ir-20151111_200000.png)
GOES-13 Infrared (10.7 µm) images [click to play animation]
The 10.7 µm Infrared images, above, showed the development of thunderstorms across Iowa which exhibited cloud-top IR brightness temperatures in the -50 to -60º C range (yellow to red color enhancement). Hail, damaging winds, and tornadoes were produced by these areas of deep convection (
SPC storm reports).
![GOES-13 Shortwave Infrared (3.9 µm) images [click to play animation]](https://cimss.ssec.wisc.edu/satellite-blog/wp-content/uploads/sites/5/2015/11/goes13_swir-20151111_203020.png)
GOES-13 Shortwave Infrared (3.9 µm) images [click to play animation]
3.9 µm Shortwave Infrared images, above, displayed numerous “hot spots” (black to yellow to red color enhancement) due to fire activity in parts of northeastern Oklahoma and southeastern Kansas.
![GOES-13 Visible (0.63 µm) images [click to play animation]](https://cimss.ssec.wisc.edu/satellite-blog/wp-content/uploads/sites/5/2015/11/goes13_visible-20151111_203000.png)
GOES-13 Visible (0.63 µm) images [click to play animation]
Finally, 0.63 µm Visible channel images, above, showed the hazy signature of smoke plumes from these Kansas/Oklahoma fires (along with a separate plume of blowing dust). In addition, as clouds cleared along the western edge of the storm, swaths of fresh snow cover could be seen over portions of Wyoming, Colorado, South Dakota, Nebraska, and Kansas. As much as 12.5 inches of snow was reported in northeastern Colorado, with wind gusts of 75 mph creating blizzard conditions.
View only this post
Read Less
![MTSAT-2 Infrared (10.8 µm) image with the track of In-fa [click to enlarge]](https://cimss.ssec.wisc.edu/satellite-blog/wp-content/uploads/sites/5/2015/11/151120_TY_In-Fa_track.gif)
![Himawari-8 Visible (0.64 um) images [click to play MP4 animation]](https://cimss.ssec.wisc.edu/satellite-blog/wp-content/uploads/sites/5/2015/11/960x1280_AHIM08_B3_HIM_VIS_IN_FA_2015324_011545_1PANEL.GIF)
![Himawari-8 Infrared (10.4 um) images [click to play MP4 animation]](https://cimss.ssec.wisc.edu/satellite-blog/wp-content/uploads/sites/5/2015/11/960x1280_AHIM08_B13_HIM_IR_IN_FA_2015324_155000_1PANEL.GIF)
![Suomi NPP VIIRS Infrared (11.45 um) and Day/Night Band (0.7 um) images [click to enlarge]](https://cimss.ssec.wisc.edu/satellite-blog/wp-content/uploads/sites/5/2015/11/151120_1547utc_suomi_npp_viirs_ir_dnb_Typhoon_In-Fa_anim.gif)
![DMSP-19 SSMIS microwave (85 GHz) and MTSAT Infrared (10.8 um) images [click to enlarge]](https://cimss.ssec.wisc.edu/satellite-blog/wp-content/uploads/sites/5/2015/11/151120_2130utc_mtsat_ir_dmsp_ssmi_mw_In-fa_anim.gif)
![Himawari-8 Visible (0.64 µm) images [click to play MP4 animation]](https://cimss.ssec.wisc.edu/satellite-blog/wp-content/uploads/sites/5/2015/11/960x1280_AHIM08_B3_HIM_VIS_IN_FA_21NOV_2015324_235945_1PANEL.GIF)
![GOES-15 Visible (0.63 µm) images [click to play animation]](https://cimss.ssec.wisc.edu/satellite-blog/wp-content/uploads/sites/5/2015/11/151115_goes15_visible_CA_tornado_anim.gif)
![GOES-15 Infrared (10.7 µm) images [click to play animation]](https://cimss.ssec.wisc.edu/satellite-blog/wp-content/uploads/sites/5/2015/11/151115_goes15_ir_CA_tornado_anim.gif)
![NOAA-19 Visible (0.63 µm) and Infrared (10.8 µm) images [click to enlarge]](https://cimss.ssec.wisc.edu/satellite-blog/wp-content/uploads/sites/5/2015/11/151115_2115utc_noaa19_visible_ir_CA_tornado_anim.gif)
![Suomi NPP VIIRS Visible (0.64 µm) and Infrared (11.45 µm) images [click to enlarge]](https://cimss.ssec.wisc.edu/satellite-blog/wp-content/uploads/sites/5/2015/11/151115_2147utc_suomi_npp_viirs_visible_ir_Denair_CA_tornado_anim.gif)
![Suomi NPP VIIRS true-color image [click to enlarge]](https://cimss.ssec.wisc.edu/satellite-blog/wp-content/uploads/sites/5/2015/11/151115_2200utc_viirs_truecolor_CA_tornado.jpg)
![GOES-15 sounder Lifted Index derived product images [click to play animation]](https://cimss.ssec.wisc.edu/satellite-blog/wp-content/uploads/sites/5/2015/11/151115_goes15_sounder_li_anim.gif)
![GOES-13 Water vapor (6.5 µm) images [click to play animation]](https://cimss.ssec.wisc.edu/satellite-blog/wp-content/uploads/sites/5/2015/11/151111_goes13_water_vapor_rso_anim.gif)
![GOES-13 Infrared (10.7 µm) images [click to play animation]](https://cimss.ssec.wisc.edu/satellite-blog/wp-content/uploads/sites/5/2015/11/151111_goes13_ir_rso_anim.gif)
![GOES-13 Shortwave Infrared (3.9 µm) images [click to play animation]](https://cimss.ssec.wisc.edu/satellite-blog/wp-content/uploads/sites/5/2015/11/151111_goes13_shortwave_ir_rso_anim.gif)
![GOES-13 Visible (0.63 µm) images [click to play animation]](https://cimss.ssec.wisc.edu/satellite-blog/wp-content/uploads/sites/5/2015/11/151111_goes13_visible_rso_anim.gif)

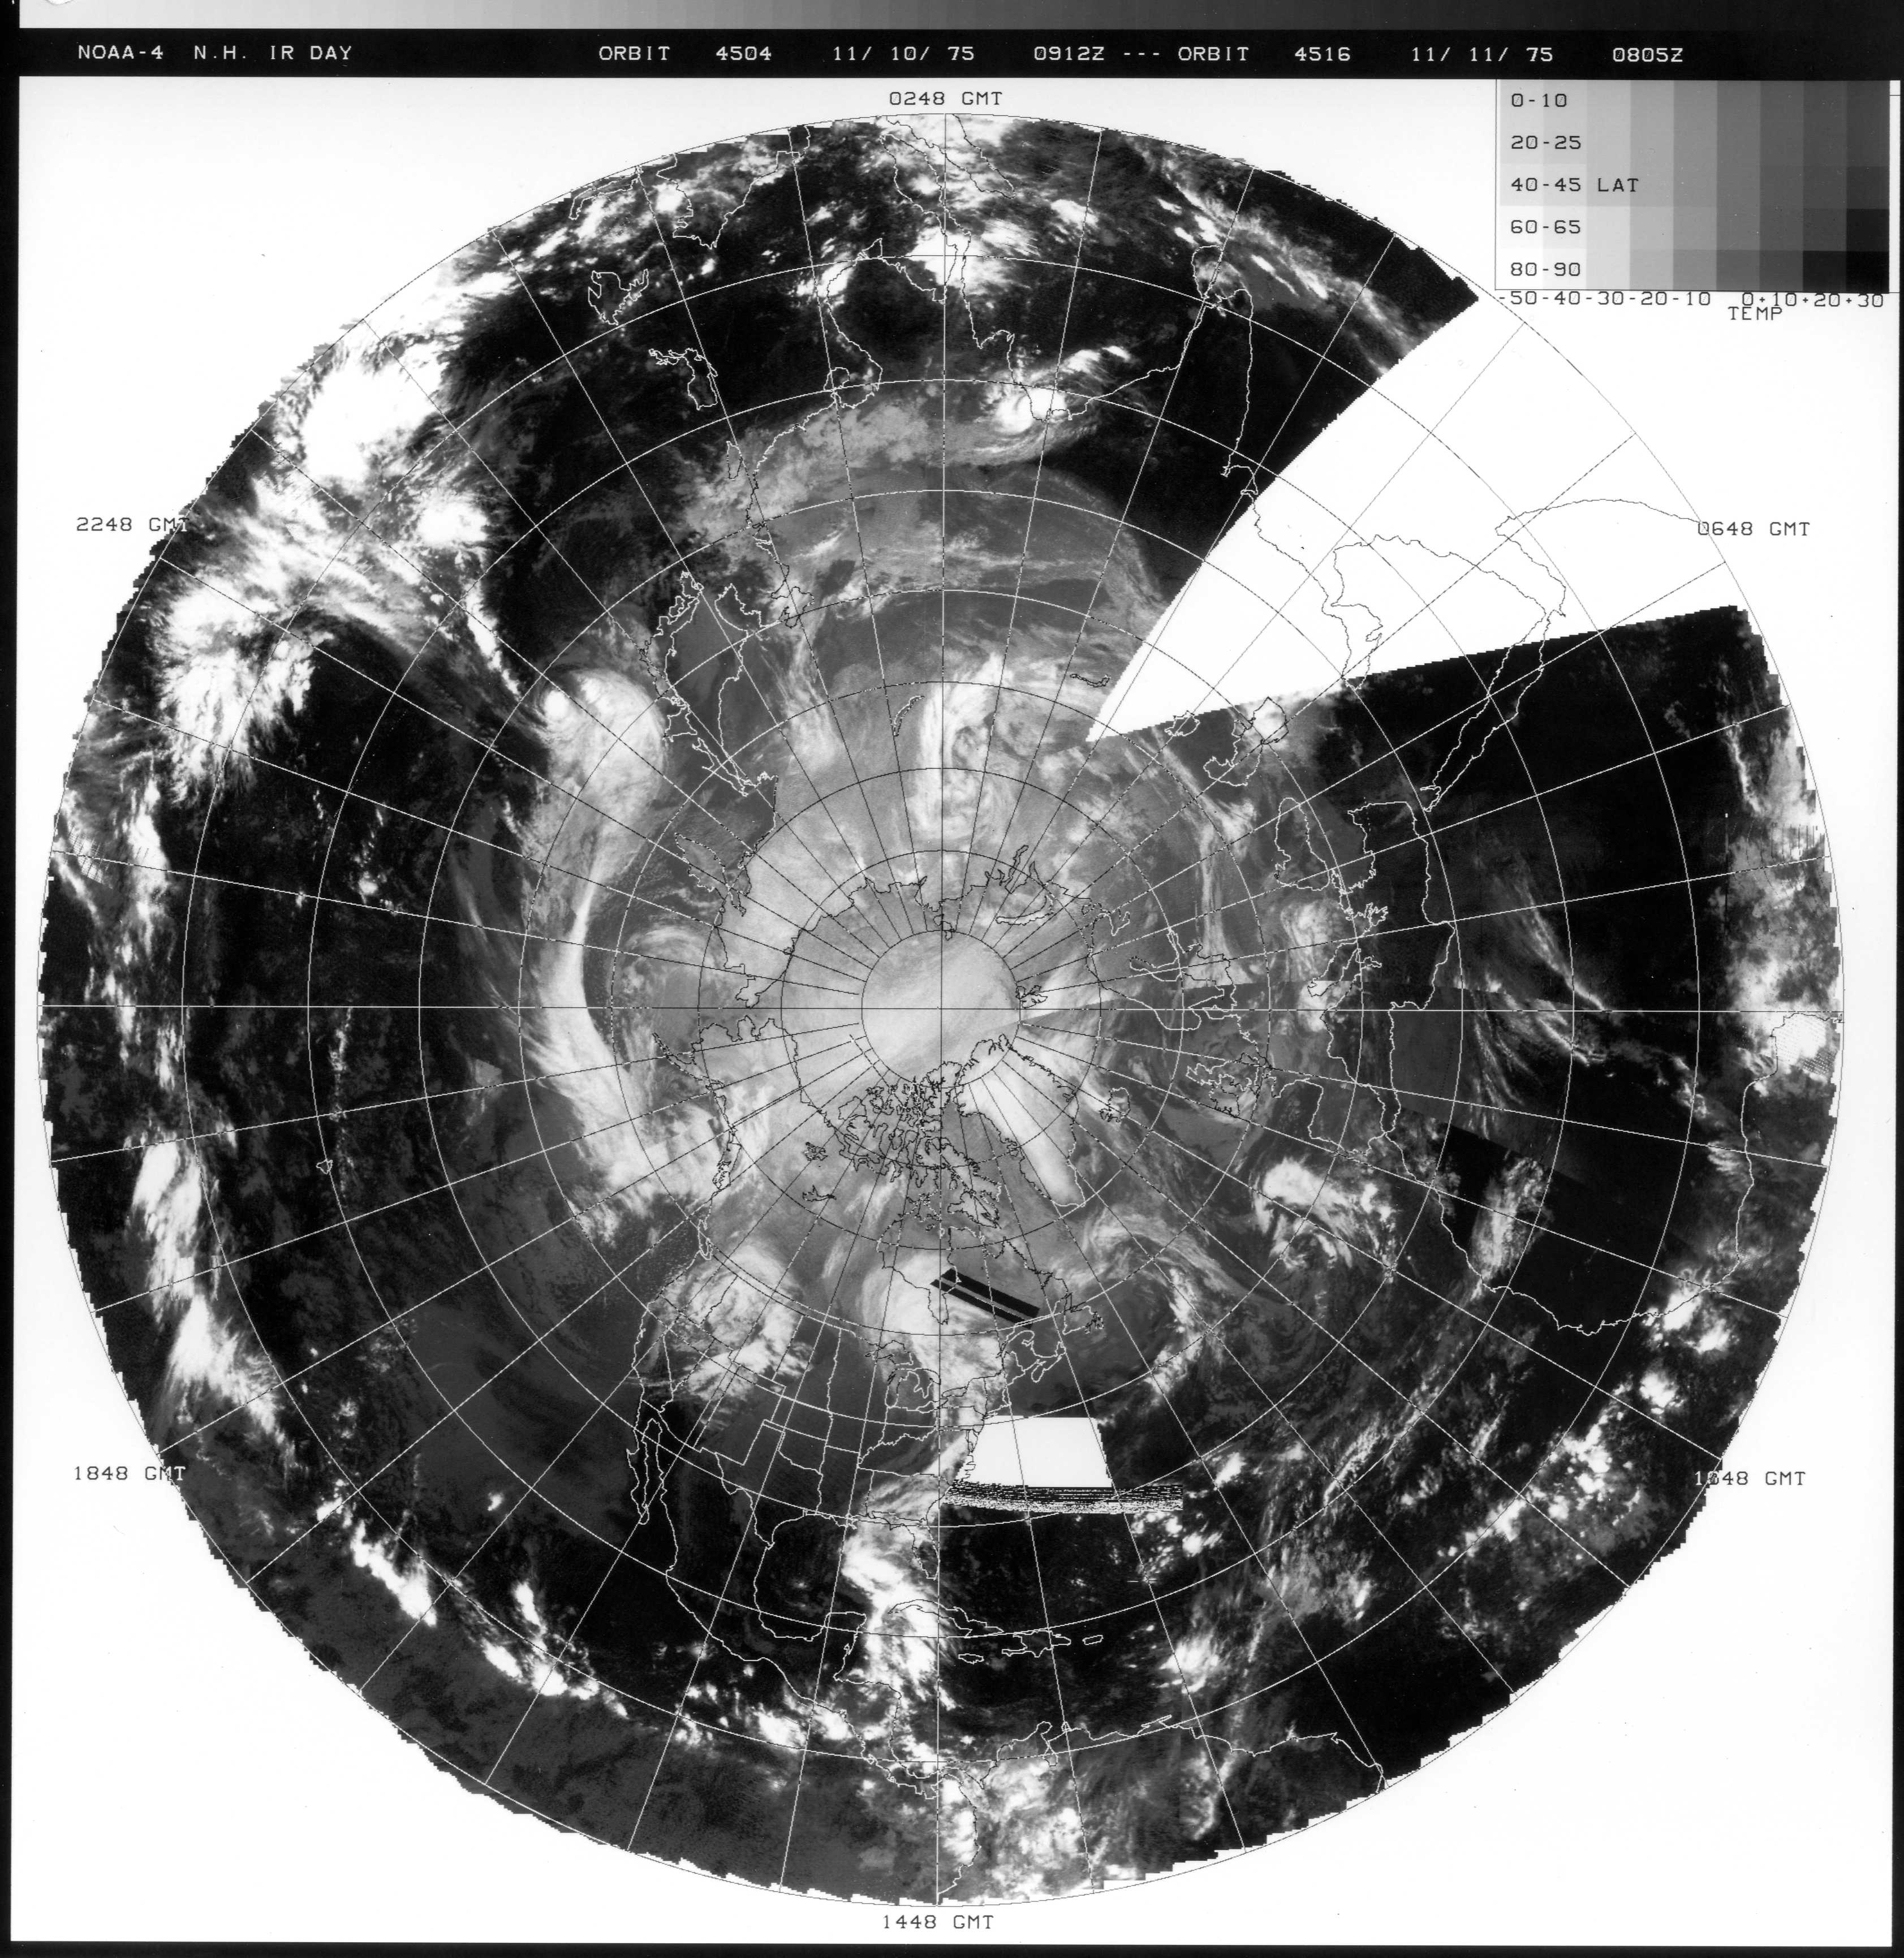
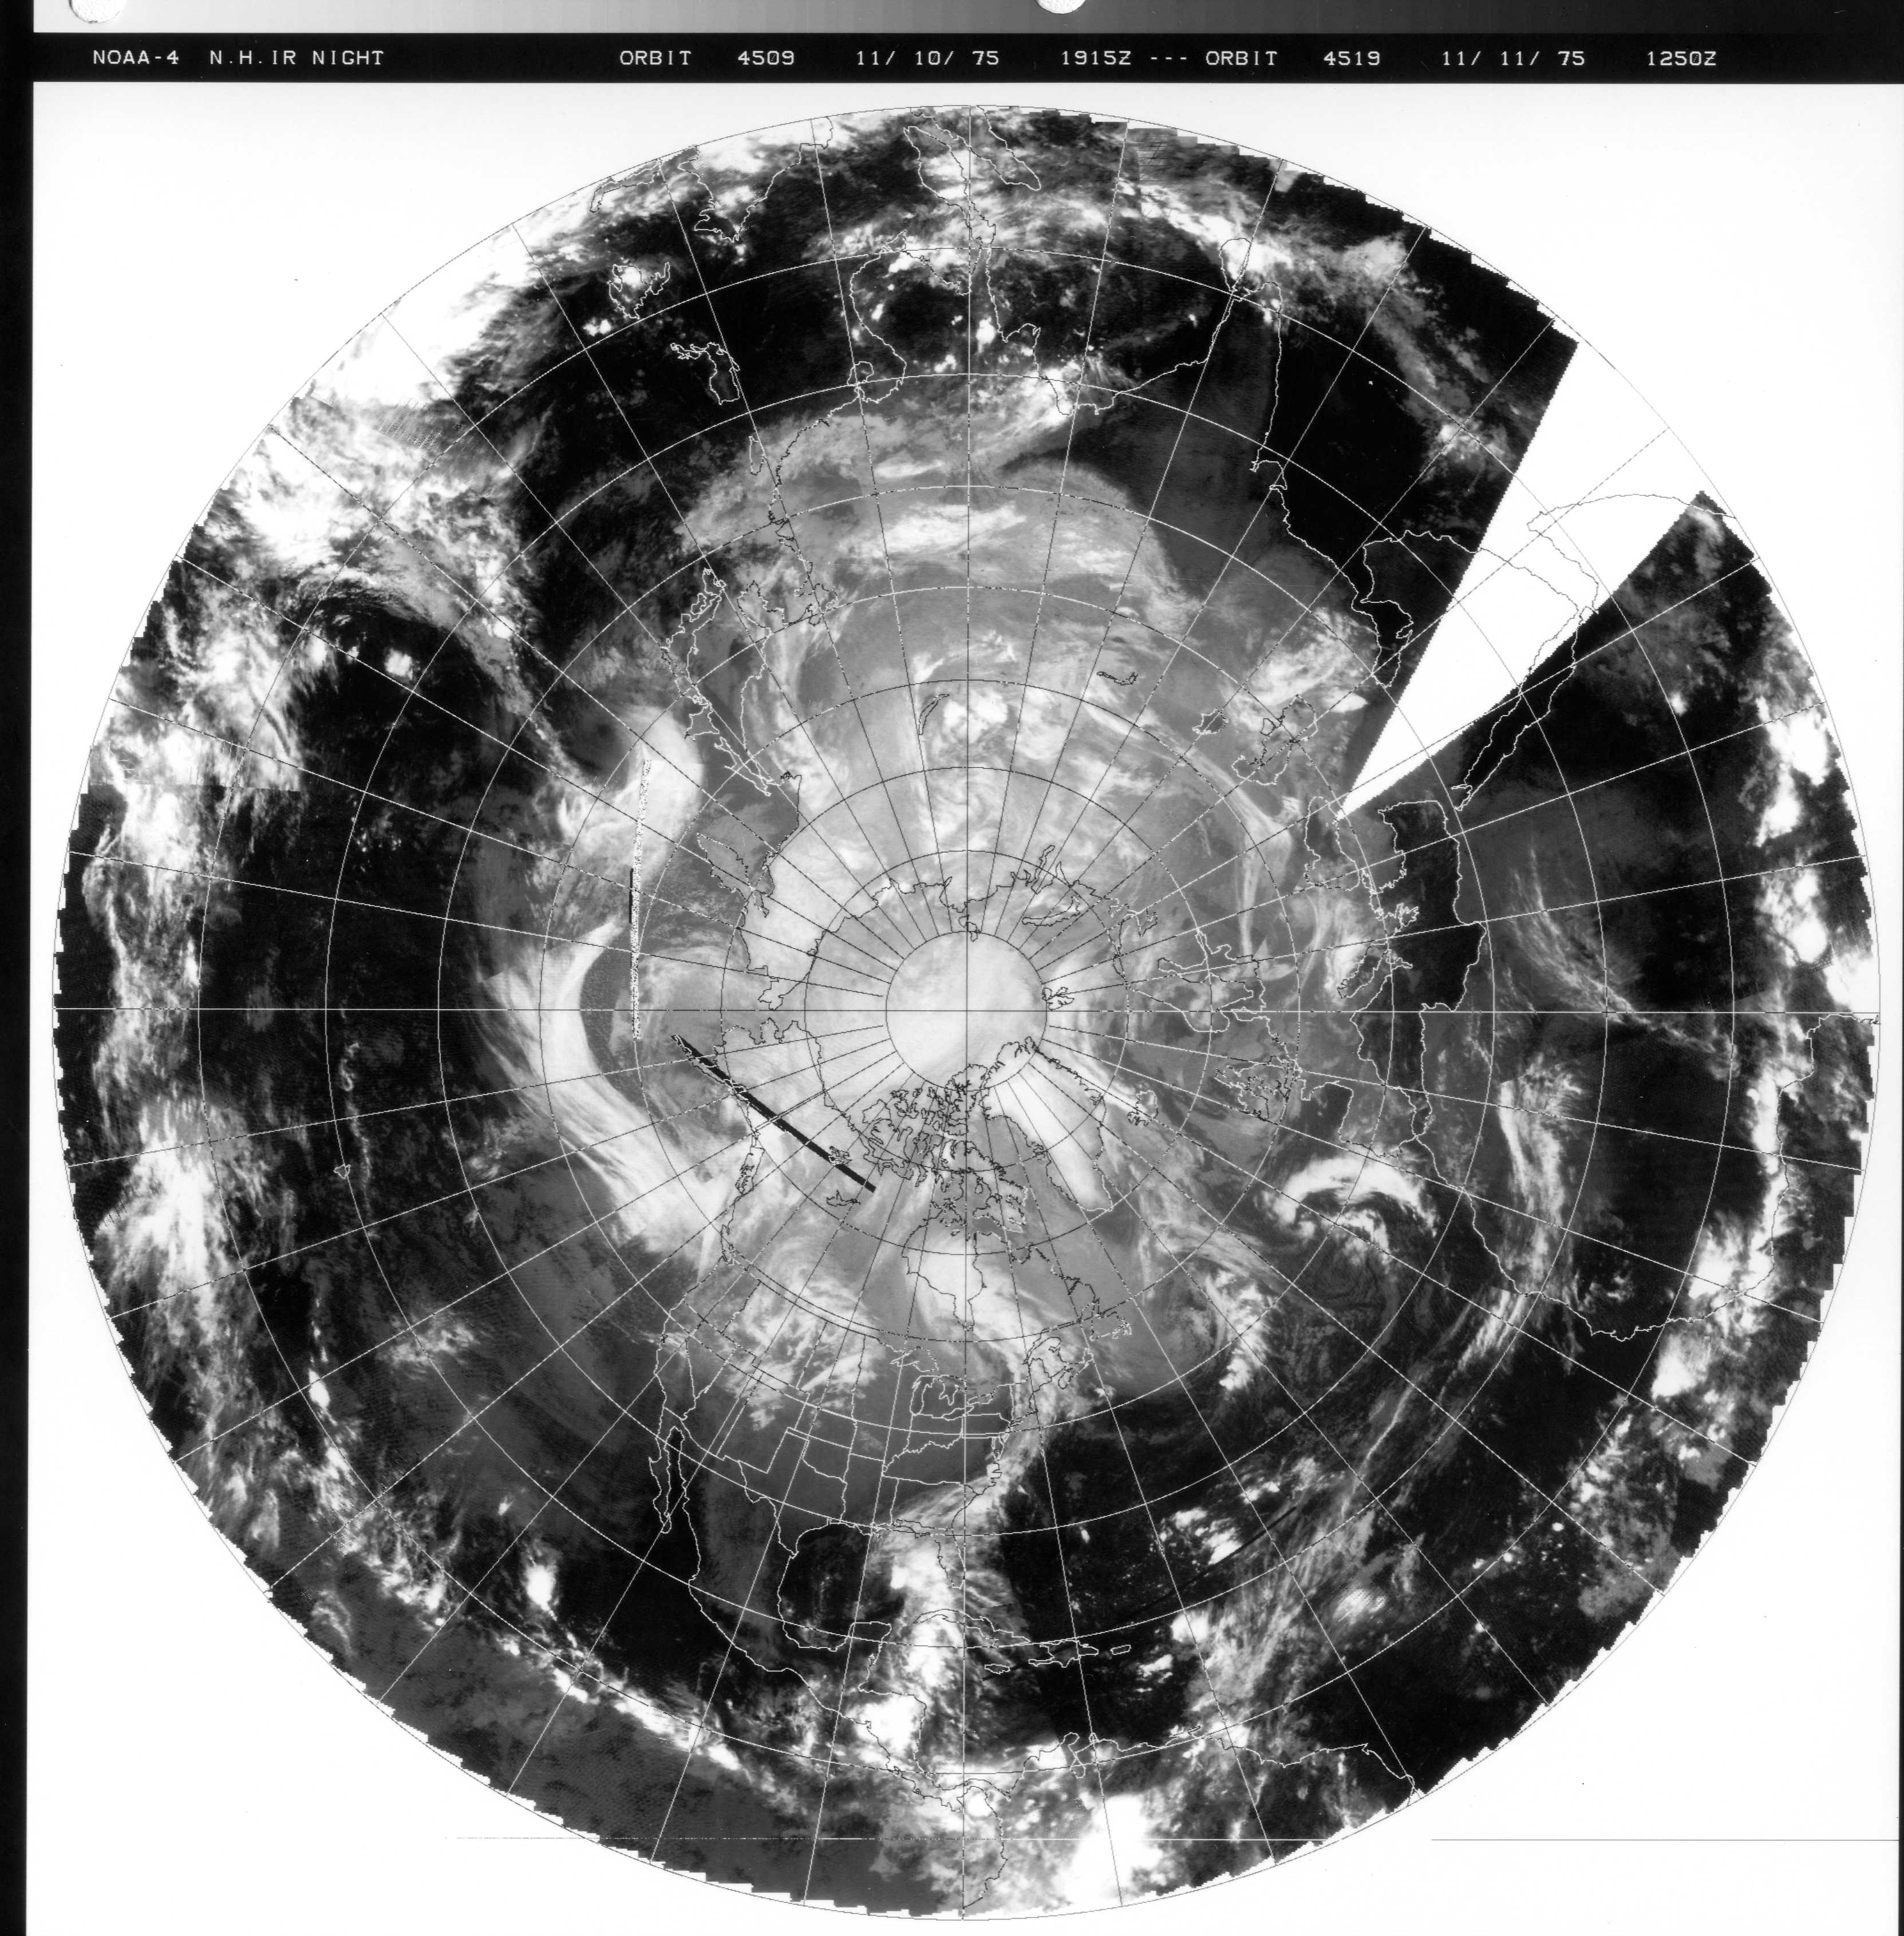
![NOAA-4 daytime and nighttime Infrared composites [click to enlarge]](https://cimss.ssec.wisc.edu/satellite-blog/wp-content/uploads/sites/5/2015/11/10November1975_NOAA-4_infrared_composites_anim.gif)
![CRAS model simulated Infrared imagery [click to enlarge]](https://cimss.ssec.wisc.edu/satellite-blog/wp-content/uploads/sites/5/2010/11/751110_cras_ir_anim.gif)
![GOES-8 Infrared (10.7 µm) images [click to play MP4 animation]](https://cimss.ssec.wisc.edu/satellite-blog/wp-content/uploads/sites/5/2015/11/960x1280_AGOES08_B4_10NOV1998_1998315_010200_1PANEL.GIF)
![GOES-8 Water Vapor (6.7 µm) images [click to play MP4 animation]](https://cimss.ssec.wisc.edu/satellite-blog/wp-content/uploads/sites/5/2015/11/960x1280_AGOES08_B3_10NOV1998_1998315_010200_1PANEL.GIF)
