A large and slow-moving occluded mid-latitude cyclone left a large swath of heavy snowfall across much of the north-central US during the 30 November – 02 December 2015 period. The GOES-13 water vapor (6.5 µm) images shown above (also available as a 62 Mbyte animated gif) revealed the unusually large size of the circulation... Read More
![GOES-13 Water Vapor (6.5 µm) images [click to play MP4 animation]](https://cimss.ssec.wisc.edu/satellite-blog/wp-content/uploads/sites/5/2015/12/960x1280_AGOES13_B3_GOES13_CENTRAL_US_STORM_2015335_121500_0001PANEL.GIF)
GOES-13 Water Vapor (6.5 µm) images [click to play MP4 animation]
A large and slow-moving occluded mid-latitude cyclone left a large swath of heavy snowfall across much of the north-central US during the
30 November –
02 December 2015 period. The GOES-13 water vapor (6.5 µm) images shown above (also available as a 62 Mbyte
animated gif) revealed the unusually large size of the circulation associated with this storm system. Storm total snowfall amounts included 12.0 inches at Valentine, Nebraska, 11.0 inches at Chamberlain, South Dakota, 8.7 inches at Sibley, Iowa, and 7.2 inches at Madison, Minnesota. The 8.7 inches at Sioux Falls, South Dakota was a record daily snowfall accumulation for 30 November.
As the storm moved eastward over the Great Lakes region on 02 December, clouds cleared to reveal the large areal extent of the snow cover on Suomi NPP VIIRS true-color and false-color Red/Green/Blue (RGB) images (visualized using RealEarth) at 1948 UTC on 02 December (below). On the false-color image, snow cover (as well as lake ice) appears as shades of cyan, in contrast to supercooled water droplet clouds which are shades of white; glaciated (ice crystal) clouds also appear cyan. The deep snow cover, clear skies, and light winds aided strong radiational cooling during the following night, with minimum temperatures on the morning of 03 December as cold as -5º F at Brookings, South Dakota and -4º F at Sheldon, Iowa (KFSD RTP).
![Suomi NPP VIIRS true-color and false-color images [click to enlarge]](https://cimss.ssec.wisc.edu/satellite-blog/wp-content/uploads/sites/5/2015/12/151202_1948utc_suomi_npp_viirs_truecolor_falsecolor_Northentral_US_snow_cover_anim.gif)
Suomi NPP VIIRS true-color and false-color images [click to enlarge]
An alternative true-color vs false-color comparison
(below) uses different spectral bands from the Aqua MODIS instrument — is this case, snow cover and lake ice appear as darker shades of red. The creation of these types of true-color and false-color RGB images will be possible using bands from the upcoming
GOES-R ABI (scheduled to be launched in late 2016).
![Aqua MODIS true-color and false-color images [click to enlarge]](https://cimss.ssec.wisc.edu/satellite-blog/wp-content/uploads/sites/5/2015/12/151202_1957utc_aqua_modis_truecolor_falsecolor_Northcentral_US_snowcover_anim.gif)
Aqua MODIS true-color and false-color images [click to enlarge]
View only this post
Read Less
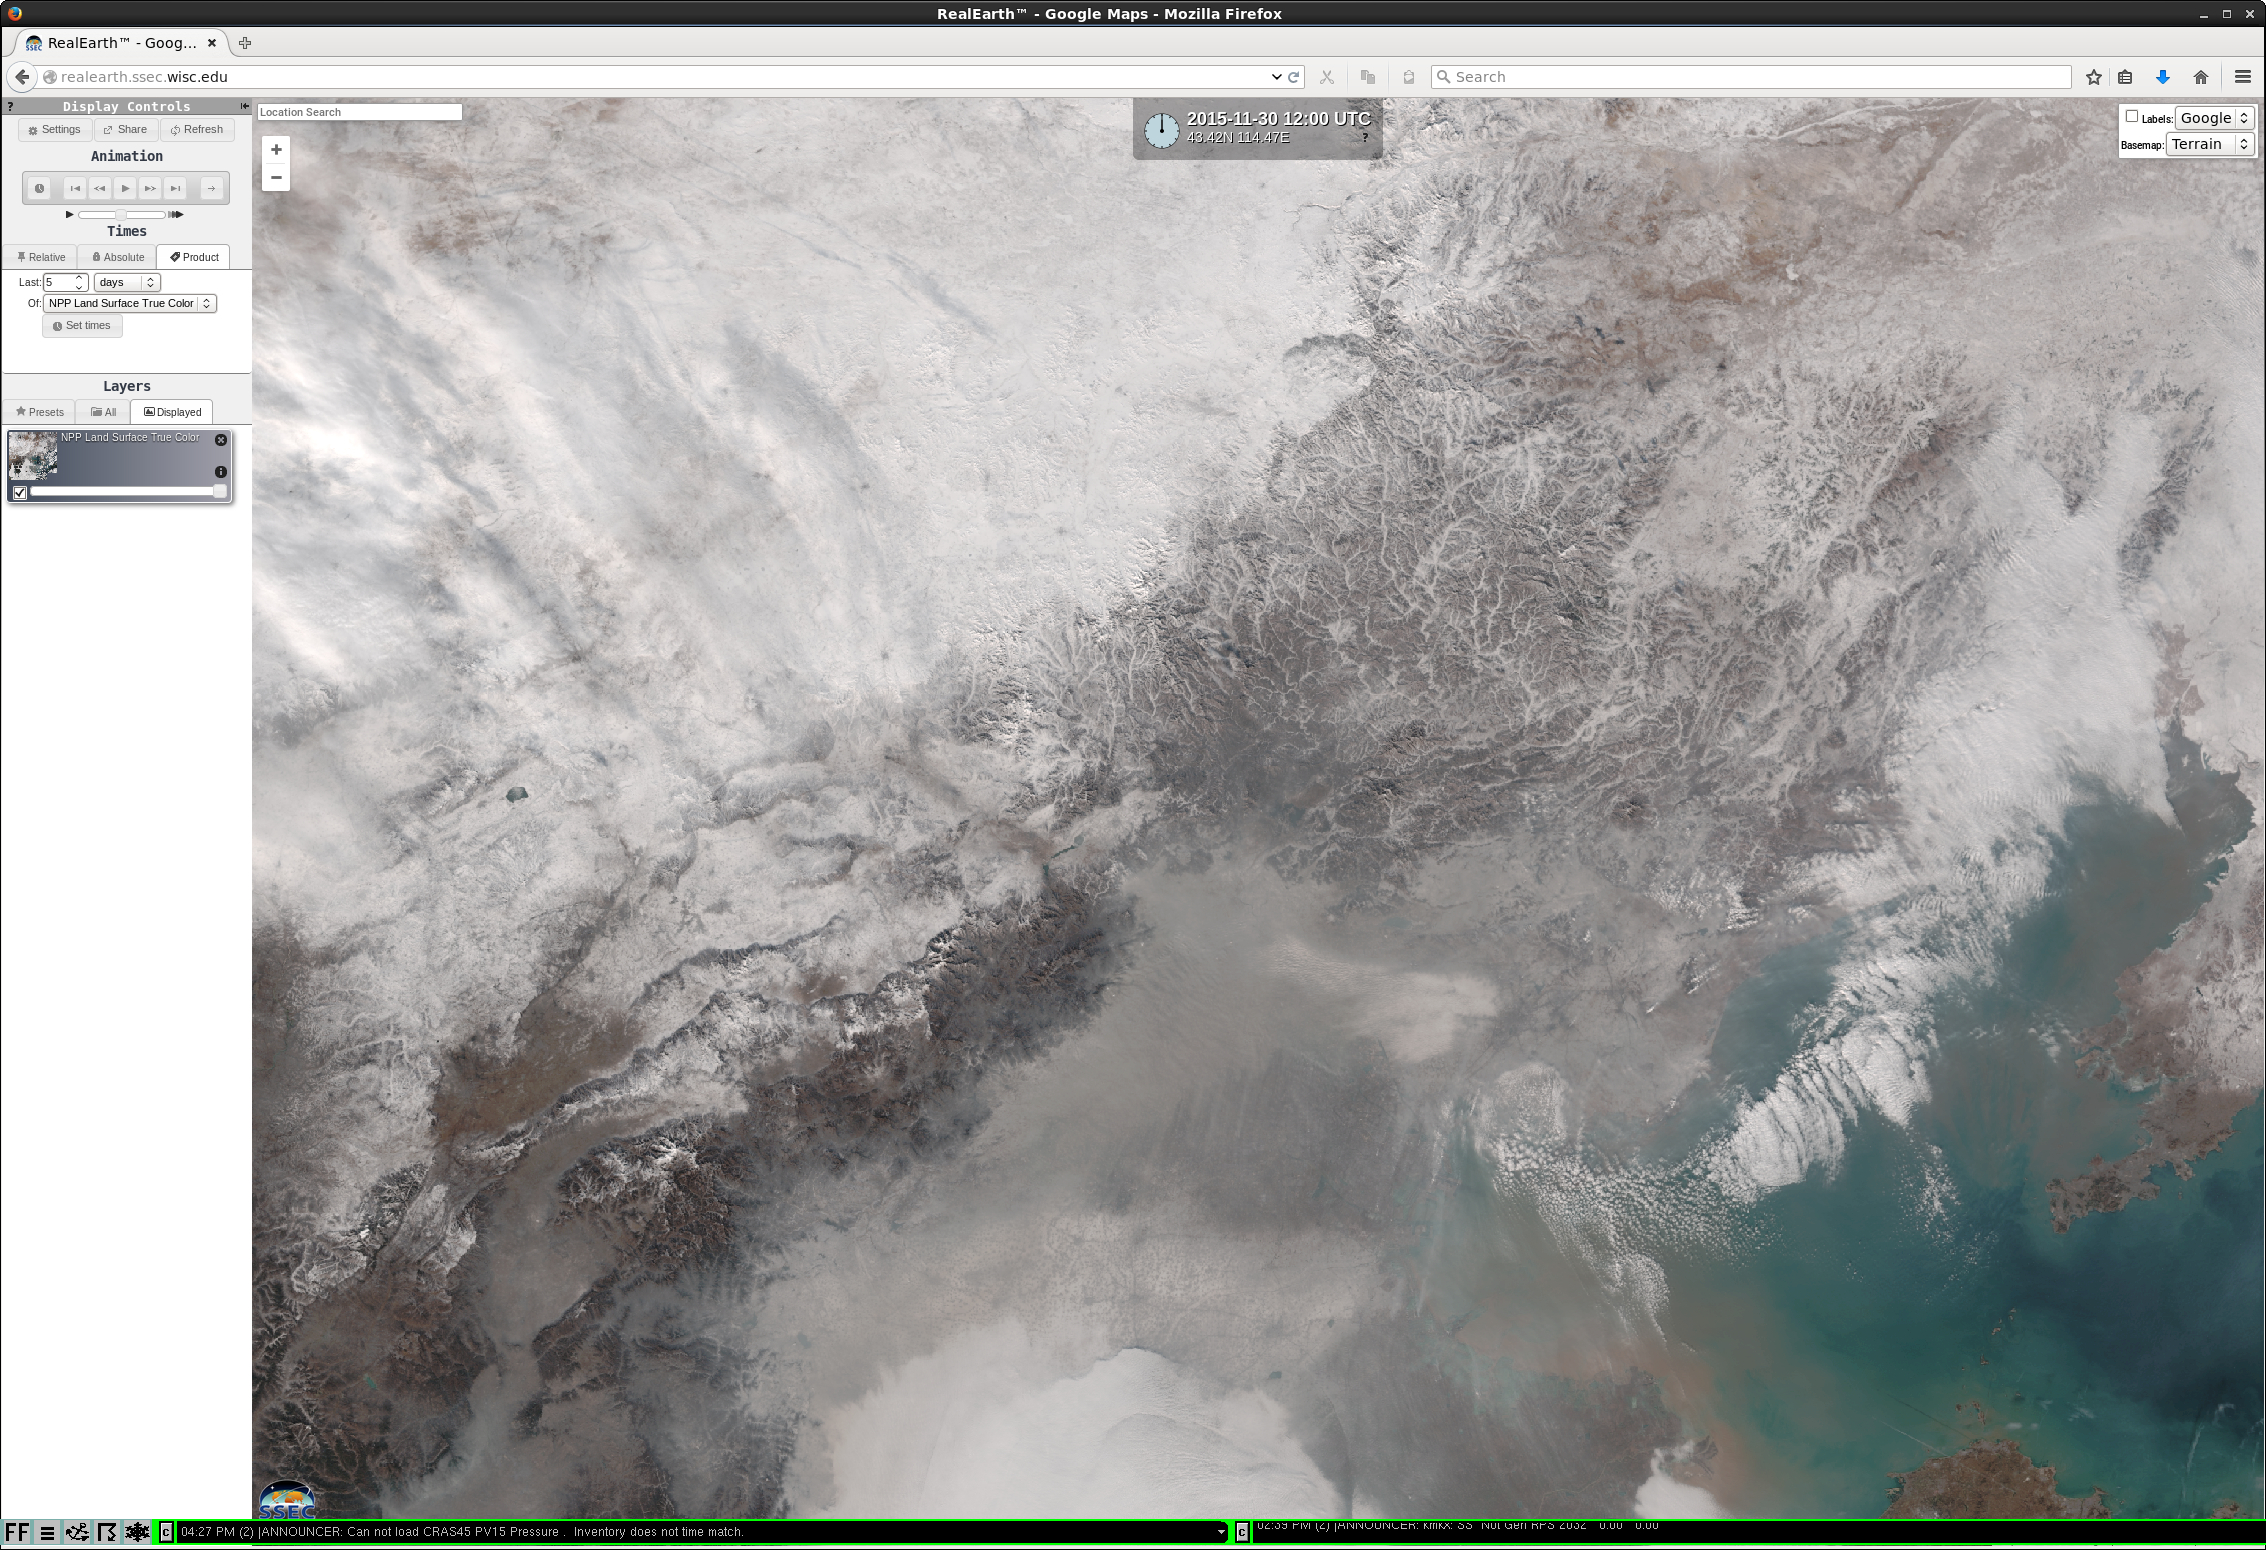
![Suomi NPP VIIRS true-color images [click to play animation]](https://cimss.ssec.wisc.edu/satellite-blog/wp-content/uploads/sites/5/2015/11/151126-30_suomi_npp_viirs_truecolor_Beijing_anim.gif)
![Daily time series plots of Beijing surface data [click to play animation]](https://cimss.ssec.wisc.edu/satellite-blog/wp-content/uploads/sites/5/2015/11/151126-30_zbaa_surface_reports_anim.gif)
![GOES-13 Visible (0.63 µm) images [click to play animation]](https://cimss.ssec.wisc.edu/satellite-blog/wp-content/uploads/sites/5/2015/11/151124_goes13_visible_Hudson_Bay_ice_anim.gif)
![Suomi NPP VIIRS true-color and false-color images [click to enlarge]](https://cimss.ssec.wisc.edu/satellite-blog/wp-content/uploads/sites/5/2015/11/151124_2226utc_viirs_truecolor_falsecolor_Hudson_Bay_ice_anim.gif)
![Hudson Bay ice concentration on 16 and 23 November 2015 [click to enlarge]](https://cimss.ssec.wisc.edu/satellite-blog/wp-content/uploads/sites/5/2015/11/151116-23_Hudson_Bay_ice_concenration_anim.gif)
![Hudson Bay ice concentration departure from normal on 16 and 23 November [click to enlarge]](https://cimss.ssec.wisc.edu/satellite-blog/wp-content/uploads/sites/5/2015/11/151116-23_Hudson_Bay_ice_concenration_departure_anim.gif)
![GOES-15 Visible (0.63 µm) images [click to play animation]](https://cimss.ssec.wisc.edu/satellite-blog/wp-content/uploads/sites/5/2015/11/GOES13SNDR_0847_0947toggle.gif)
