
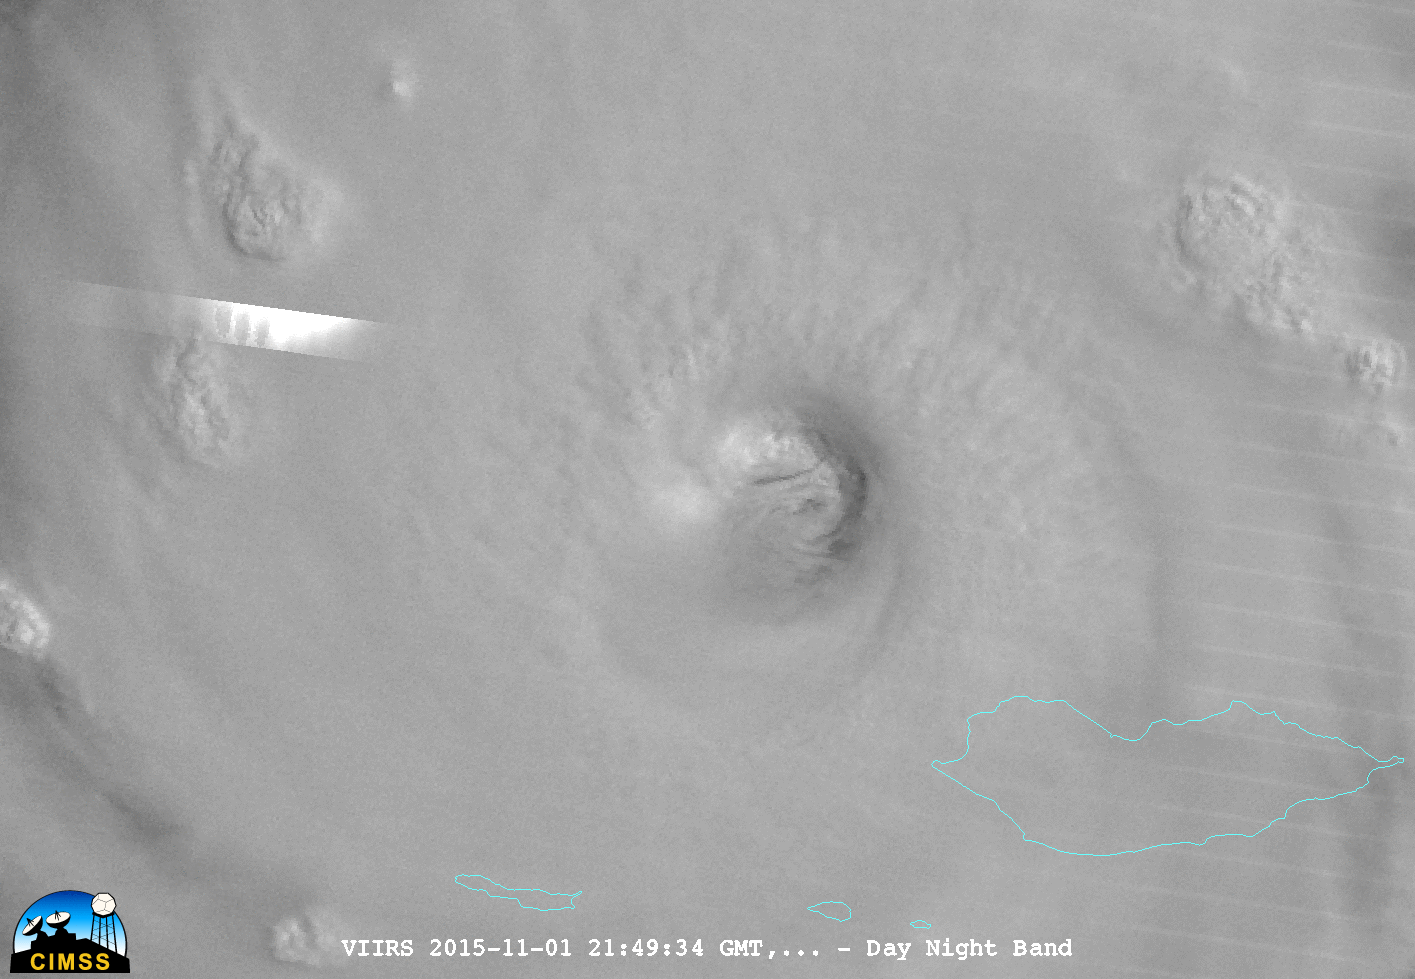
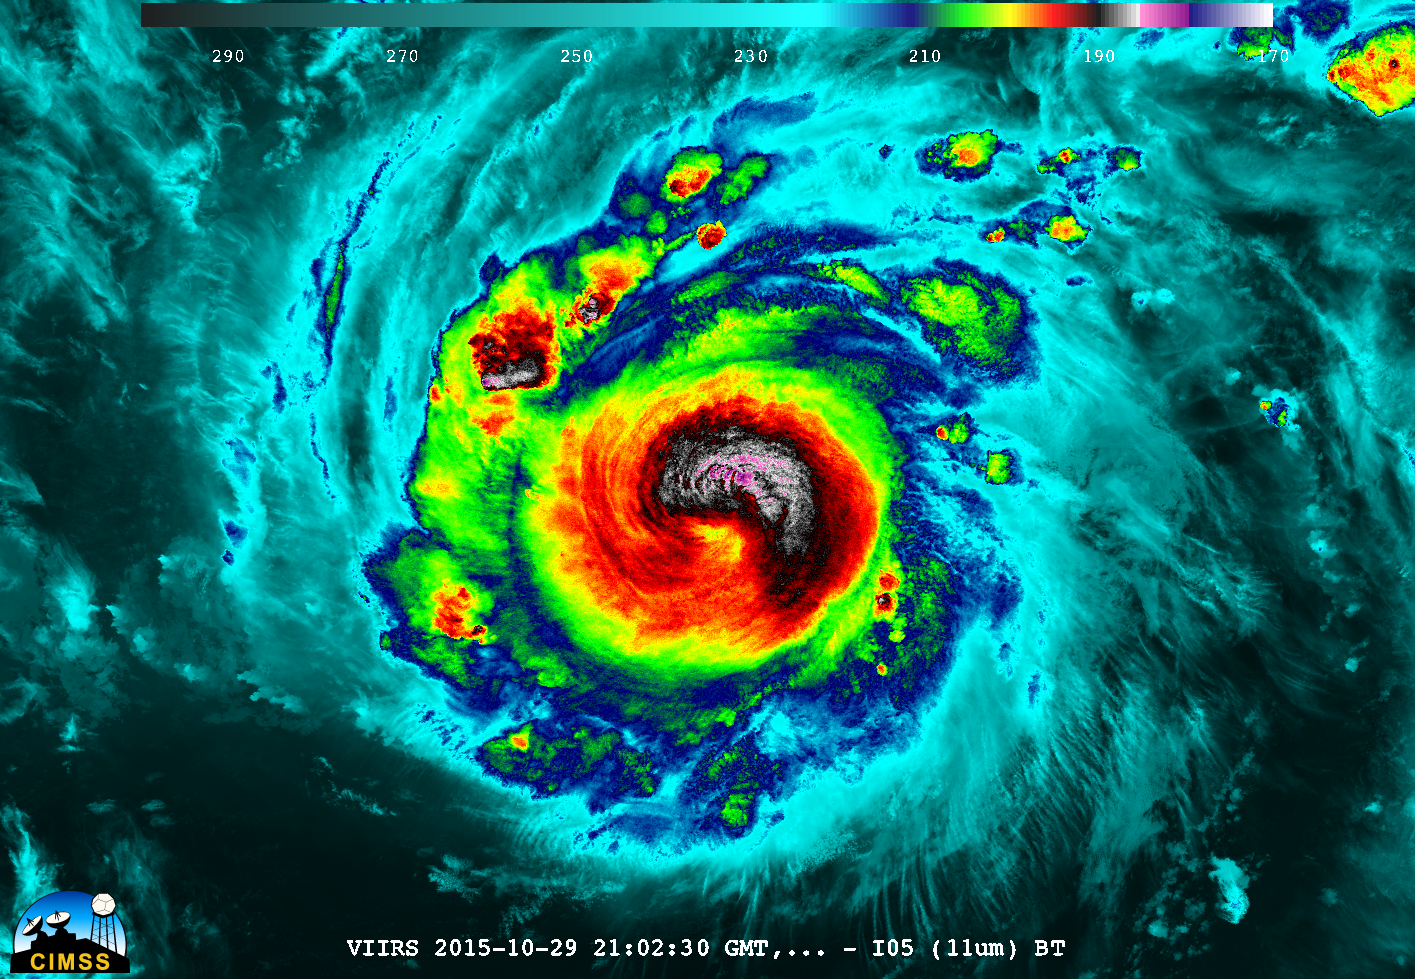
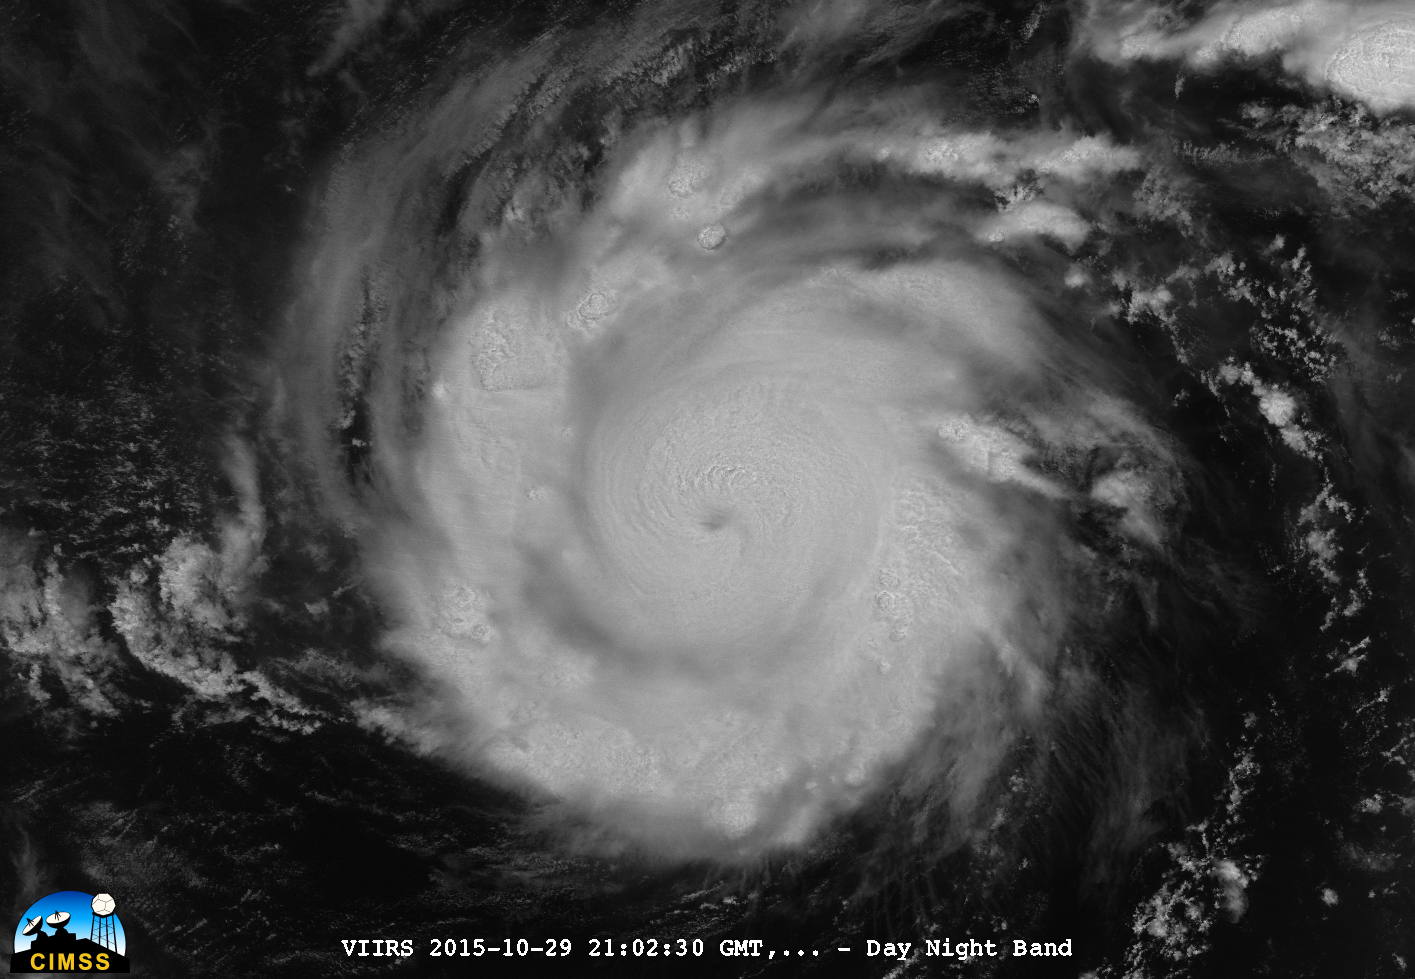
Tropical Cyclone Chapala is poised to make an unusual landfall on the Arabian Penisula over the weekend. The Suomi NPP VIIRS Day Night Band Imagery (courtesy William Straka, SSEC/CIMSS), above, from 2102 UTC on 29 October, shows a compact storm with curved bands of strong convection around an apparent eye.... Read More
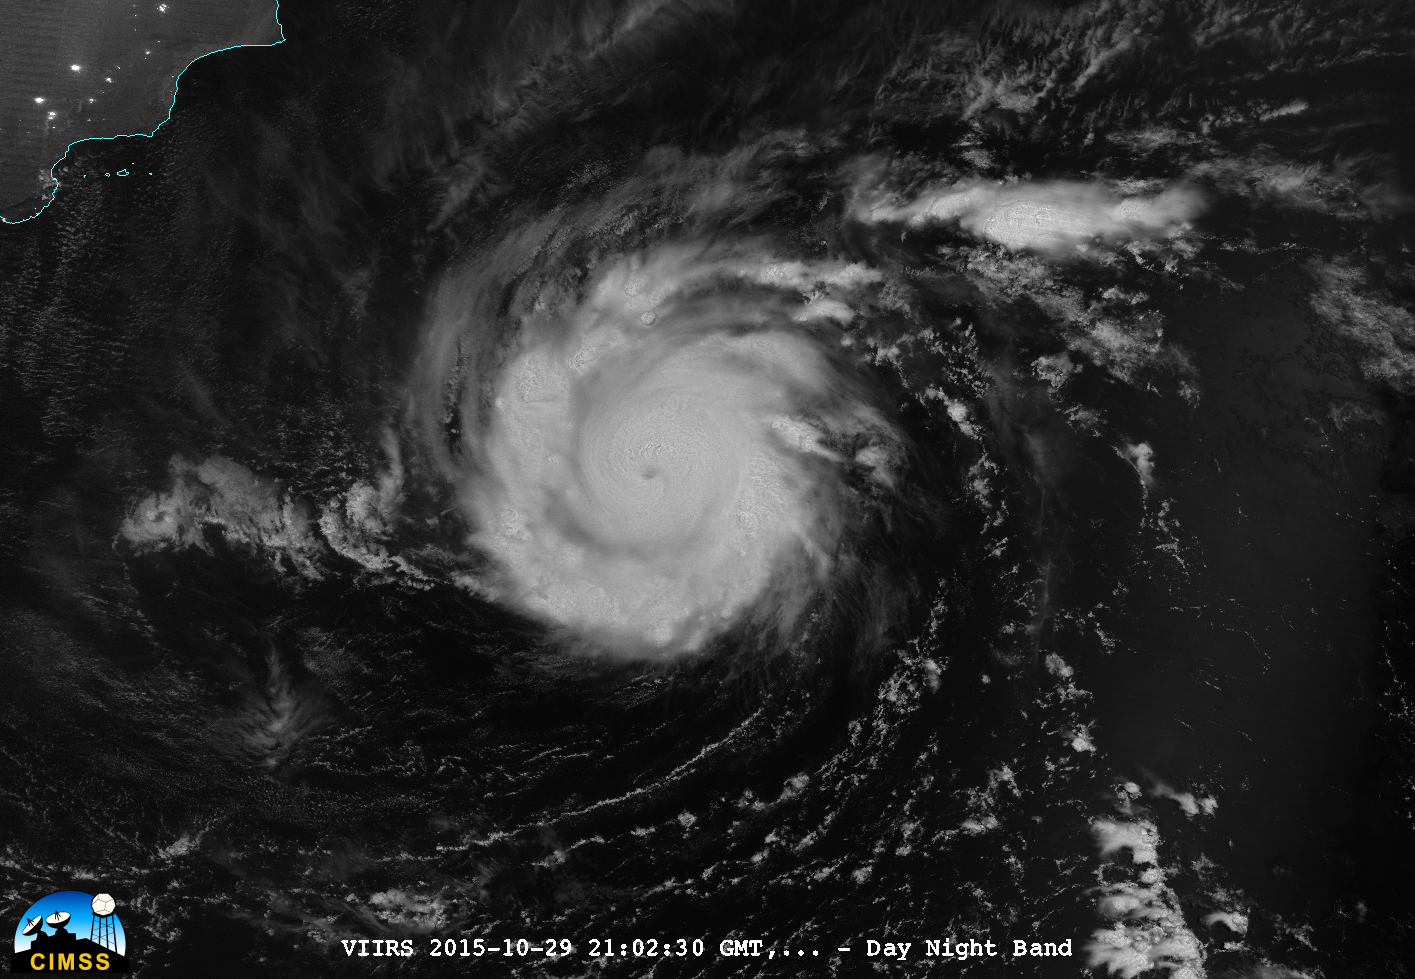
Day Night Band Imagery from Suomi NPP VIIRS (0.70 µm) 2102 UTC, 29 October 2015 (Click to enlarge)
Tropical Cyclone Chapala is poised to make an unusual landfall on the Arabian Penisula over the weekend. The Suomi NPP VIIRS Day Night Band Imagery (courtesy William Straka, SSEC/CIMSS), above, from 2102 UTC on 29 October, shows a compact storm with curved bands of strong convection around an apparent eye. A more zoomed-in version of the storm in the infrared (A Zoomed in version of the Day Night band is here), shows very cold cloud tops.

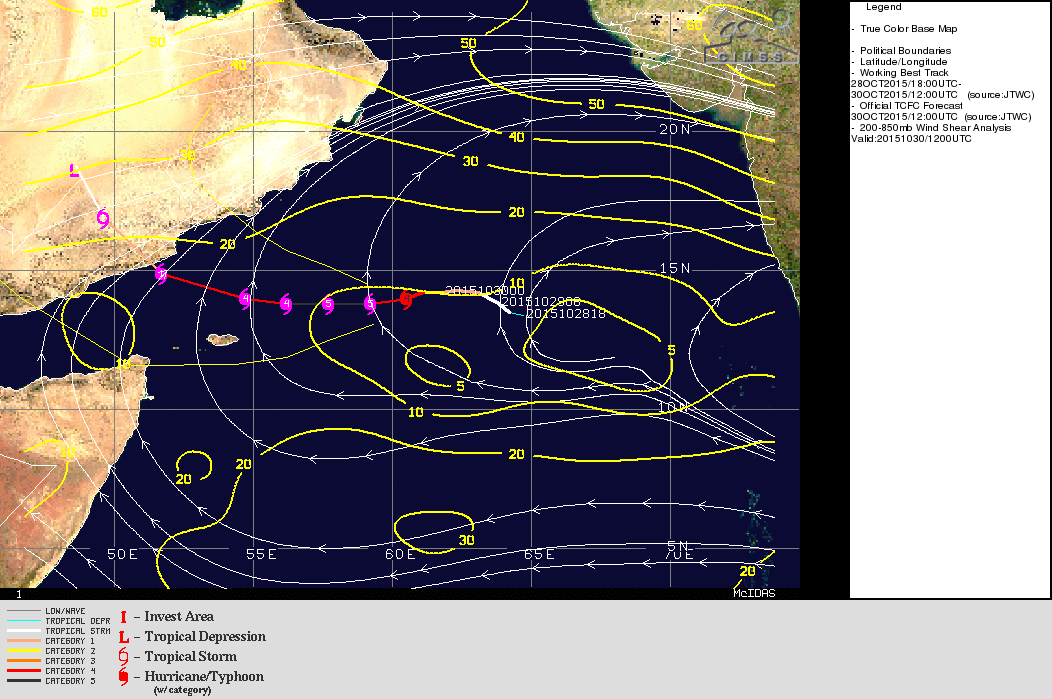
Total Precipitable Water and Projected Storm Path for Chapala, 1200 UTC on 30 October 2015 (Click to enlarge)
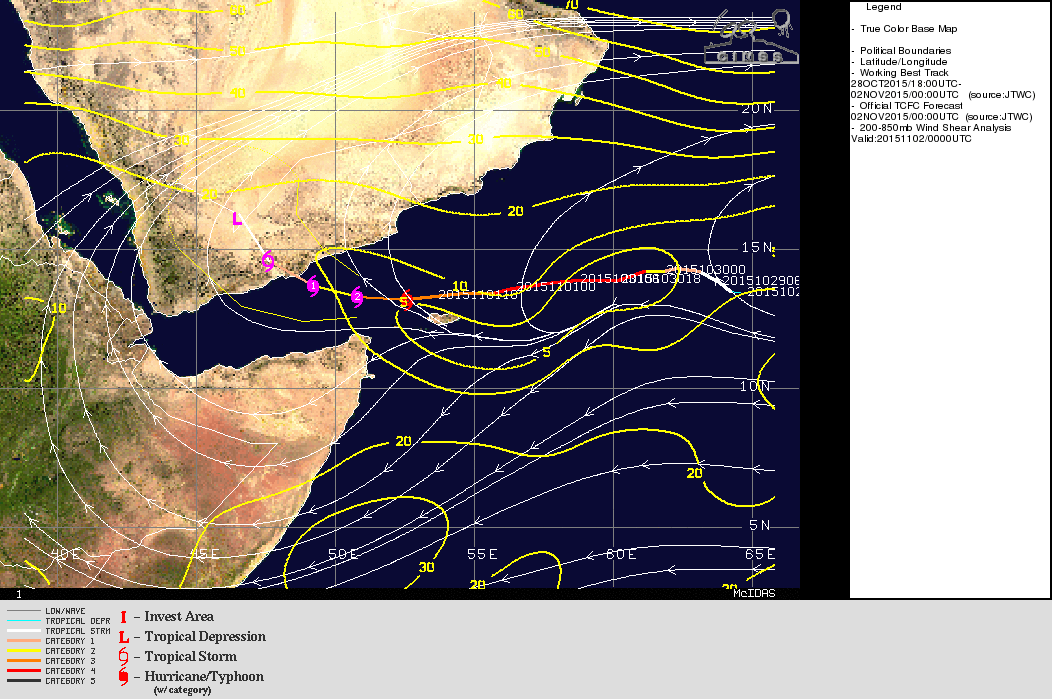
Data from the CIMSS Tropical Page shows the environment in which Chapala strengthened will become progressively less favorable as the storm approaches land. The MIMIC Total Precipitable Water, above, shows the storm with dry air to the north and west. Tropical cyclones that approach the Arabian peninsula are rare. Those that do approach are invariably weakened as they ingest the dry air that is typically over Arabia. Diagnostics of wind shear also suggest that Chapala is moving towards a more highly sheared environment.
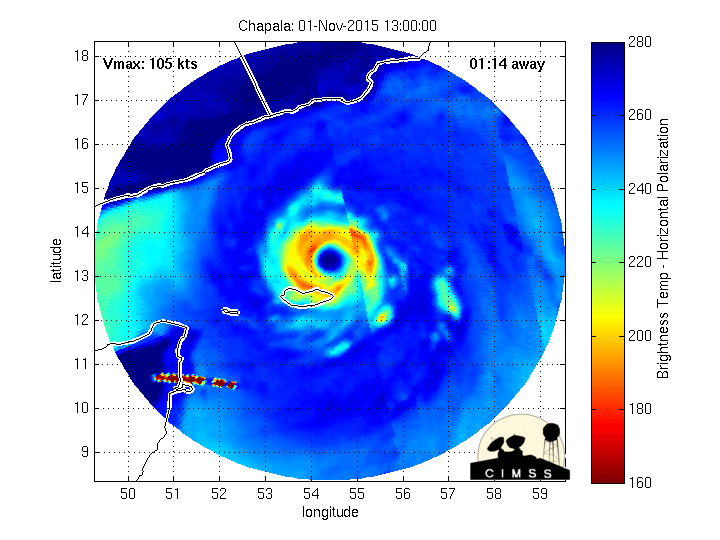
Microwave imagery, below, shows a very intense eye around 0100 UTC on 30 October. After that time, however, the eye becomes less distinct.
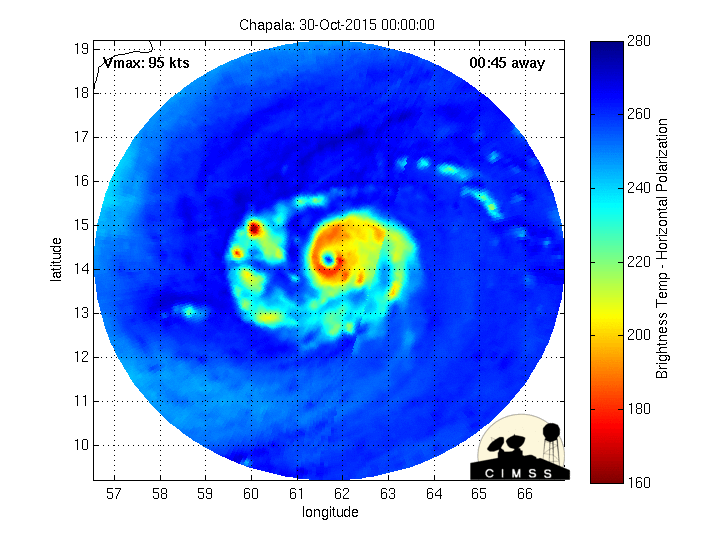
Microwave Imagery over the Eye of Chapala, 0100-1245 UTC on 30 October 2015 (Click to enlarge)
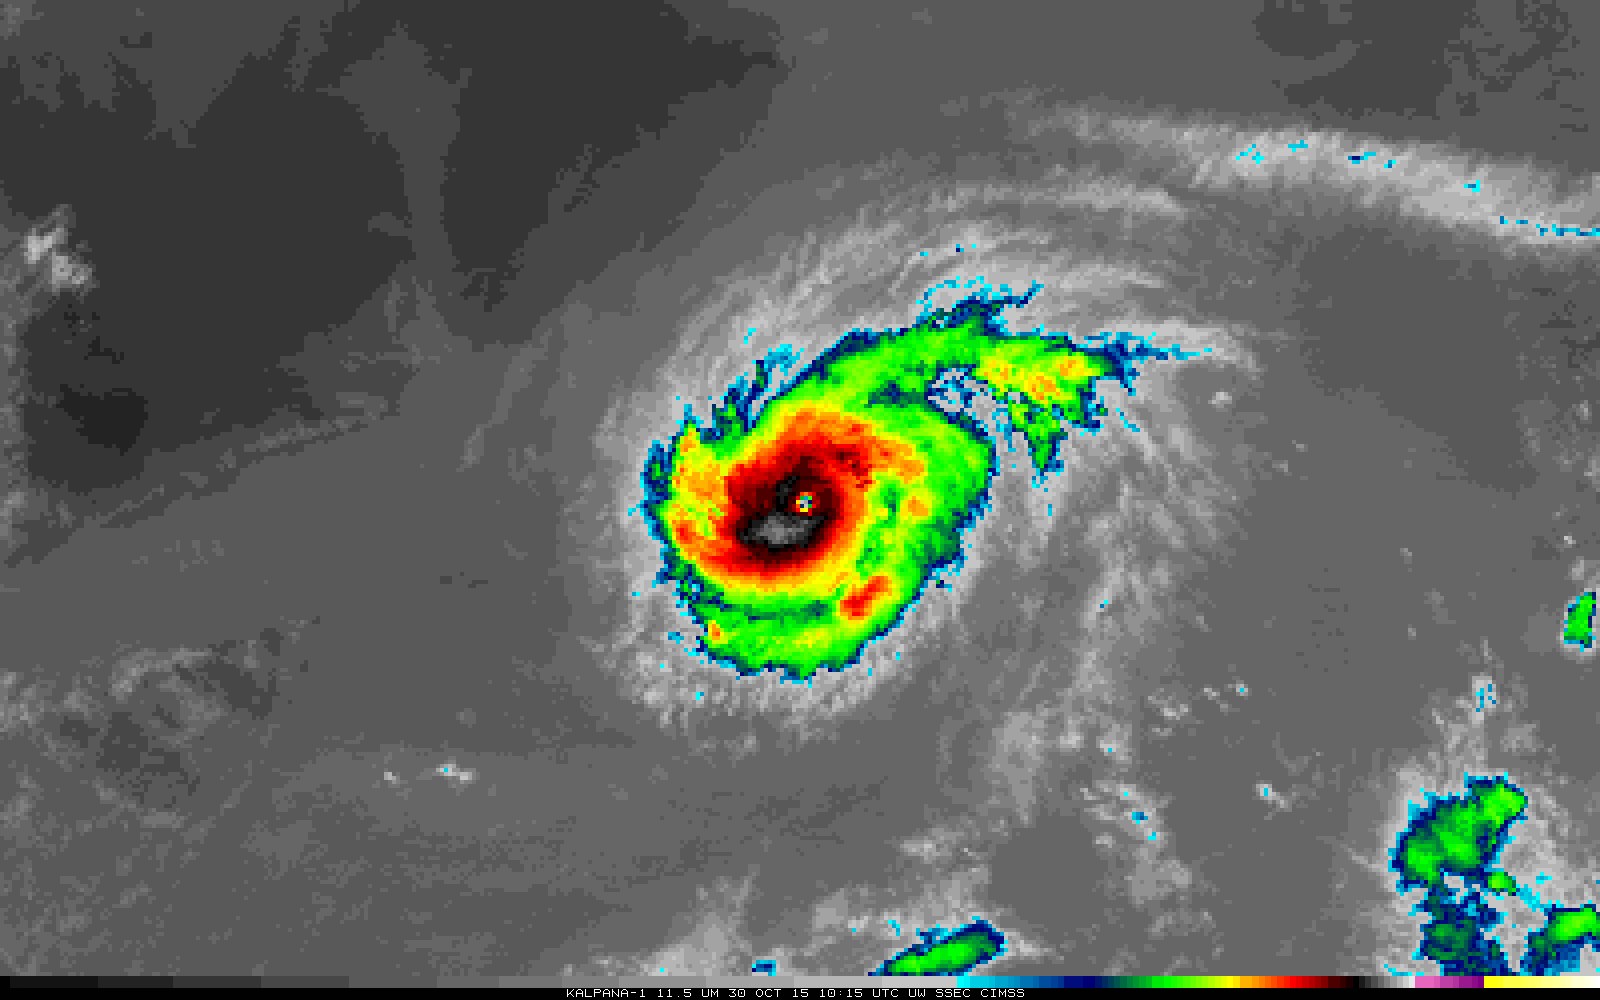
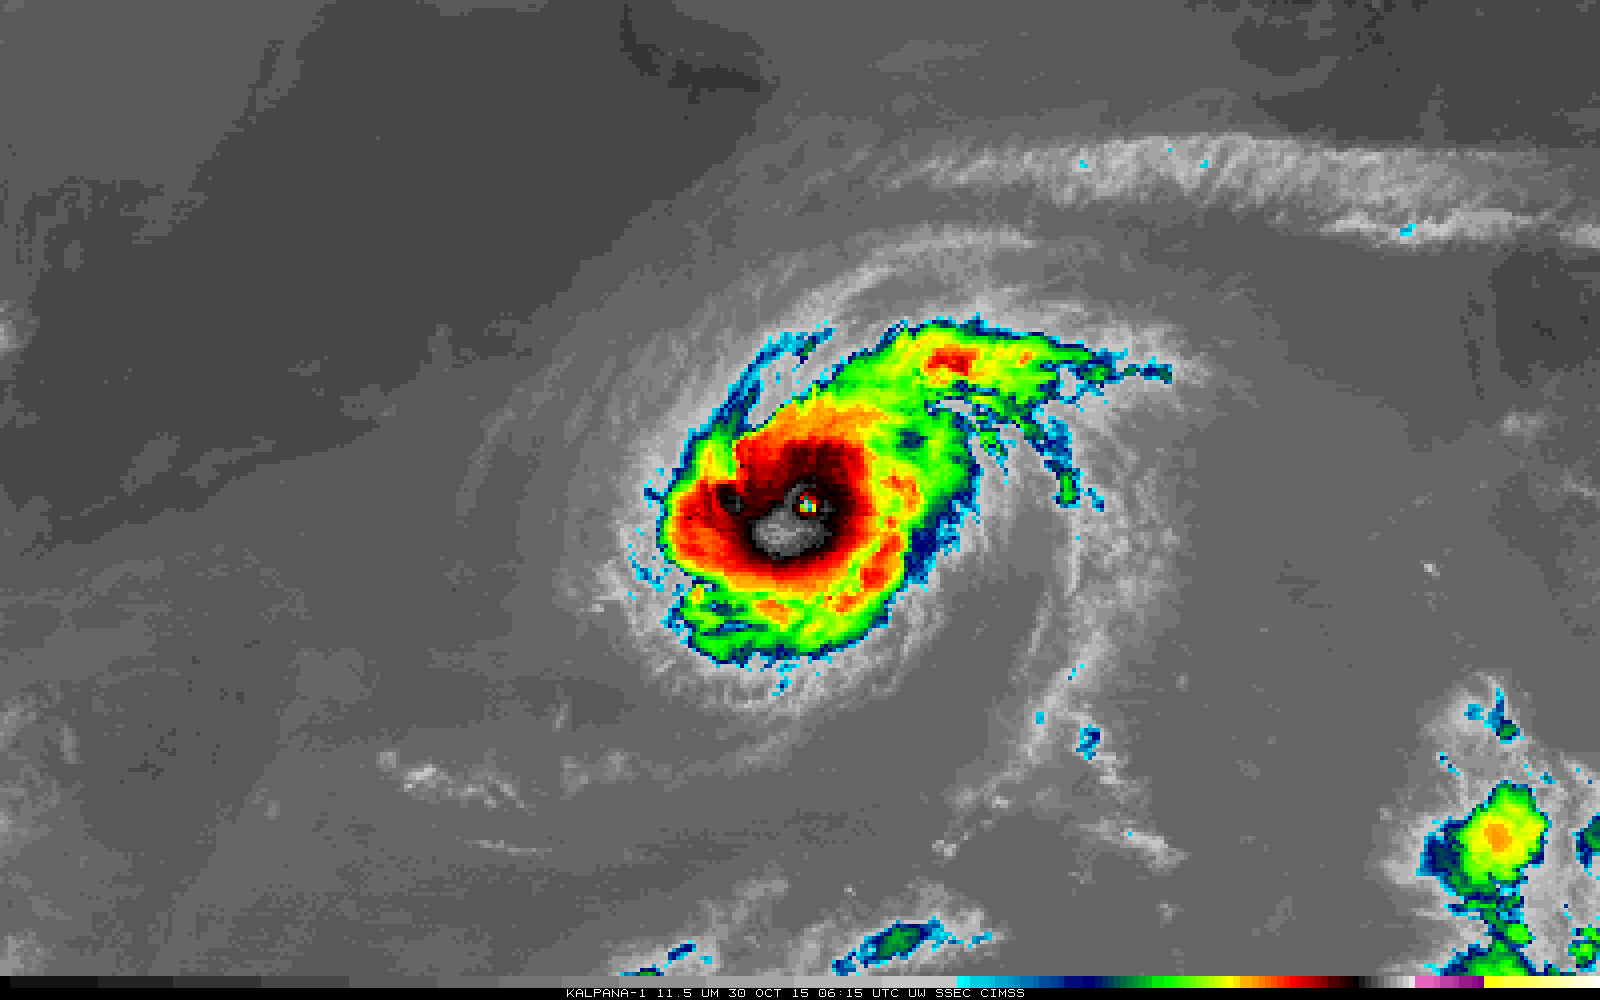
Storm-centered animation of 11.2 µm imagery from Kalapana-1 (Click to enlarge)
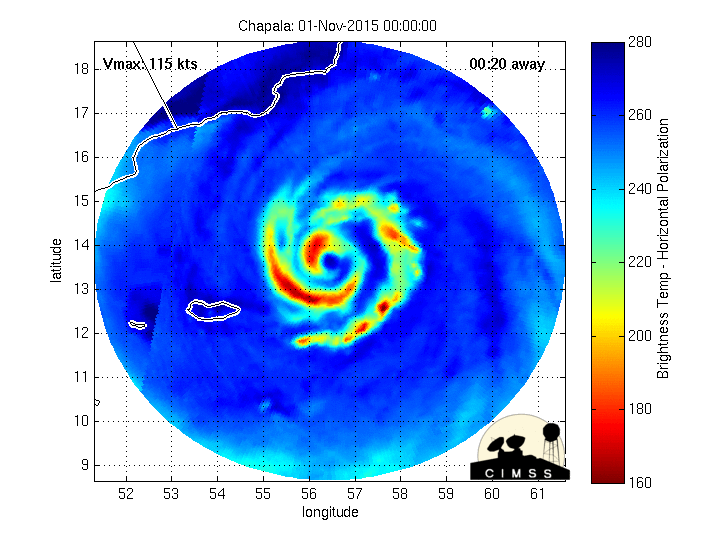
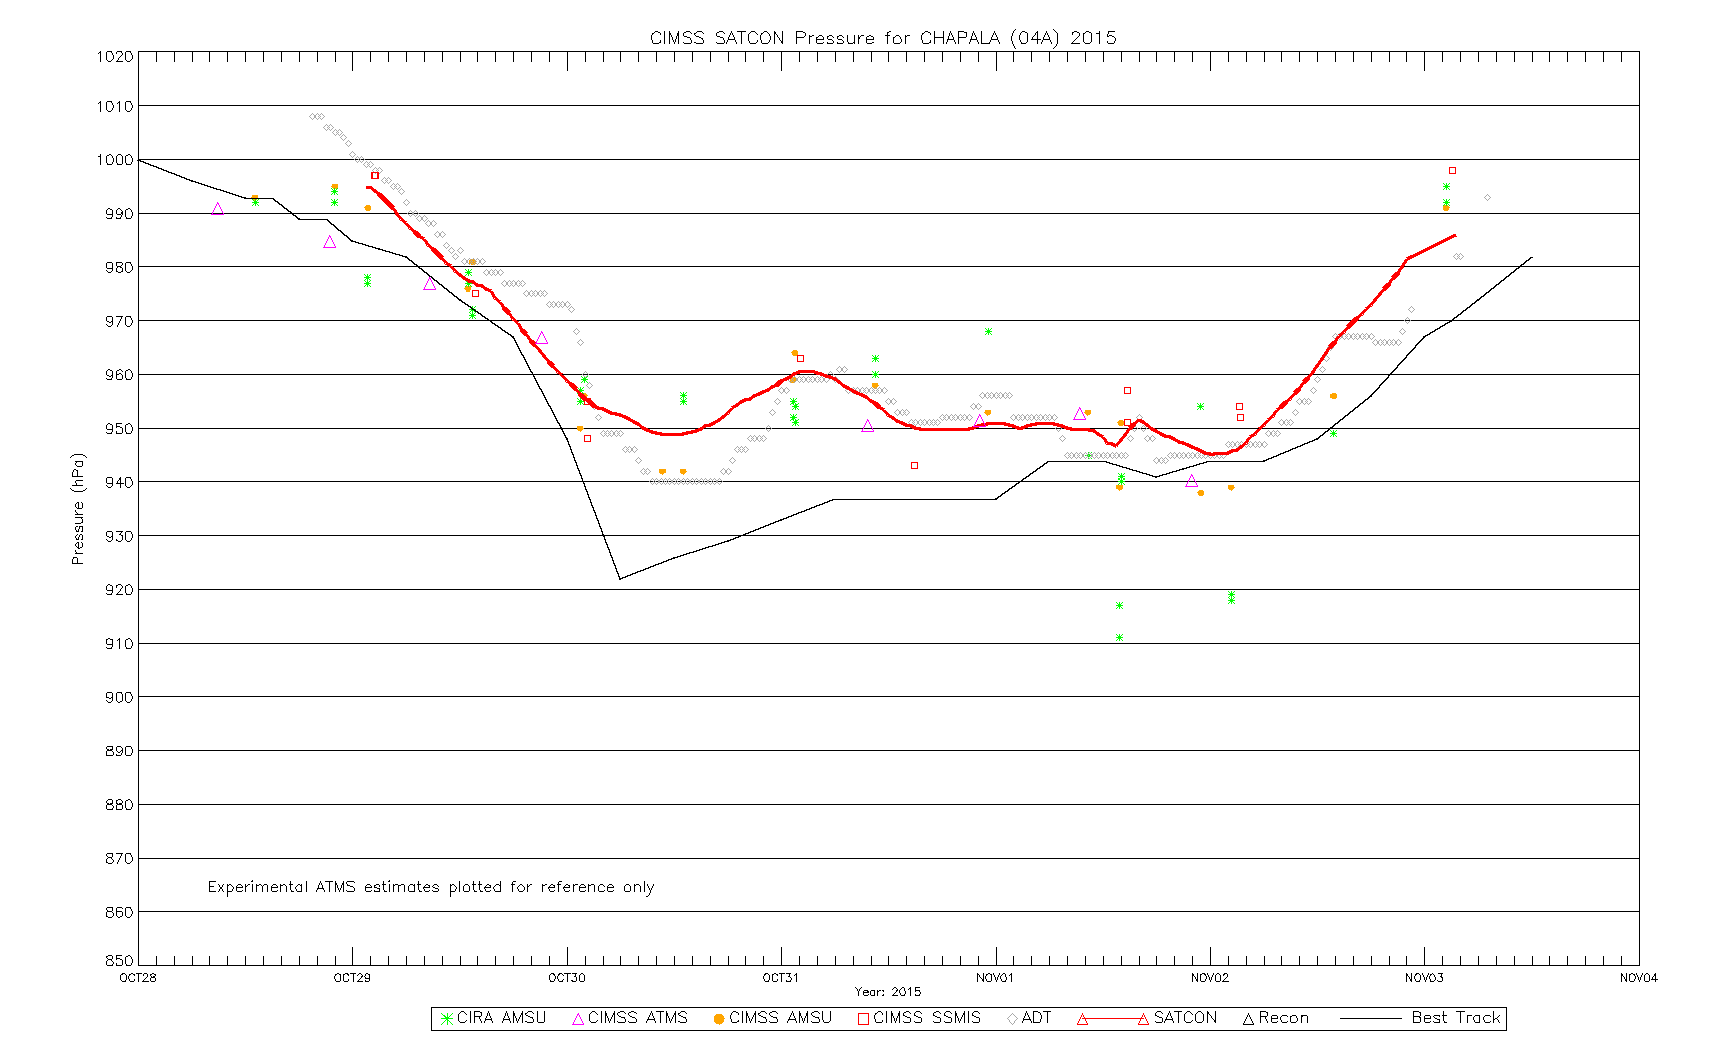
Data from the Indian Satellite Kalpana-1 (data courtesy of the Indian Space Research Organization) shows a peak intensity — as measured by the warmest pixel in the eye — occurred around 1015 UTC on 30 October 2015. The warmest brightness temperature warmed 15 K between 1015 UTC and 1345 UTC.
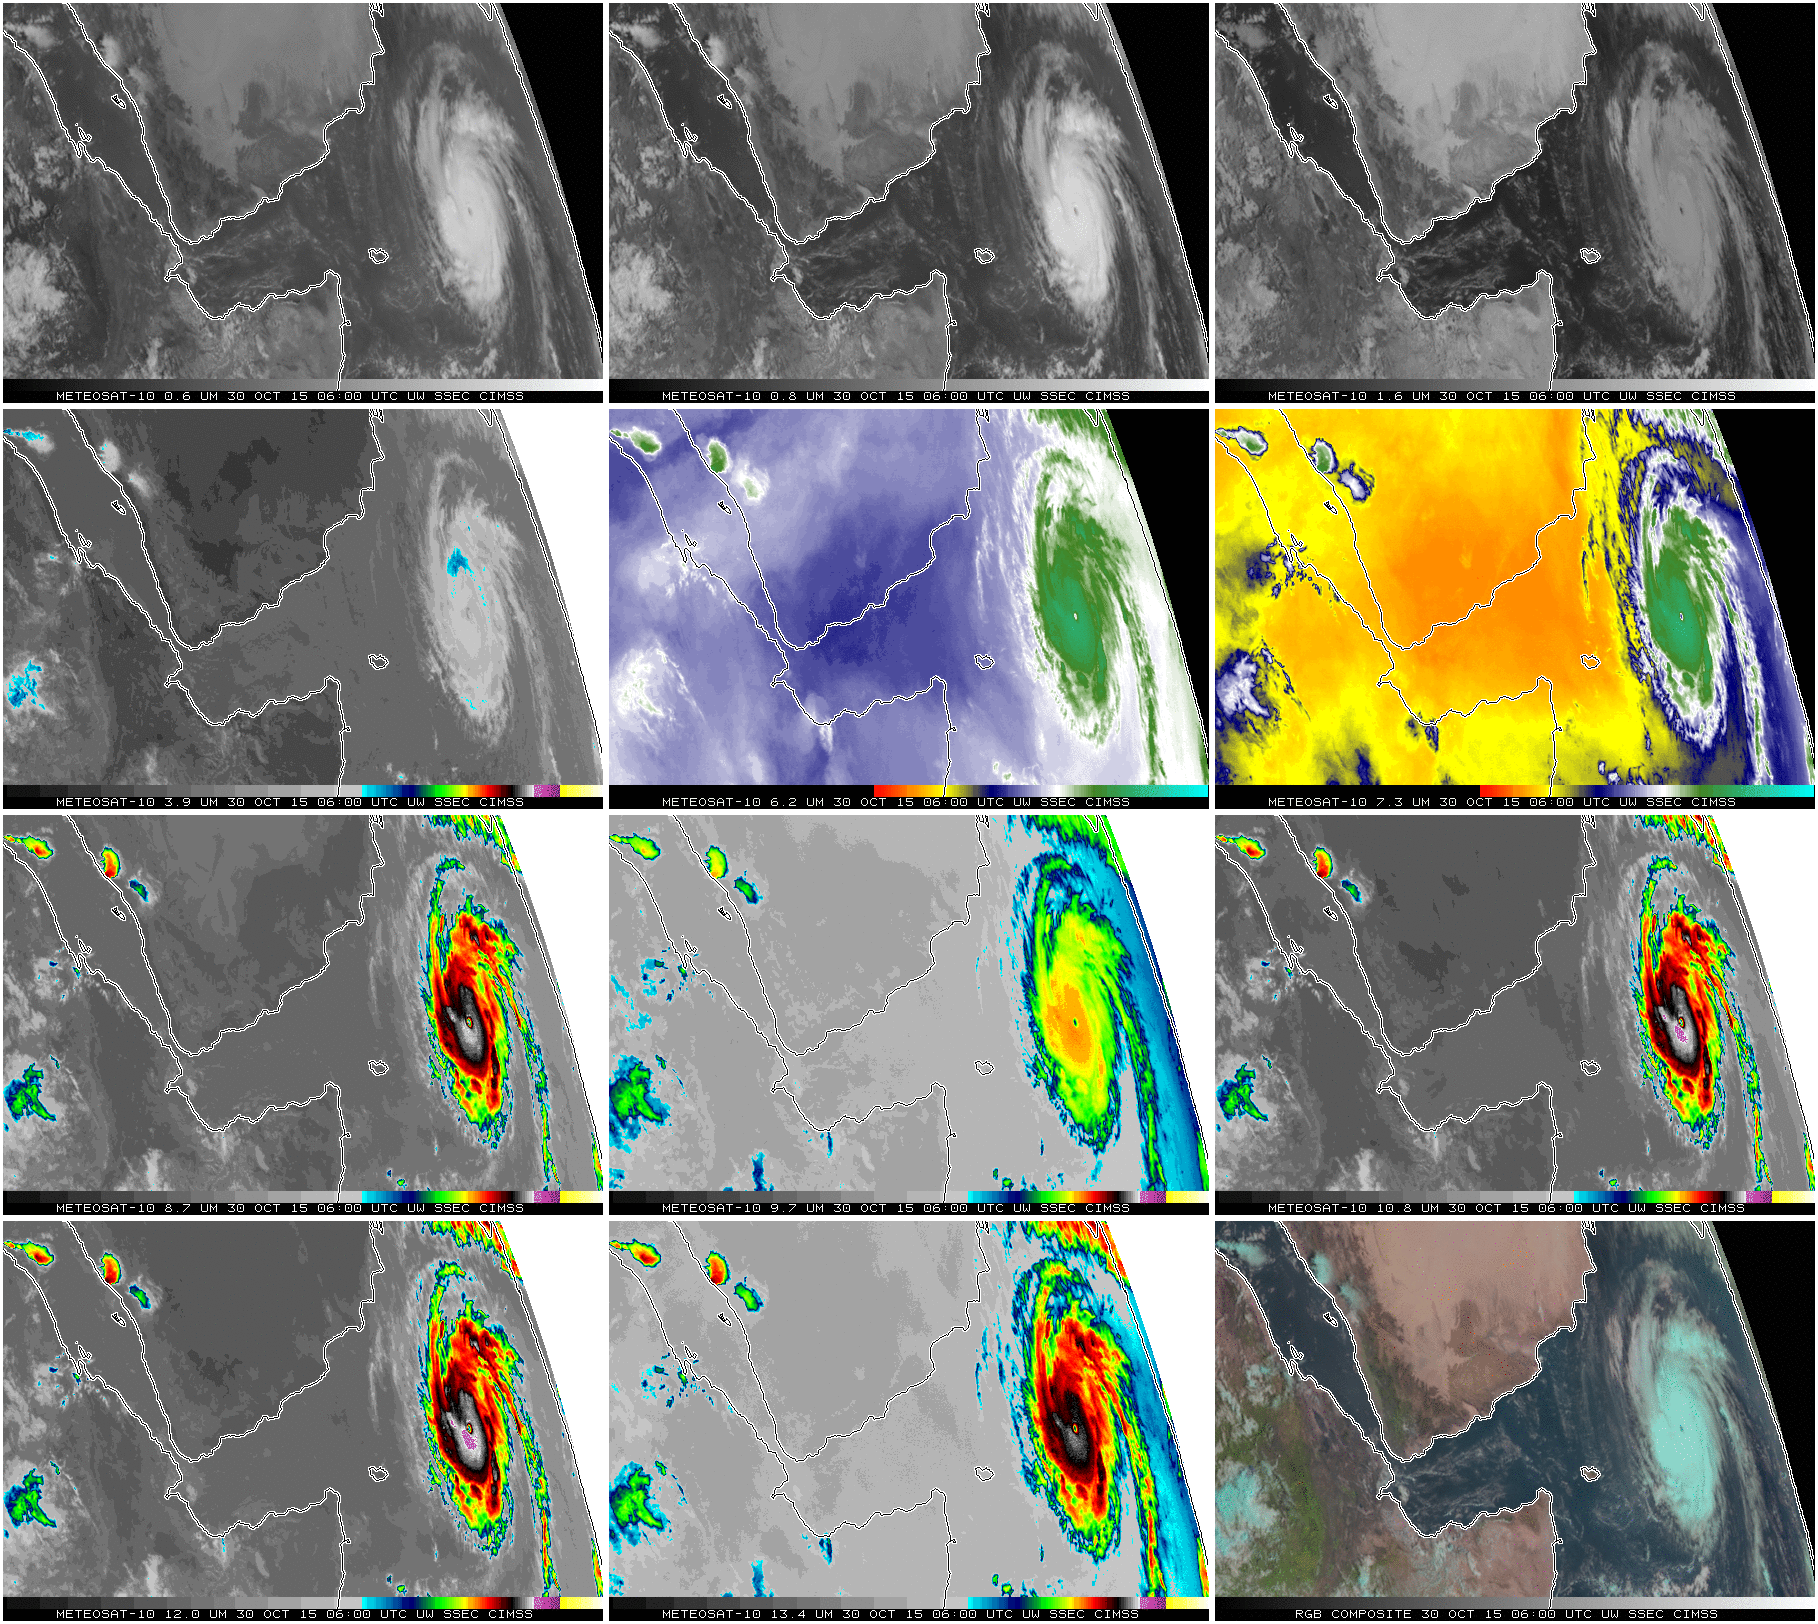
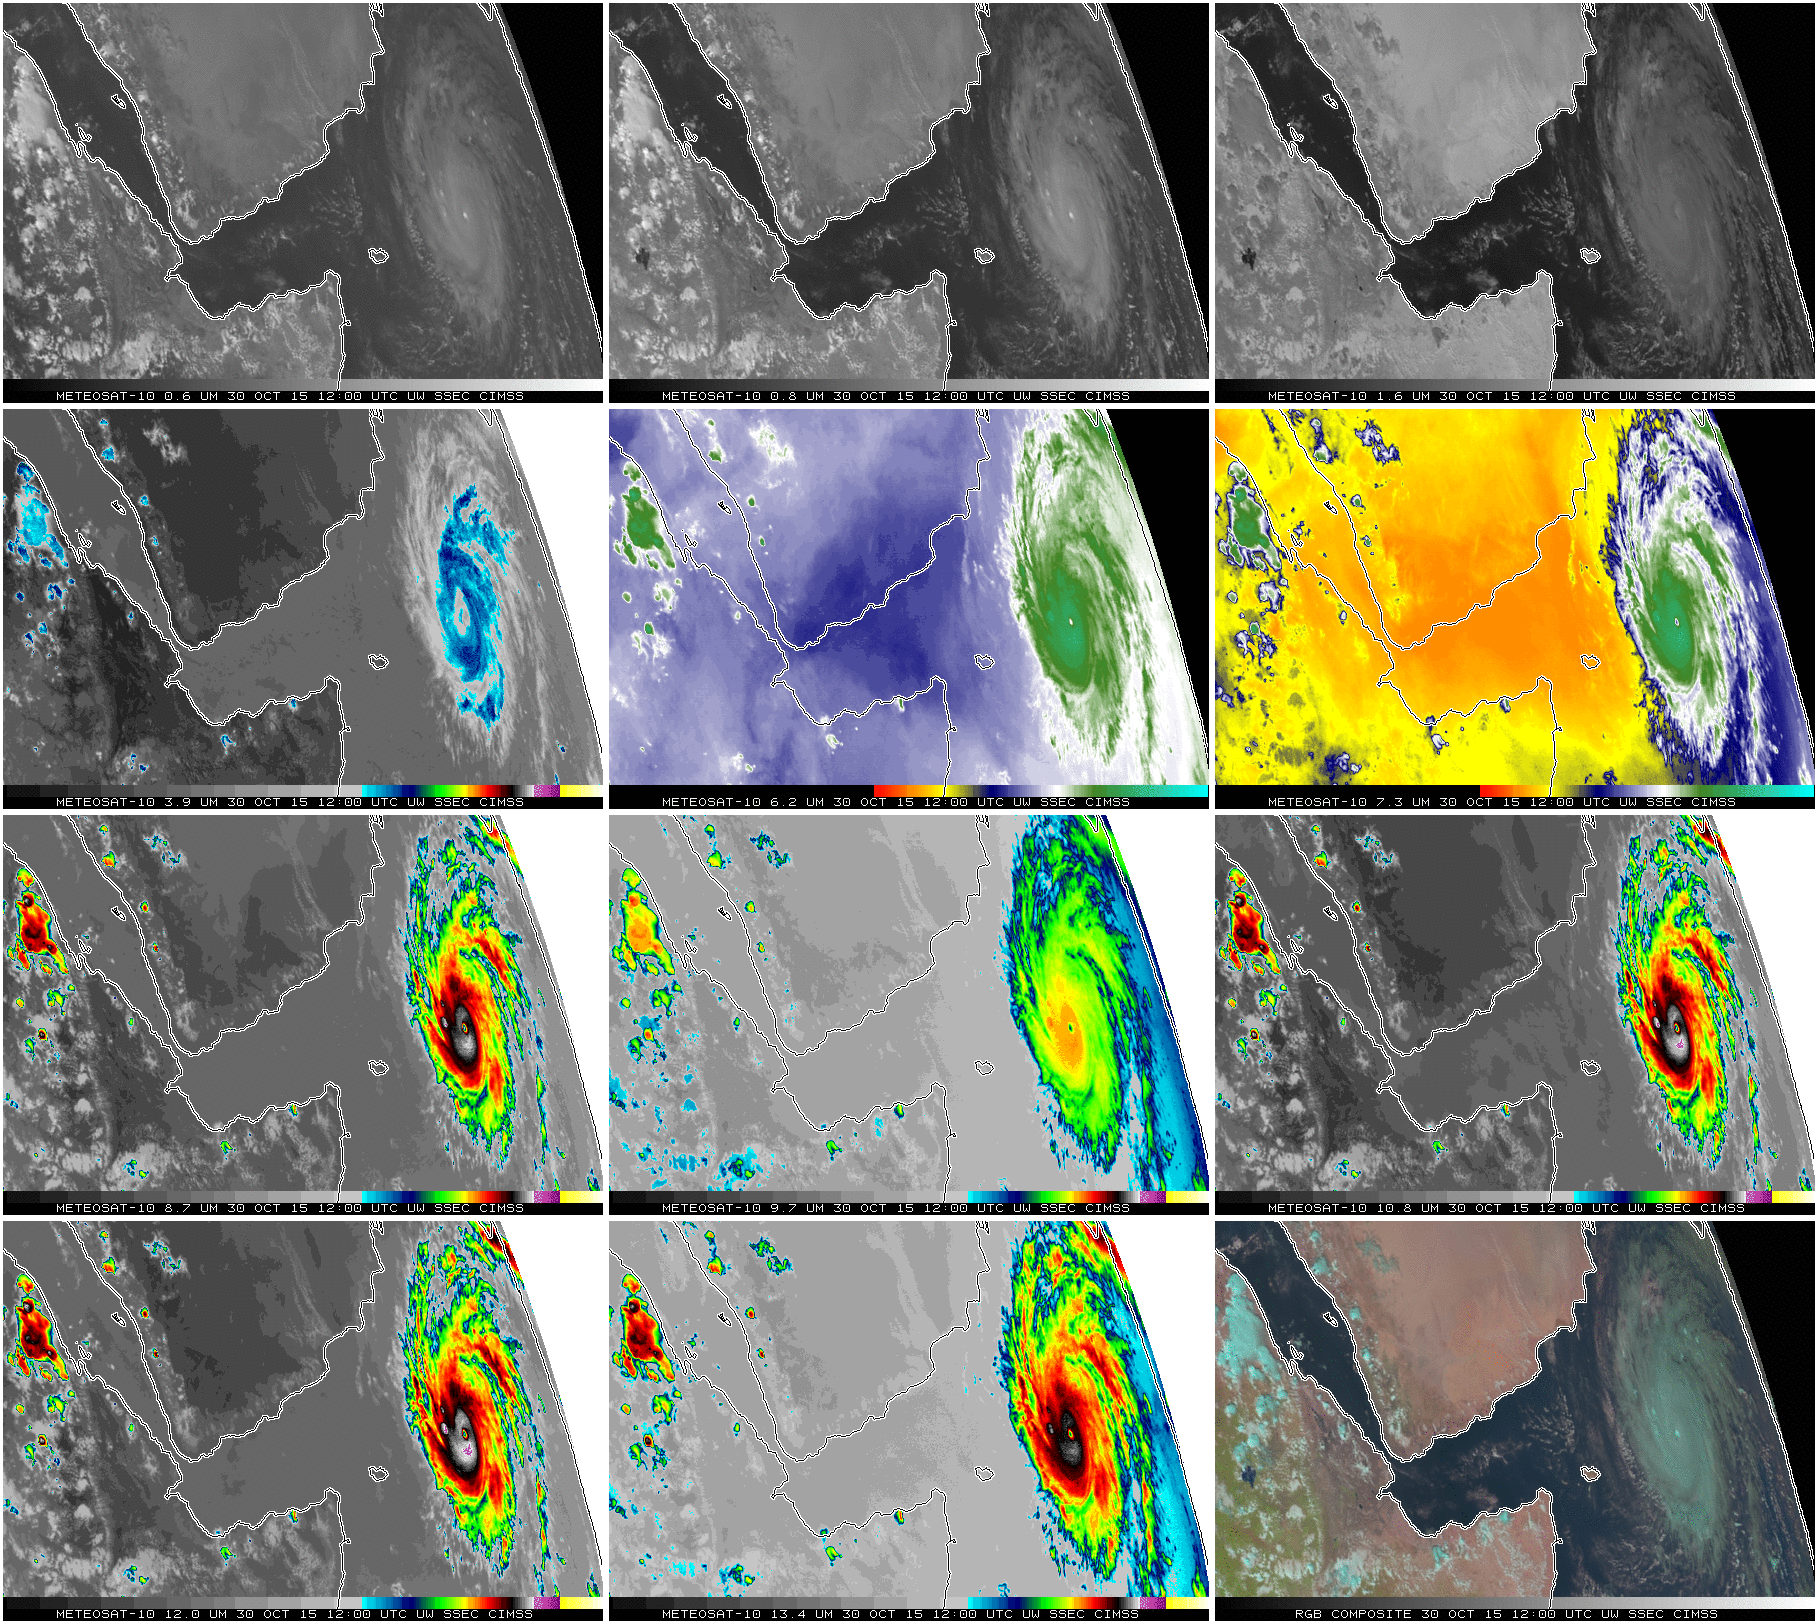
Meteosat-10 viewed the storm as well, and all 11 channels from 0300 to 1500 UTC, including 0600 and 1200 UTC, are shown below. The water vapor channels, in particular, show the very dry air over the Arabian Peninsula. In addition, the animation shows gradual warming of the coldest cloud tops. Data from Meteosat-7, (source) viewing the Indian Ocean, shows the rapid intensification of this small storm. (See also this Meteosat-7 Visible imagery courtesy of the British Met Office).
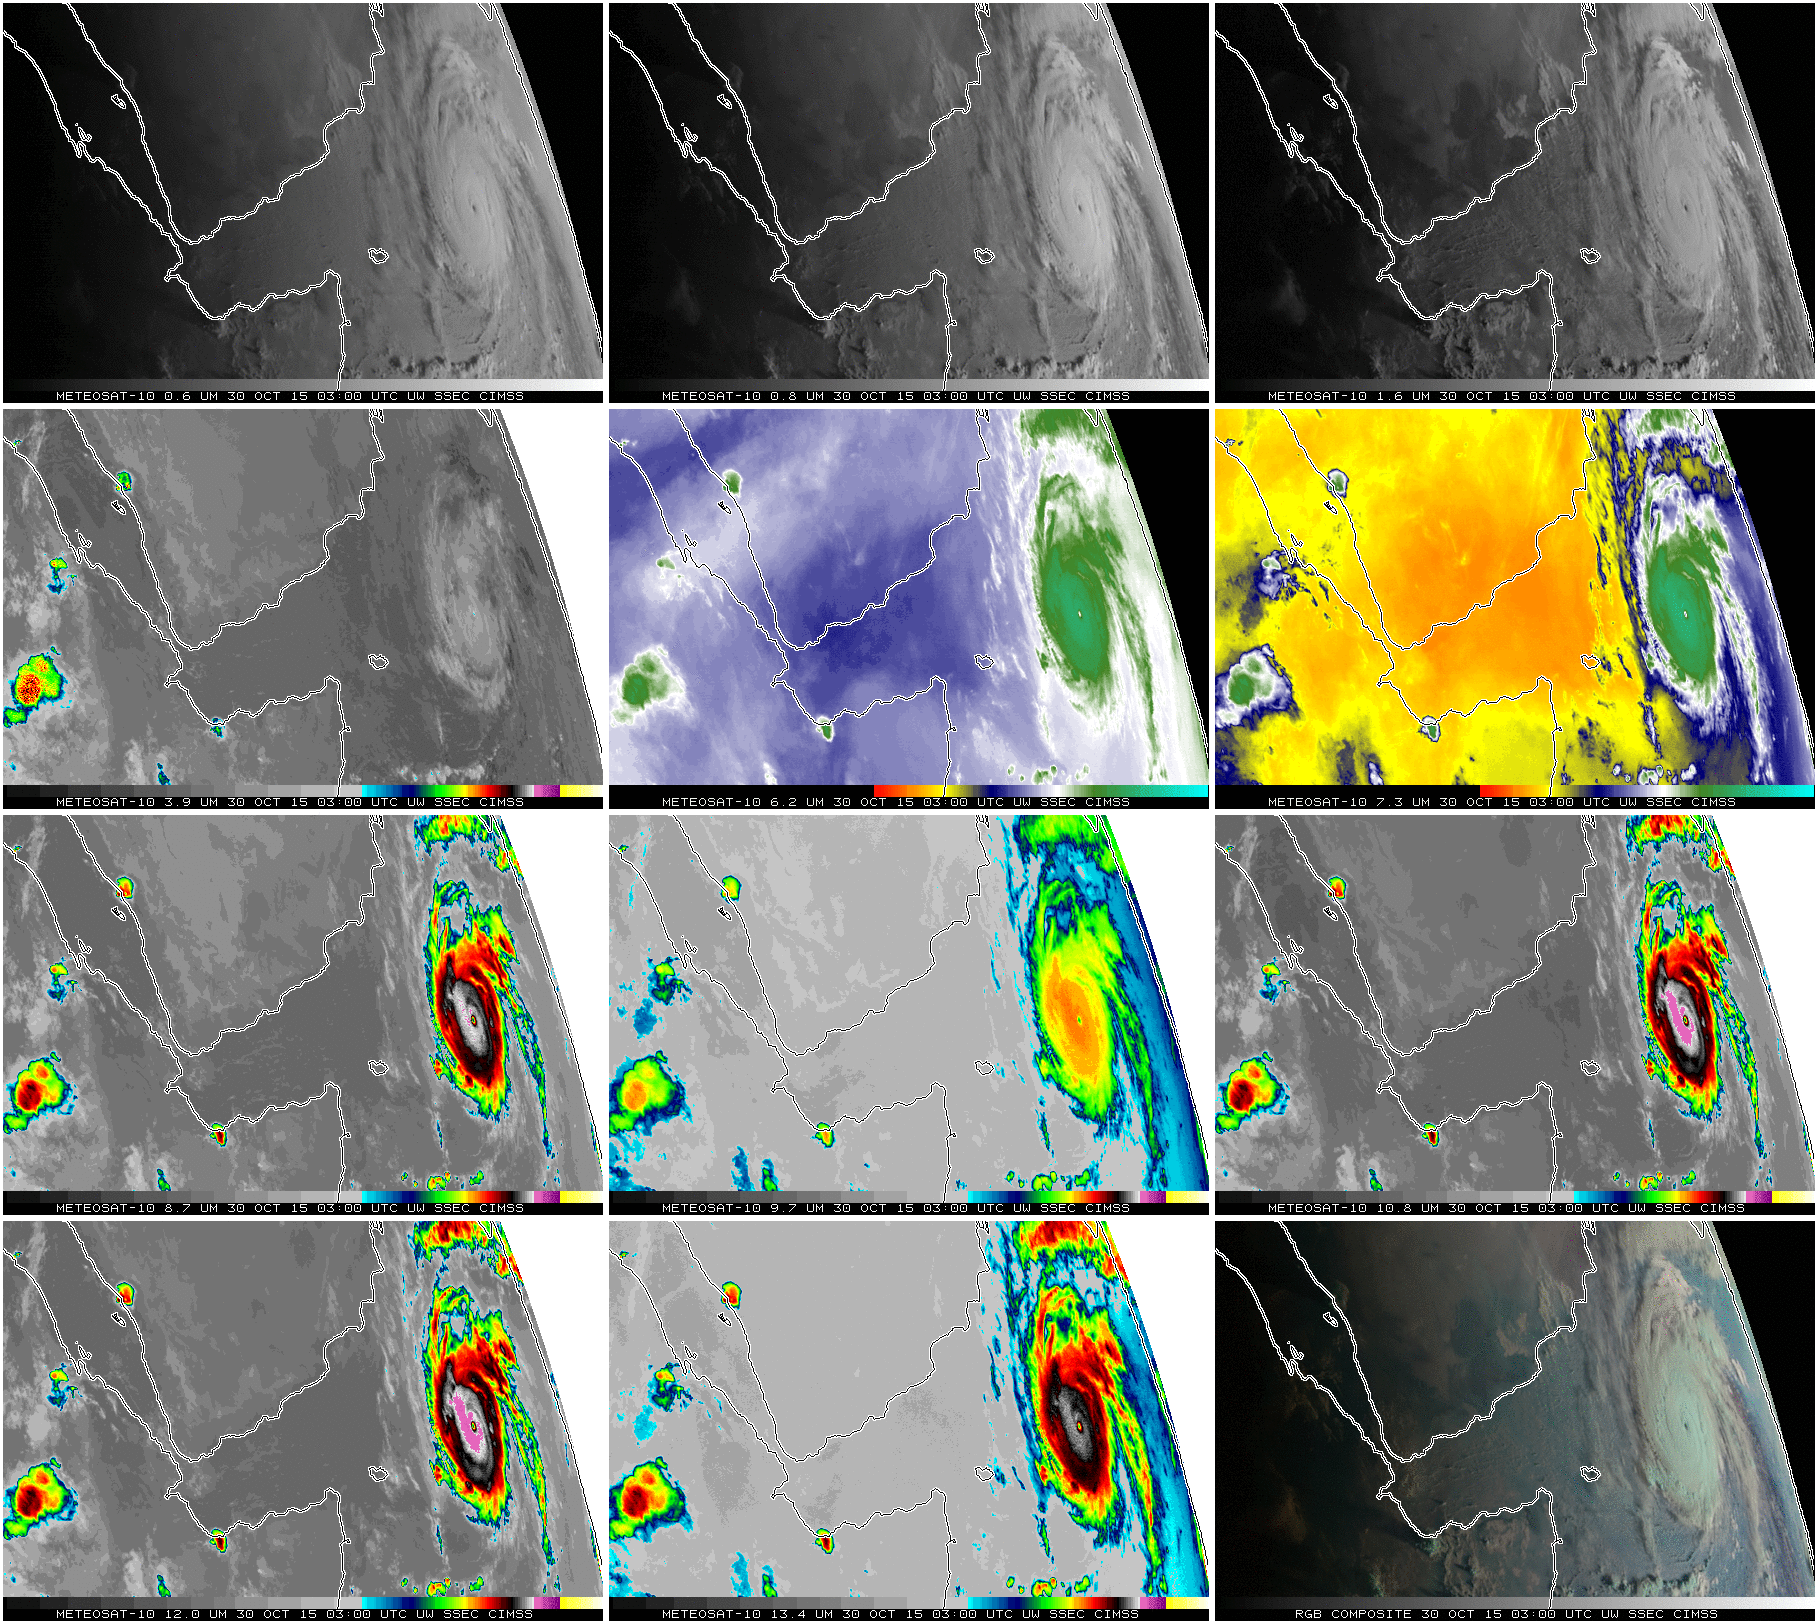
Multispectral imagery from Meteosat-10 for 0300 to 1500 UTC, 30 October 2015. Row 1: 0.6 µm, 0.8 µm, 1.6 µm ; Row 2: 3.9 µm, 6.2 µm, 7.3 µm ; Row 3: 8.7 µm, 9.7 µm, 10.8 µm; Row 4: 12.0 µm, 13.4 µm, RGB Composite of 0.6 µm, 0.8 µm and 1.6 µm (Click to enlarge)
See also this blog post on this rare event.
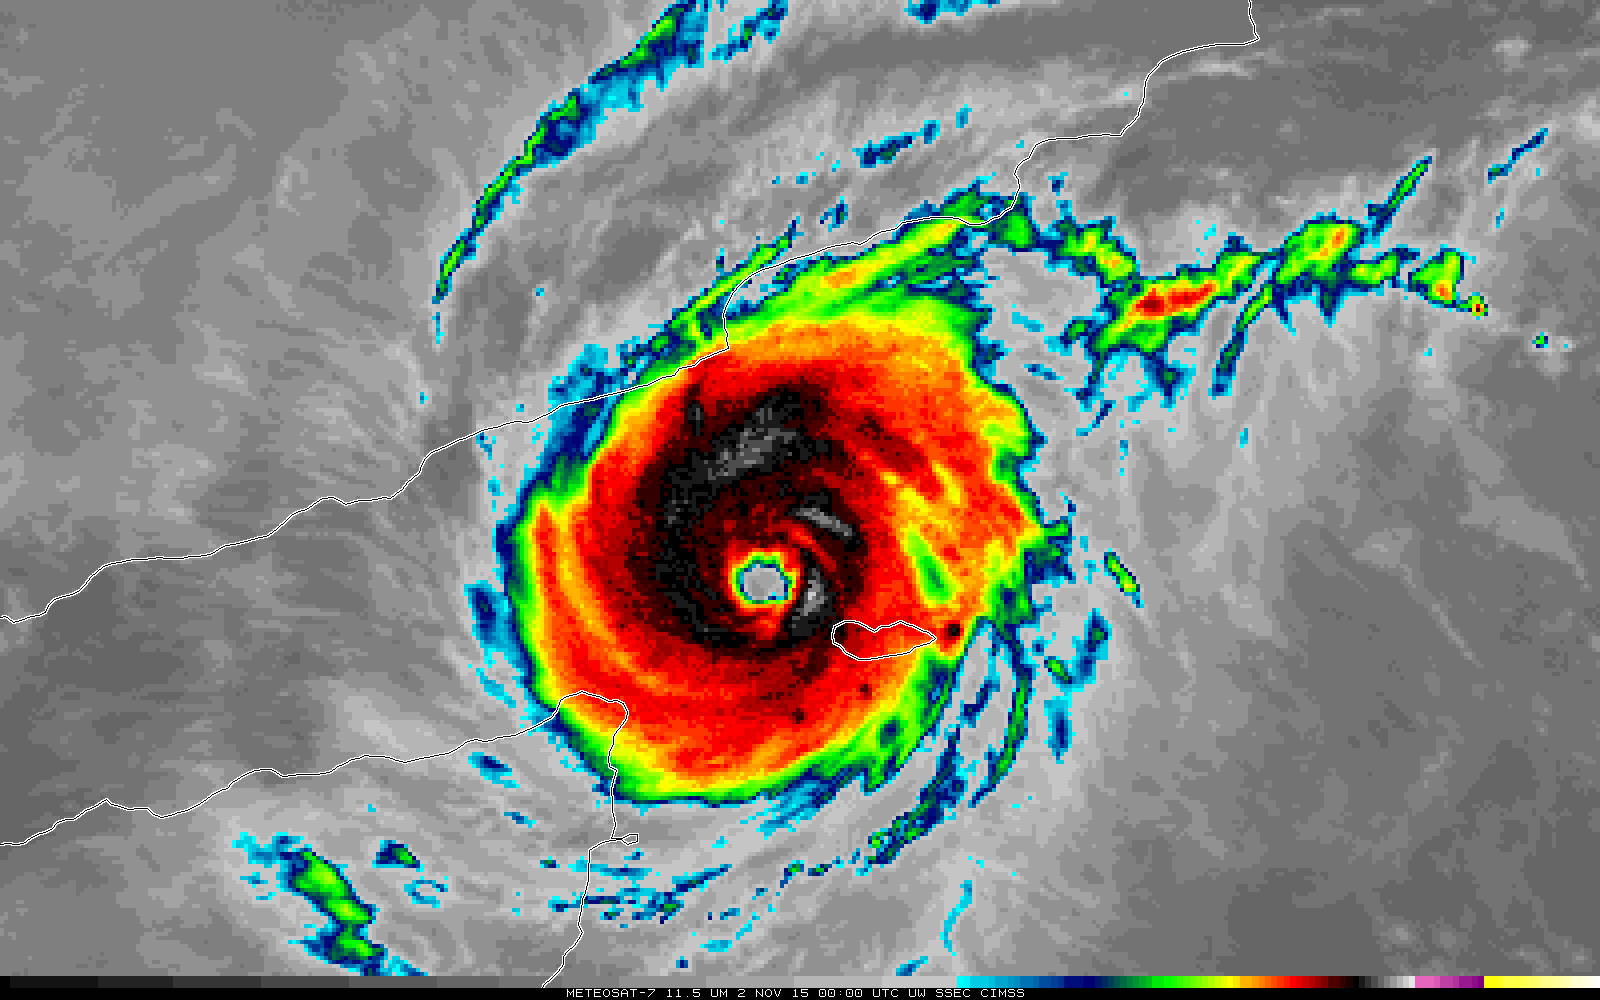
Cyclone Gonu in 2007 also affected the Arabian Peninsula (and Iran). The toggle below shows Meteosat-7 imagery of the two storms near their respective peak intensities (Chapala’s intensity plot with time is shown here). Gonu was a far more symmetric storm with more expansive cold clouds tops, but the overall sizes of both storms were similar.

Meteosat-7 11.5 µm imagery over Cyclone Gonu at 1730 UTC on 4 June 2007, and over Cyclone Chapala at 0900 UTC on 30 October 2015 (Click to enlarge)
INSAT-3D viewed the storm as well. The near-infrared 0.86 µm imagery, above, highlights the land-sea differences very well as well as showing a compact eye.
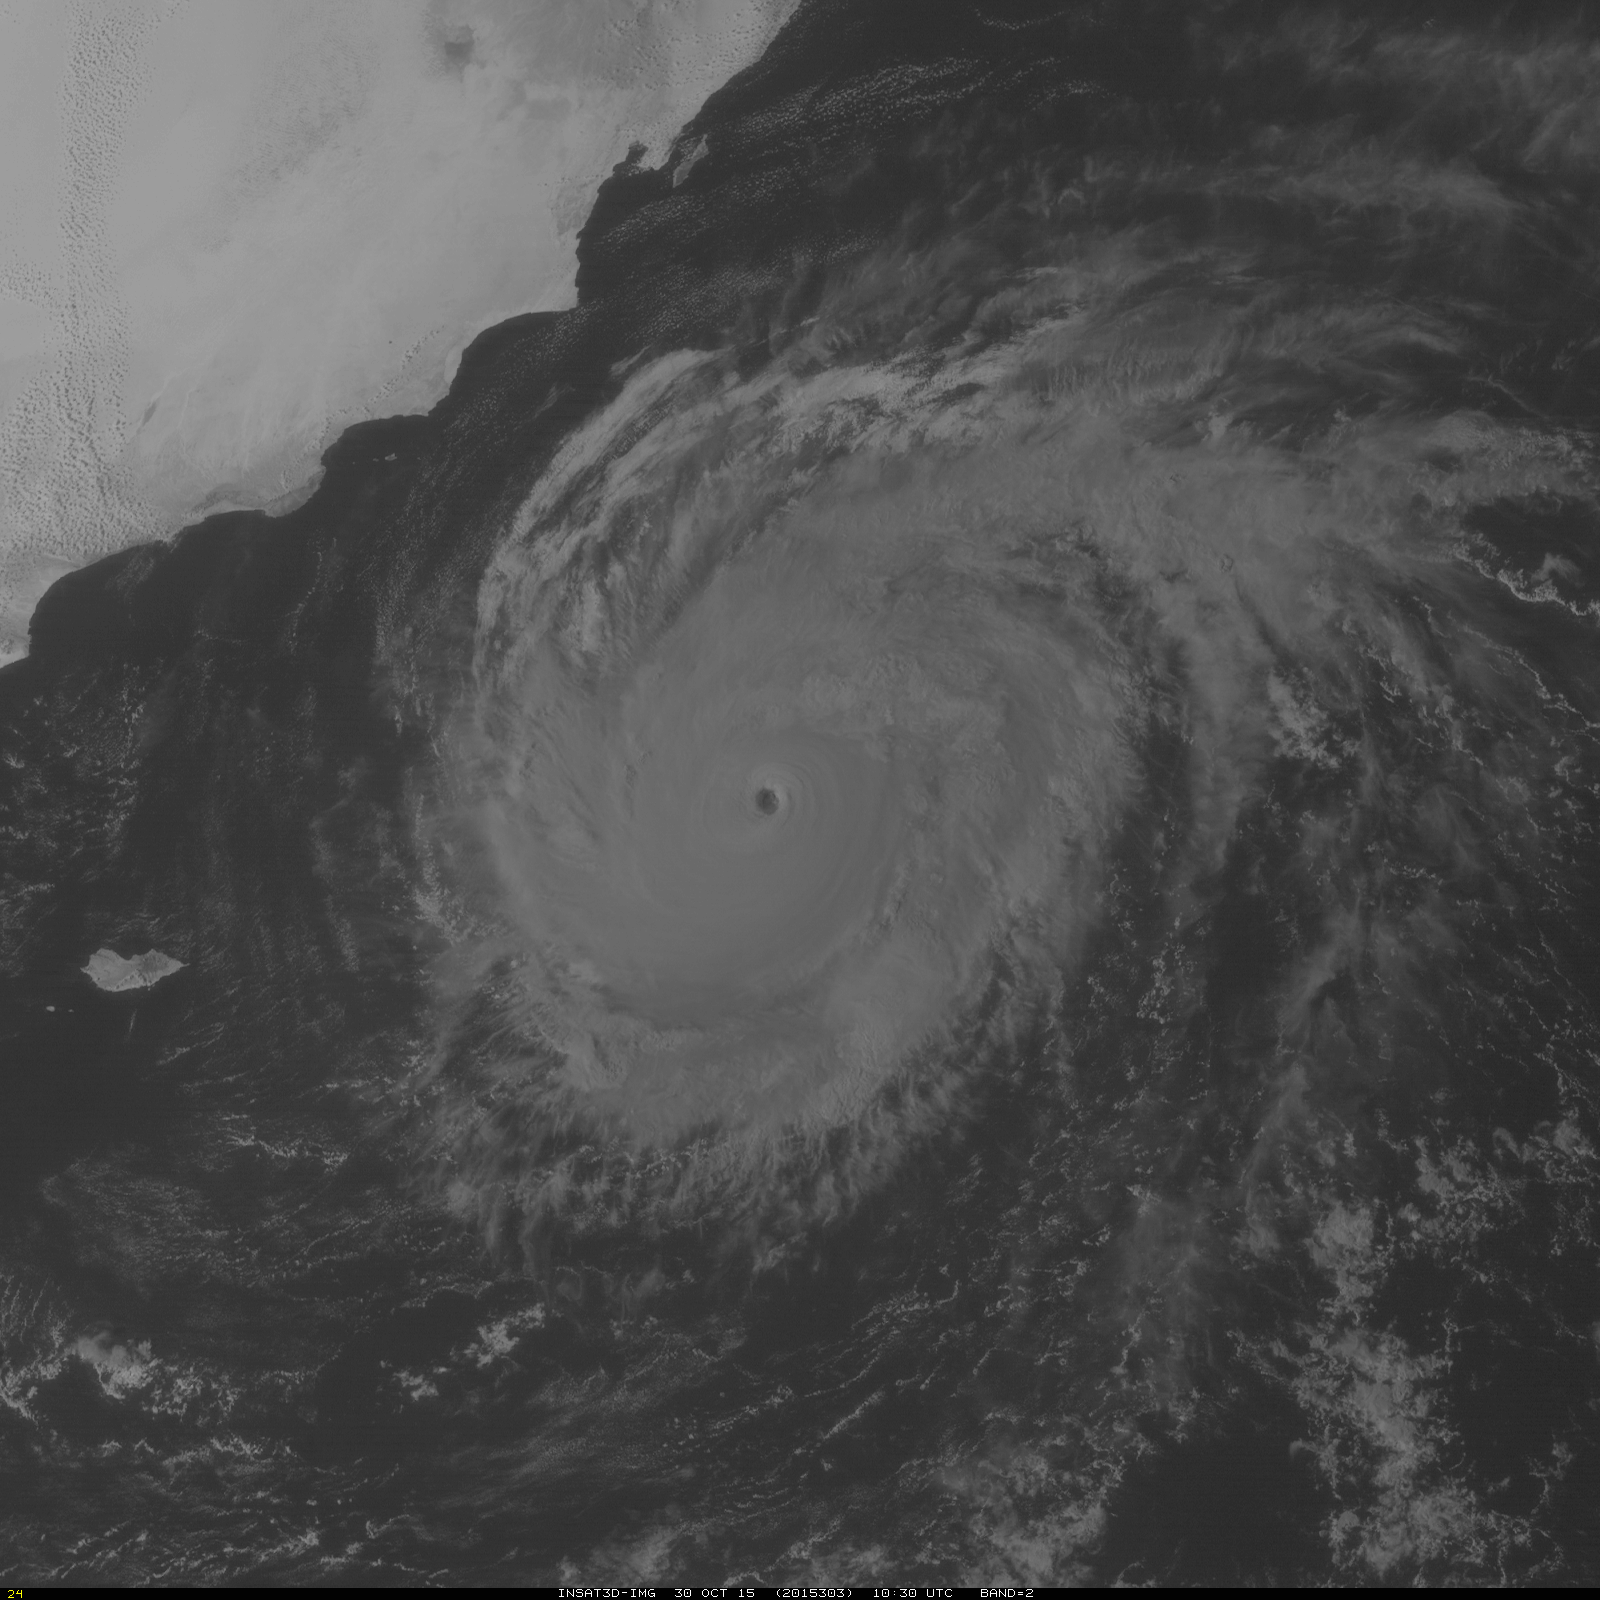
INSAT-3D 0.86 µm imagery Cyclone Chapala at 1030 UTC on 30 October 2015 (Click to enlarge)
A Suomi NPP VIIRS true-color Red/Green/Blue (RGB) image of Cyclone Chapala is shown below.
![Suomi NPP VIIRS true-color image [click to enlarge]](https://cimss.ssec.wisc.edu/satellite-blog/wp-content/uploads/sites/5/2015/10/151030_suomi_npp_viirs_truecolor_Cyclone_Chapala.jpg)
Suomi NPP VIIRS true-color image [click to enlarge]
View only this post
Read Less
![GOES-13 Visible (0.63 µm) image, Metop ASCAT and RTMA surface winds, METAR surface reports, and surface frontal analysis [click to enlarge]](https://cimss.ssec.wisc.edu/satellite-blog/wp-content/uploads/sites/5/2015/11/GOES13_vis_ascat_rtma_winds_metars_fronts_screenCapture-20151103_160000.png)
![GOES-13 Visible (0.63 µm) images with METAR surface reports [click to play animation]](https://cimss.ssec.wisc.edu/satellite-blog/wp-content/uploads/sites/5/2015/11/151103_goes13_visible_Lake_Superior_fog_stratus_advection_anim.gif)
![Suomi NPP VIIRS Visible (0.64 µm) image with METAR surface reports, RTMA surface winds, and surface frontal analysis [click to enlarge]](https://cimss.ssec.wisc.edu/satellite-blog/wp-content/uploads/sites/5/2015/11/151103_1848utc_viirs_visible_metars_rtma_winds_fronts_anim.gif)
![GOES-13 Low Cloud Thickness product [click to enlarge]](https://cimss.ssec.wisc.edu/satellite-blog/wp-content/uploads/sites/5/2015/11/151103_goes13_Low_Cloud_Thickness_anim.gif)

![Suomi NPP VIIRS I05 (11.45 µm) Infrared Image, 2127 UTC on 2 November [click to enlarge]](https://cimss.ssec.wisc.edu/satellite-blog/wp-content/uploads/sites/5/2015/11/I05_110215_2127_TCChapala_zoom.png)
![UK Met Office OSTIA Sea Surface Temperature analyses [click to enlarge]](https://cimss.ssec.wisc.edu/satellite-blog/wp-content/uploads/sites/5/2015/11/151023-151105_ukmo_ostia_sst_Arabian_Sea_Chapapa_wake_anim.gif)
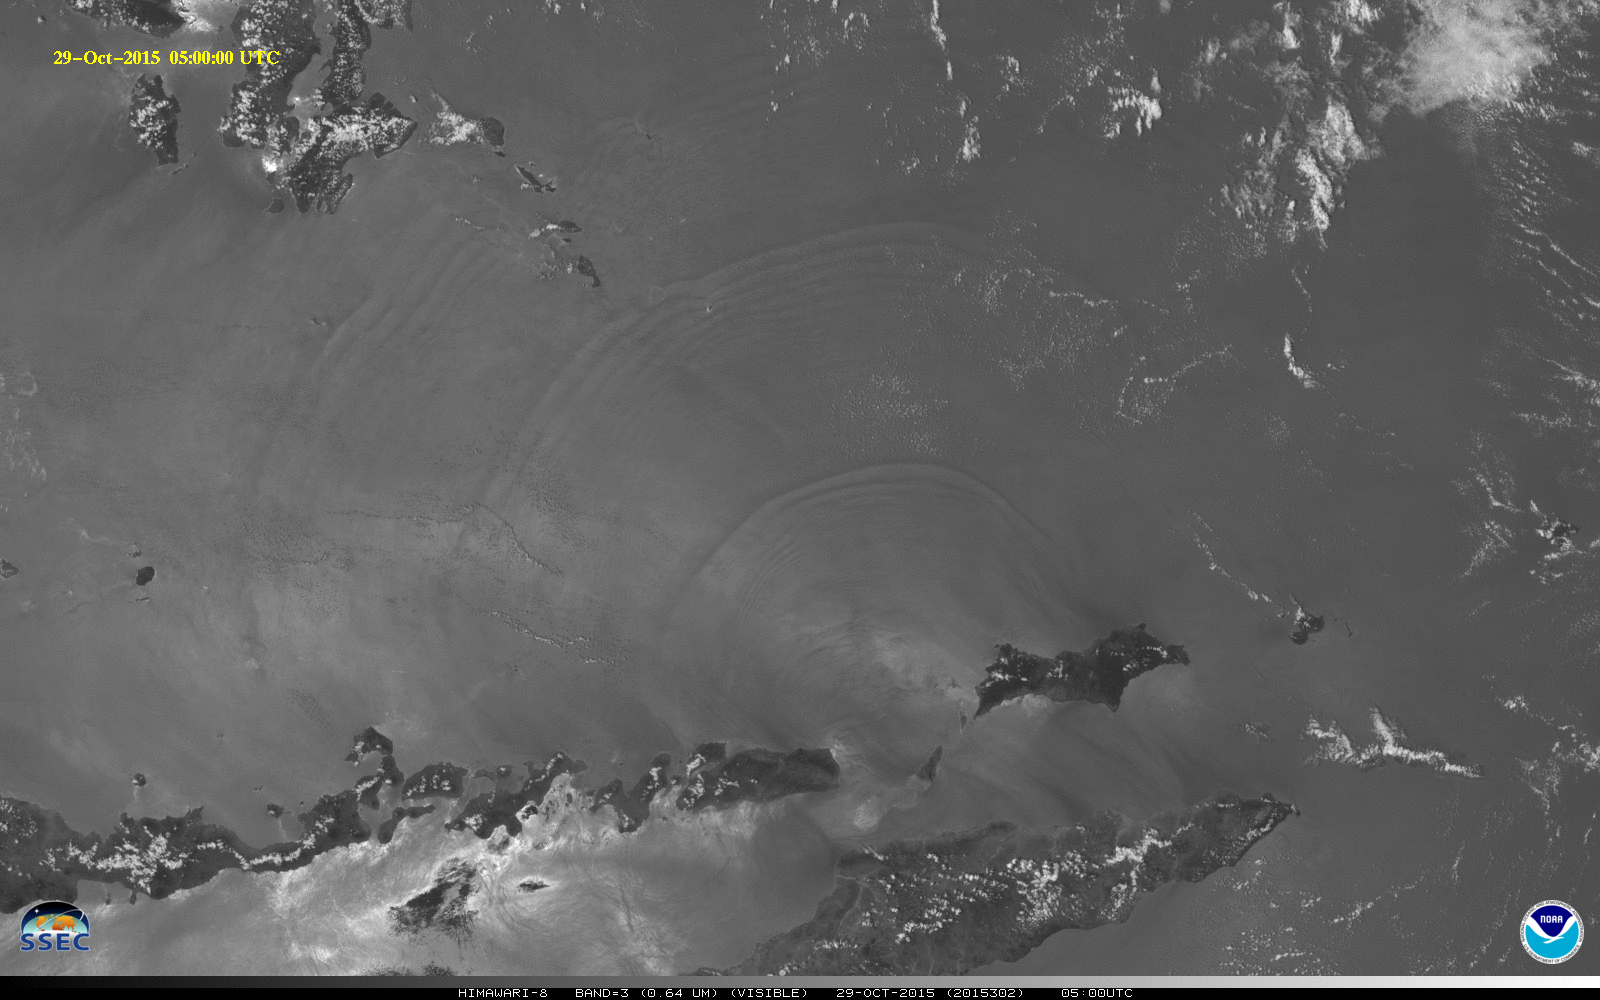
![Himawari-8 Band 3 Visible (0.64 µm) images from 29 October [click to play animation]](https://cimss.ssec.wisc.edu/satellite-blog/wp-content/uploads/sites/5/2015/12/1000x1600_AHIM08_B3_H8_INTERNALWAVES_OCT_animated_2015302_025000_86_2015302_065000_86_GRAY.gif)
![MTSAT-2 Visible (0.73 µm) images from 29 October, 0232-0632 UTC [click to play animation]](https://cimss.ssec.wisc.edu/satellite-blog/wp-content/uploads/sites/5/2015/12/1000x1600_AMTSAT02_B1_MTSAT_INTERNALWAVES_OCT_animated_2015302_023200_85_2015302_063200_85_GRAY.gif)
![COMS-1 Visible (0.675 µm) images from 29 October, 0100-0630 UTC [click to play animation]](https://cimss.ssec.wisc.edu/satellite-blog/wp-content/uploads/sites/5/2015/12/1000x1600_ACOMS_B1_COMS1_INTERNALWAVES_OCT_animated_2015302_010000_250_2015302_063000_250_GRAY.gif)
