GOES-16 (GOES-East) “Red” Visible (0.64 µm) images (above) revealed a curious pattern of waves moving east-northeastward across a patch of mid-level clouds over central Lake Michigan during the morning hours on 23 June 2018.In an effort to determine the vertical extent of these waves, a look at GOES-16 Low-level Water Vapor (7.3 µm), Mid-level... Read More

GOES-16 “Red” Visible (0.64 µm) images, with hourly plots of surface reports [click to play animation]
GOES-16
(GOES-East) “Red” Visible (
0.64 µm) images
(above) revealed a curious pattern of waves moving east-northeastward across a patch of mid-level clouds over central Lake Michigan during the morning hours on
23 June 2018.
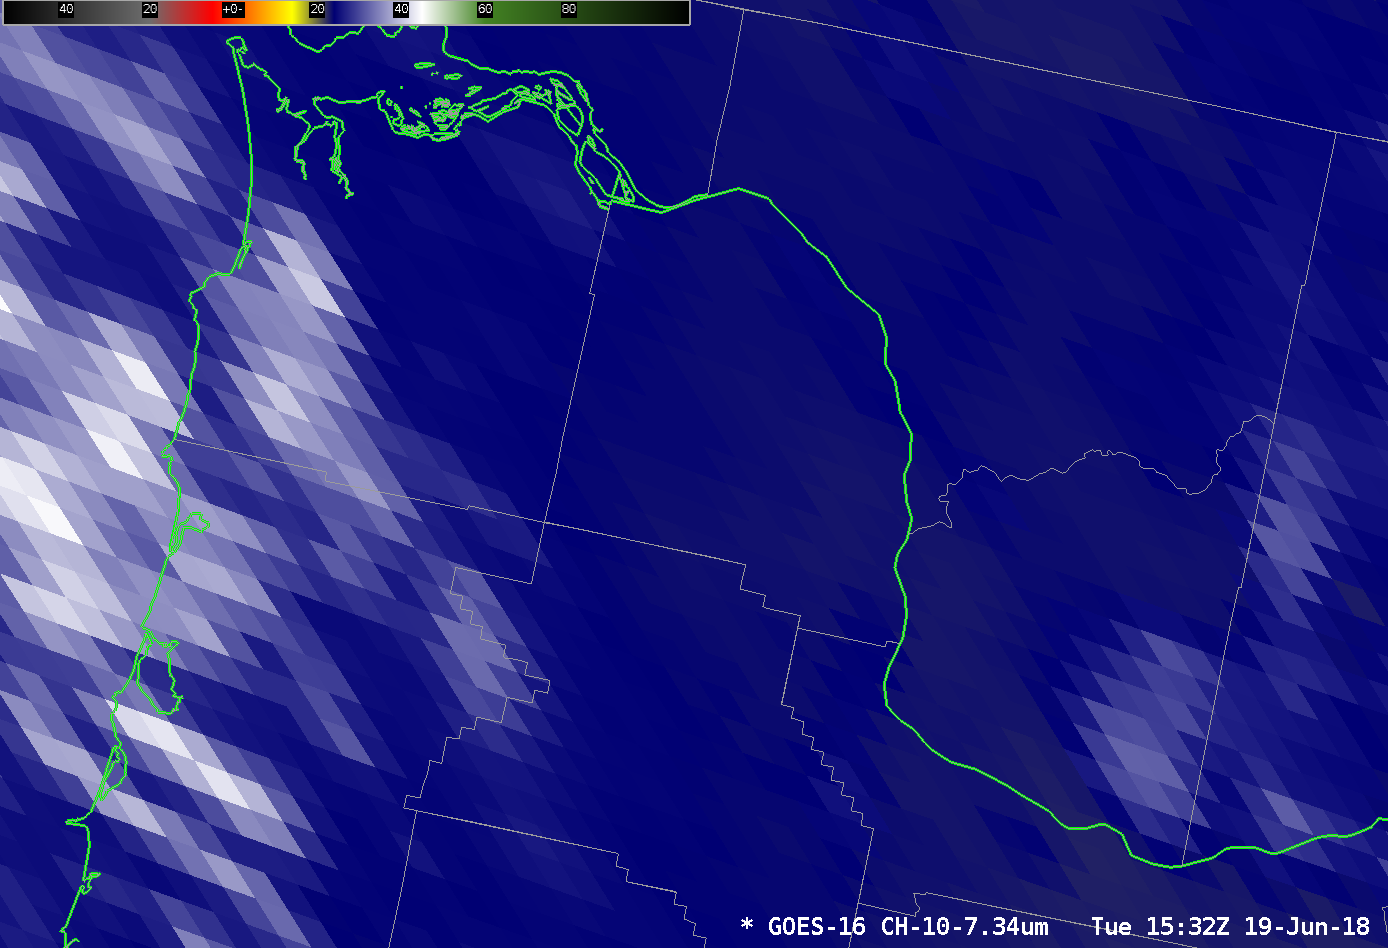
In an effort to determine the vertical extent of these waves, a look at GOES-16 Low-level Water Vapor (7.3 µm), Mid-level Water Vapor (6.9 µm) and Upper-level Water Vapor (6.2 µm) images from the UW-Madison AOS site (below) showed a signature of waves propagating northeastward across the region during the 0802-2102 UTC time period.
![GOES-16 Low-level Water Vapor (7.3 µm) images [click to play MP4 animation]](https://cimss.ssec.wisc.edu/satellite-blog/wp-content/uploads/sites/5/2018/06/goes16_wv10_201806231302_wi.jpg)
GOES-16 Low-level Water Vapor (7.3 µm) images [click to play MP4 animation]
![GOES-16 Mid-level Water Vapor (6.9 µm) images [click to play MP4 animation]](https://cimss.ssec.wisc.edu/satellite-blog/wp-content/uploads/sites/5/2018/06/goes16_wv9_201806231302_wi.jpg)
GOES-16 Mid-level Water Vapor (6.9 µm) images [click to play MP4 animation]
![GOES-16 Upper-level Water Vapor (6.2 µm) images [click to play MP4 animation]](https://cimss.ssec.wisc.edu/satellite-blog/wp-content/uploads/sites/5/2018/06/goes16_wv8_201806231302_wi.jpg)
GOES-16 Upper-level Water Vapor (6.2 µm) images [click to play MP4 animation]
There also were scattered pilot reports of light to moderate turbulence across the region as these waves were moving through, including one report of
continuous Clear Air Turbulence at 36,000 feet over eastern Wisconsin. Due to the subtle nature of these waves, their signature was not as obvious in the 8-bit McIDAS-X Water Vapor images shown below as they were in 16-bit imagery displayed above (or what would be displayed using AWIPS II).
![GOES-16 Low-level (7.3 µm) images, with hourly pilot reports of turbulence [click to play animation]](https://cimss.ssec.wisc.edu/satellite-blog/wp-content/uploads/sites/5/2018/06/G16_WV10_LK_MICHIGAN_TURB_23JUN2018_960x1280_B10_2018174_142226_0001PANEL_00065.GIF)
GOES-16 Low-level Water Vapor (7.3 µm) images, with hourly pilot reports of turbulence [click to play animation]
![GOES-16 Mid-level (6.9 µm) images, with hourly pilot reports of turbulence [click to play animation]](https://cimss.ssec.wisc.edu/satellite-blog/wp-content/uploads/sites/5/2018/06/G16_WV9_LK_MICHIGAN_TURB_23JUN2018_960x1280_B9_2018174_150226_0001PANEL_00073.GIF)
GOES-16 Mid-level Water Vapor (6.9 µm) images, with hourly pilot reports of turbulence [click to play animation]
![GOES-16 Upper-level (6.2 µm) images, with hourly pilot reports of turbulence [click to play animation]](https://cimss.ssec.wisc.edu/satellite-blog/wp-content/uploads/sites/5/2018/06/G16_WV8_LK_MICHIGAN_TURB_23JUN2018_960x1280_B8_2018174_132226_0001PANEL_00053.GIF)
GOES-16 Upper-level Water Vapor (6.2 µm) images, with hourly pilot reports of turbulence [click to play animation]
The waves were passing over eastern Wisconsin around the time of ascent of the 12 UTC sounding balloon launched from
Green Bay (and continuous turbulence was reported at
38,000 feet) — a plot of
weighting functions for the three GOES-16 Water Vapor bands
(below) showed
peak pressures in the 424-328 hPa (22,800-28,885 feet) range, although significant contributions of energy were still evident from the 300 hPa pressure level (31,000 feet) or higher.
![GOES-16 Water Vapor weighting functions, calculated using 12 UTC rawinsonde data from Green Bay, Wisconsin [click to enlarge]](https://cimss.ssec.wisc.edu/satellite-blog/wp-content/uploads/sites/5/2018/06/180623_12utc_kgrb_water_vapor_weighting_functions.jpeg)
GOES-16 Water Vapor weighting functions, calculated using 12 UTC rawinsonde data from Green Bay, Wisconsin [click to enlarge]
About an hour prior to the start of the 2-km resolution (at nadir or sub-satellite point) GOES-16 Water Vapor animations, 1-km resolution Aqua MODIS Water Vapor (6.7 µm) imagery at 0801 UTC
(below) showed a long narrow wave packet (oriented northwest to southeast) from far western Wisconsin to central Illinois — and these waves were also apparent along the tops of mid-level clouds along the Iowa/Illinois border. Was this the leading edge of the waves seen farther northeast over the Great Lakes during the subsequent morning and afternoon hours?
![Aqua MODIS Water Vapor (6.7 µm) and Infrared Window (11.0 µm) images, with plots of pilot reports [click to enlarge]](https://cimss.ssec.wisc.edu/satellite-blog/wp-content/uploads/sites/5/2018/06/180623_0801utc_aqua_modis_water_vapor_infrared_waves_anim.gif)
Aqua MODIS Water Vapor (6.7 µm) and Infrared Window (11.0 µm) images, with plots of pilot reports [click to enlarge]
All things considered, the lack of a clear forcing mechanism for these waves qualifies this case to be placed into the “
What the heck is this” blog category until a coherent explanation can be put forward…
View only this post
Read Less
![GOES-16 Low-level (7.3 µm) images, with hourly pilot reports of turbulence [click to play animation]](https://cimss.ssec.wisc.edu/satellite-blog/wp-content/uploads/sites/5/2018/06/180623_goes16_water_vapor_band_10_Lake_Michigan_waves_anim.gif)
![GOES-16 Mid-level (6.9 µm) images, with hourly pilot reports of turbulence [click to play animation]](https://cimss.ssec.wisc.edu/satellite-blog/wp-content/uploads/sites/5/2018/06/180623_goes16_water_vapor_band_9_Lake_Michigan_waves_anim.gif)
![GOES-16 Upper-level (6.2 µm) images, with hourly pilot reports of turbulence [click to play animation]](https://cimss.ssec.wisc.edu/satellite-blog/wp-content/uploads/sites/5/2018/06/180623_goes16_water_vapor_band_8_Lake_Michigan_waves_anim.gif)
![Aqua MODIS Water Vapor (6.7 µm) image, with overlays of surface pressure/fronts (cyan), RUC model 310K equivalent potential temperature (red) and 24-hour precipitation (green) [click to enlarge]](https://cimss.ssec.wisc.edu/satellite-blog/wp-content/uploads/sites/5/2018/06/180621_0814utc_aqua_modis_water_vapor_Upper_Midwest_TROWAL_anim.gif)
![Suomi NPP VIIRS Infrared Window (11.45 µm) images, with plots of surface reports [click to enlarge]](https://cimss.ssec.wisc.edu/satellite-blog/wp-content/uploads/sites/5/2018/06/180621_suomi_npp_viirs_infrared_TROWAL_anim.gif)
![GOES-16 Mid-level Water Vapor (6.9 µm) images, with hourly plots of surface weather type [click to play MP4 animation]](https://cimss.ssec.wisc.edu/satellite-blog/wp-content/uploads/sites/5/2018/06/G16_WV_UPPER_MIDWEST_TROWAL_21JUN2018_960x1280_B9_2018172_080225_0001PANEL_00097.GIF)

