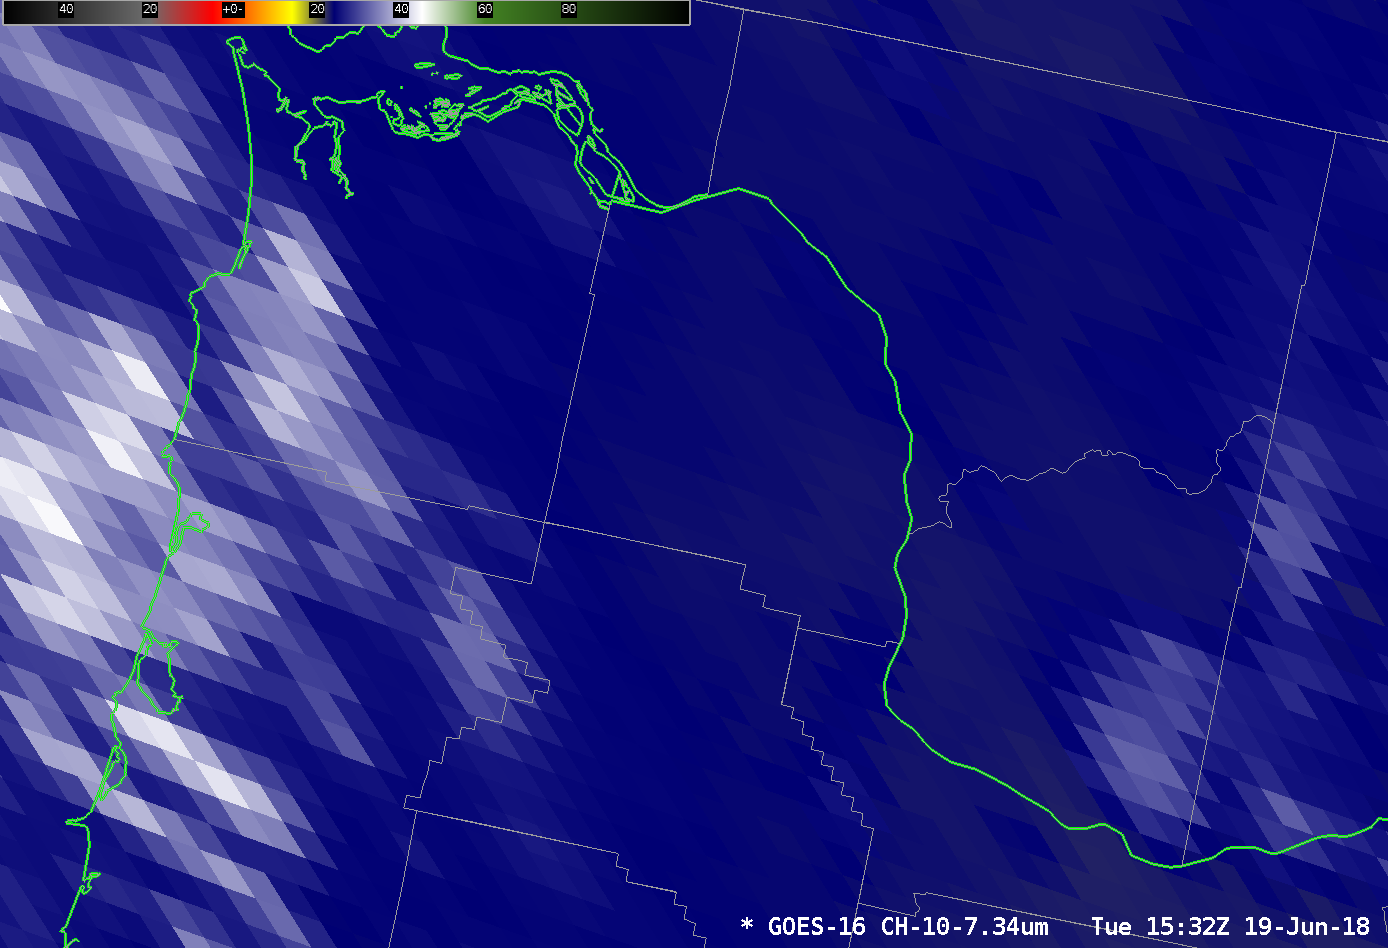
AWIPS imagery of GOES-16 Low-Level Water Vapor (7.34 µm) at 1527 and 1532 UTC on 19 June (Click to enlarge)
Until today, GOES-16 Data that flowed into AWIPS was remapped twice: First, from the observational perspective (that is, how the satellite views it) to a spherical fixed-grid projection that approximates the Earth, and then to a Lambert Conformal projection with (for infrared data) 2-km resolution over the Globe. That Lambert Conformal data was then shipped to AWIPS, where the data were again re-projected into the observational perspective desired by the meteorologist.
The 2-km resolution of the data shipped to AWIPS before today is applicable only at the sub-satellite point (nadir) for GOES-16. Thus, the second remap was suggesting better resolution than was warranted by the data. Additionally, the number of data points needed to be sent was very big.
At 1532 UTC on 19 June, the first fixed-grid format data were directly shipped to AWIPS; remapping to a Lambert Conformal projection is no longer done upstream of AWIPS. The toggle above shows the difference in the 7.34 µm “Low-Level” Infrared Water Vapor imagery over the coast of Oregon, near 46º N, 124º W (very far from the GOES-16 sub-satellite point at 0º N, 75.2º W), in the AWIPS CONUS projection. At 1532 UTC, after the double remap is removed, the pixels are more distinct, and as expected they splay away from the sub-satellite point.
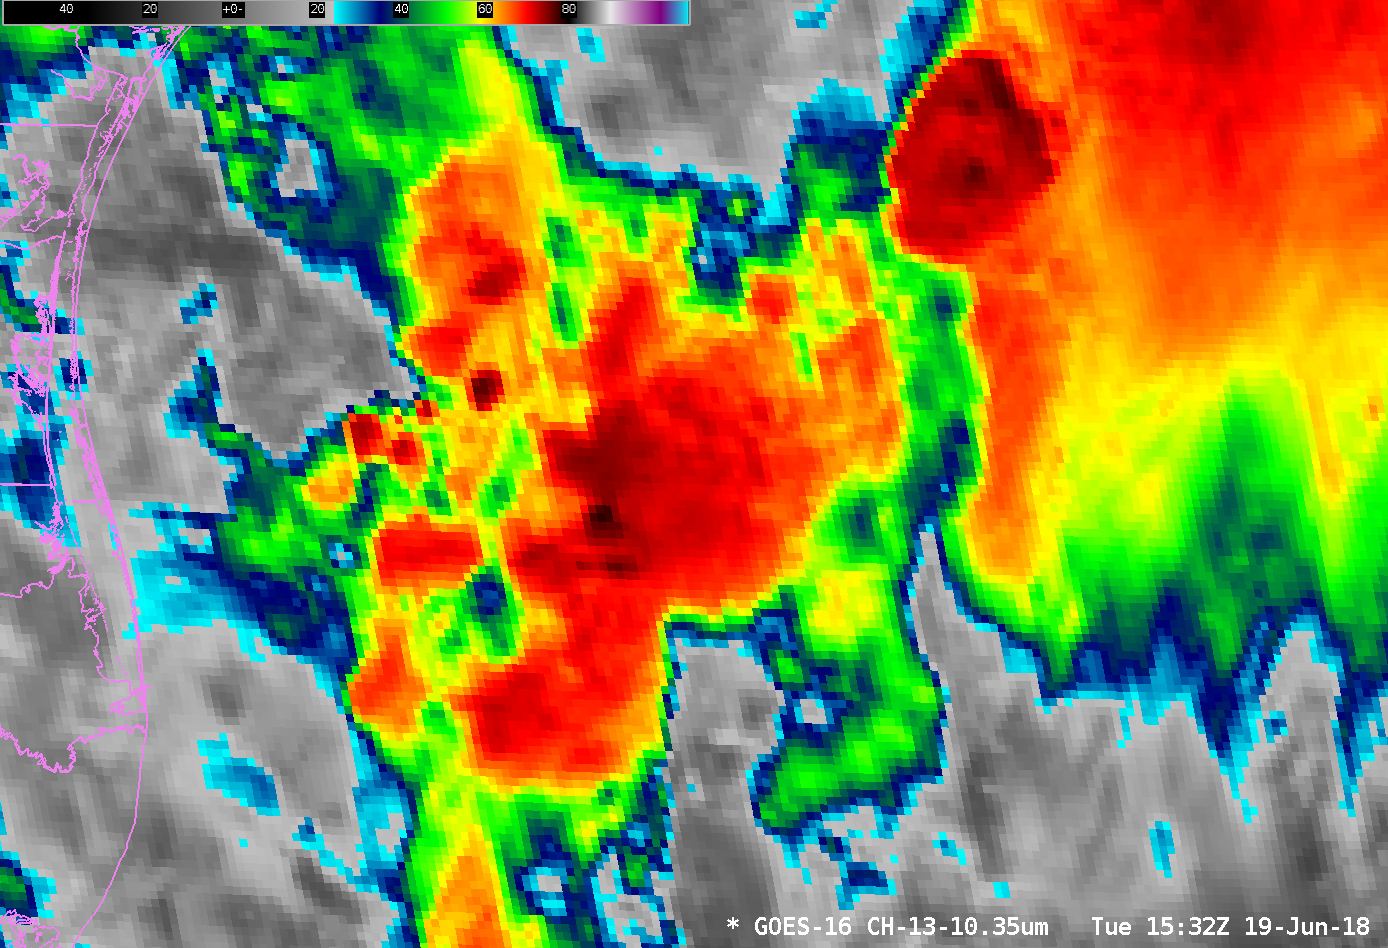
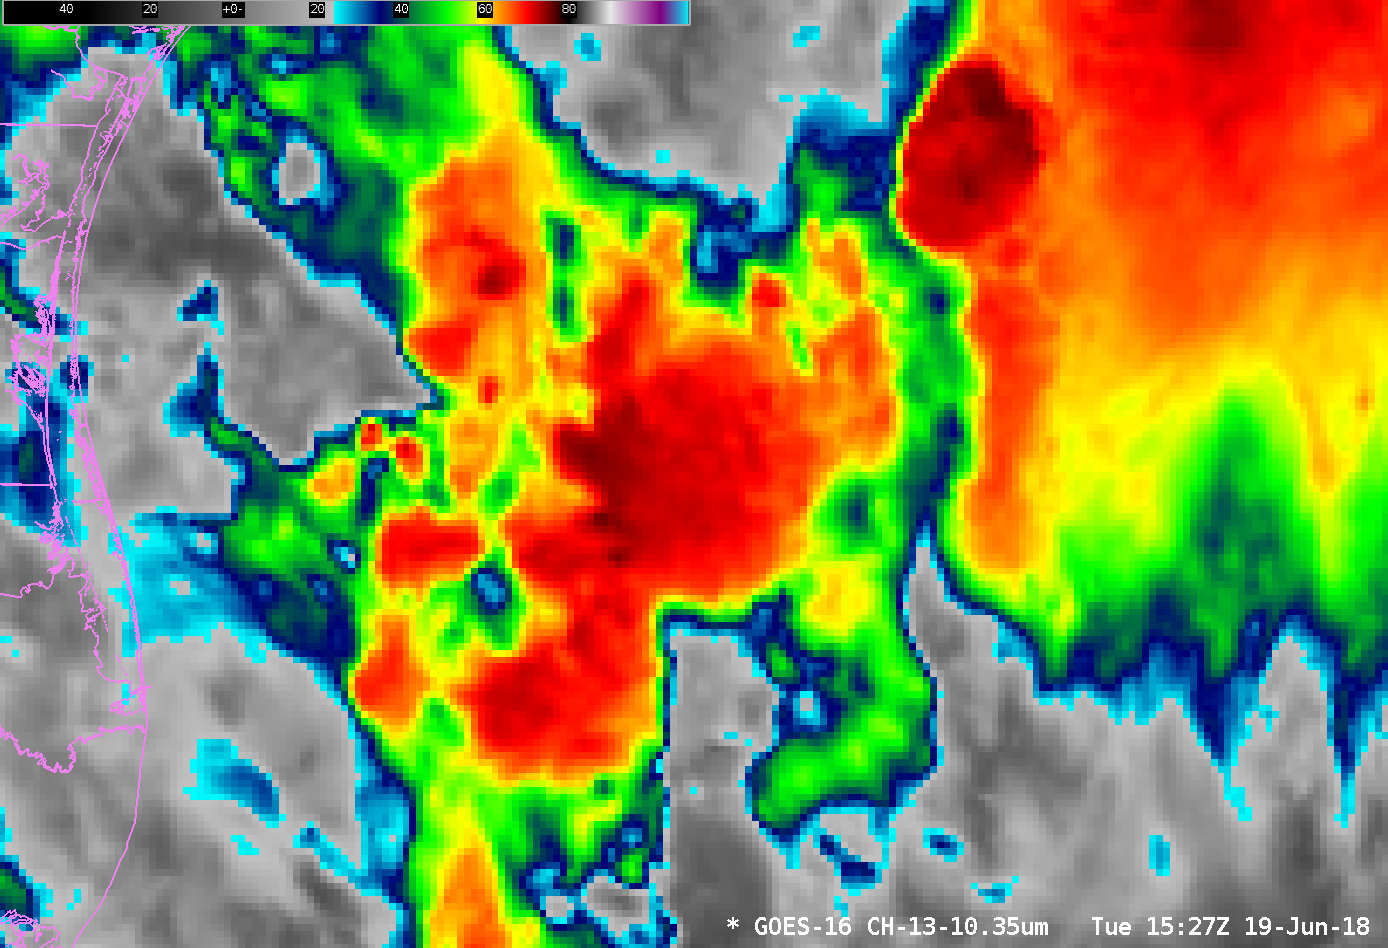
Removing a remapping in the data processing means that pixel-sized extremes — such as overshooting tops, or fires — and gradients will be better represented in the data. Consider the Clean Window (10.3 µm) Infrared imagery below of strong convection over the Gulf of Mexico east of Texas. Overshooting tops Brightness Temperatures are colder and the tops themselves more distinct after 1532 UTC than at 1527 UTC.
AWIPS imagery of GOES-16 Clean Window Infrared Data (10.3 µm) from 1347 to 1612 UTC on 19 June. The animation pauses on the last double-remapped image at 1527 UTC, and the first fixed-grid format image at 1532 UTC (Click to enlarge)
See also this blog post. This training also discusses the remapping. And here (or here) is the National Weather Service announcement on the change.
View only this post Read Less


![12 UTC rawinsonde data from Davenport, Iowa [click to enlarge]](https://cimss.ssec.wisc.edu/satellite-blog/wp-content/uploads/sites/5/2018/06/180618_12UTC_KDVN_RAOB.GIF)
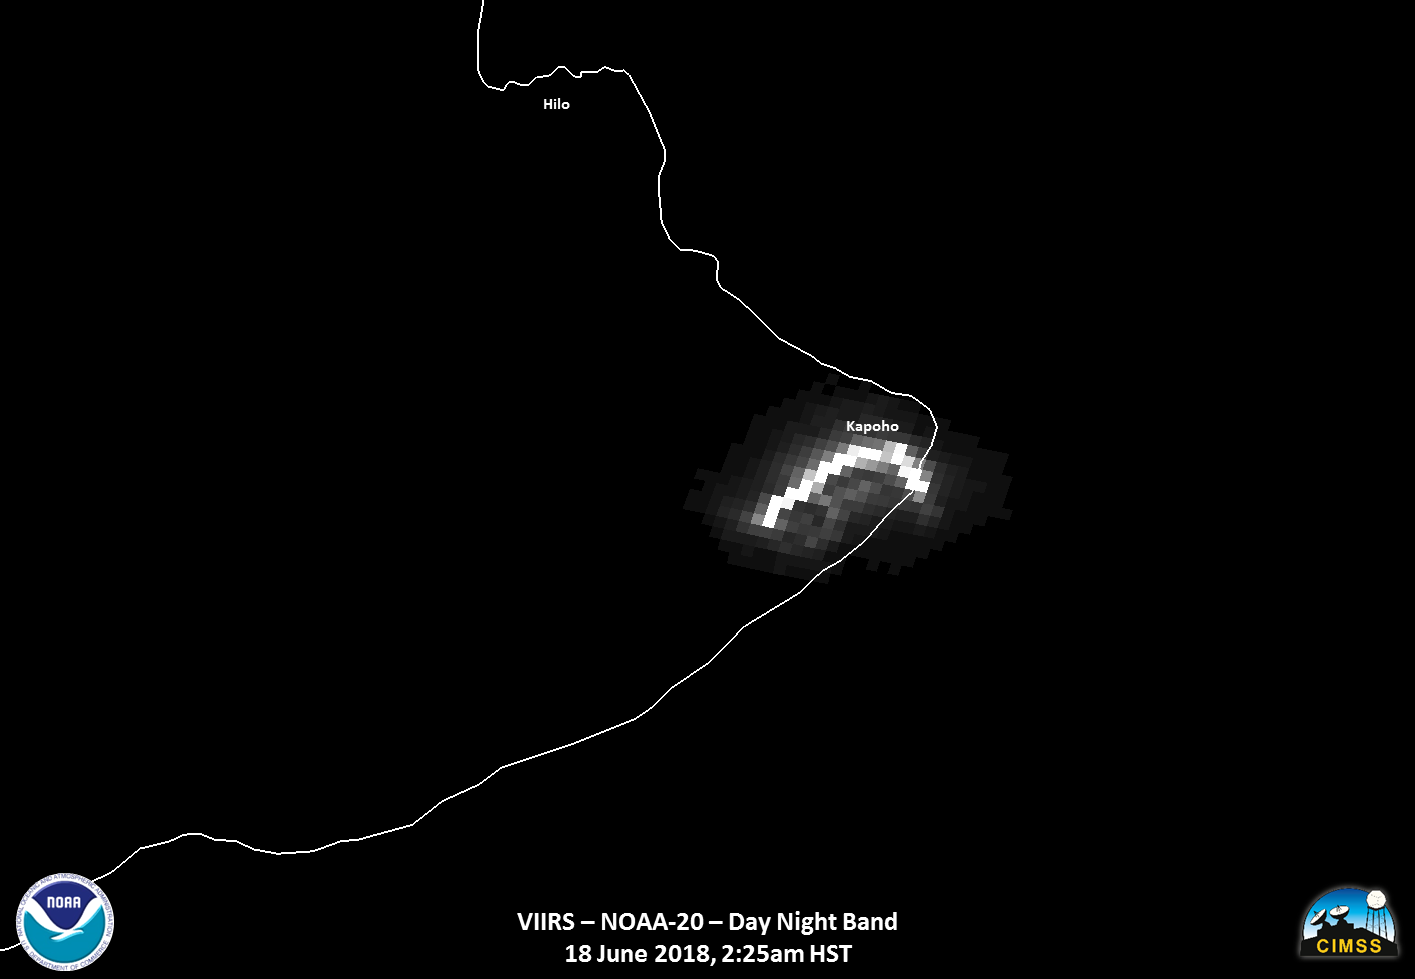
![NOAA-20 VIIRS Day/Night Band (0.7 µm), Shortwave Infrared I04 (3.75 µm), Shortwave Infrared M13 (4.05 µm) and Longwave Infrared (11.45 µm) images [click to enlarge]](https://cimss.ssec.wisc.edu/satellite-blog/wp-content/uploads/sites/5/2018/06/180618_1225utc_noaa20_DayNightBand_ShortwaveInfrared_LongwaveInfrared_Kilauea_HI_anim.gif)
![Webcam image from near Kapoho [click to enlarge]](https://cimss.ssec.wisc.edu/satellite-blog/wp-content/uploads/sites/5/2018/06/180618_1225utc_webcam_Kapoho.png)
