This website works best with a newer web browser such as Chrome, Firefox, Safari or Microsoft
Edge. Internet Explorer is not supported by this website.
A radiometrically retrieved Himawari-9 Ash Height product from the NOAA/CIMSS Volcanic Cloud Monitoring site (above) showed the volcanic cloud produced by the first recorded eruption of Krasheninnikov on the Kamchatka Peninsula of Russia, which began around 1650 UTC on 02 August 2025 (KVERT advisory). The Ash Height reached the 7-8 km range (darker shade... Read More
Himawari-9 Ash Height derived product [click to play MP4 animation]
A radiometrically retrieved Himawari-9 Ash Height product from the NOAA/CIMSS Volcanic Cloud Monitoring site (above) showed the volcanic cloud produced by the first recorded eruption of Krasheninnikov on the Kamchatka Peninsula of Russia, which began around 1650 UTC on 02 August 2025 (KVERT advisory). The Ash Height reached the 7-8 km range (darker shade of green) at times.
A Himawari-9 Ash Loading product (below) indicated that portions of the volcanic cloud occasionally contained fairly high levels of ash loading (shades of red).
Himawari-9 Ash Loading derived product [click to play MP4 animation]
Himawari-9 Ash RGB images produced using Geo2Grid(below) suggested that the volcanic cloud was composed of both primarily ash (shades of red/pink) and a mixture of ash and SO2 (shades of yellow).
Himawari-9 Ash RGB images [click to play animated GIF | MP4]
NEW: Incredible video of The FIRST HISTORICALLY RECORDED ERUPTION of Krasheninnikov Volcano in Kamchatka, Russia.
Scientists think it may have been triggered by the M8.8 earthquake that struck off the coast of Kamchatka, Russia on 30 July 2025, at 11:24:52 local time.… pic.twitter.com/1ZQcZxSs1G
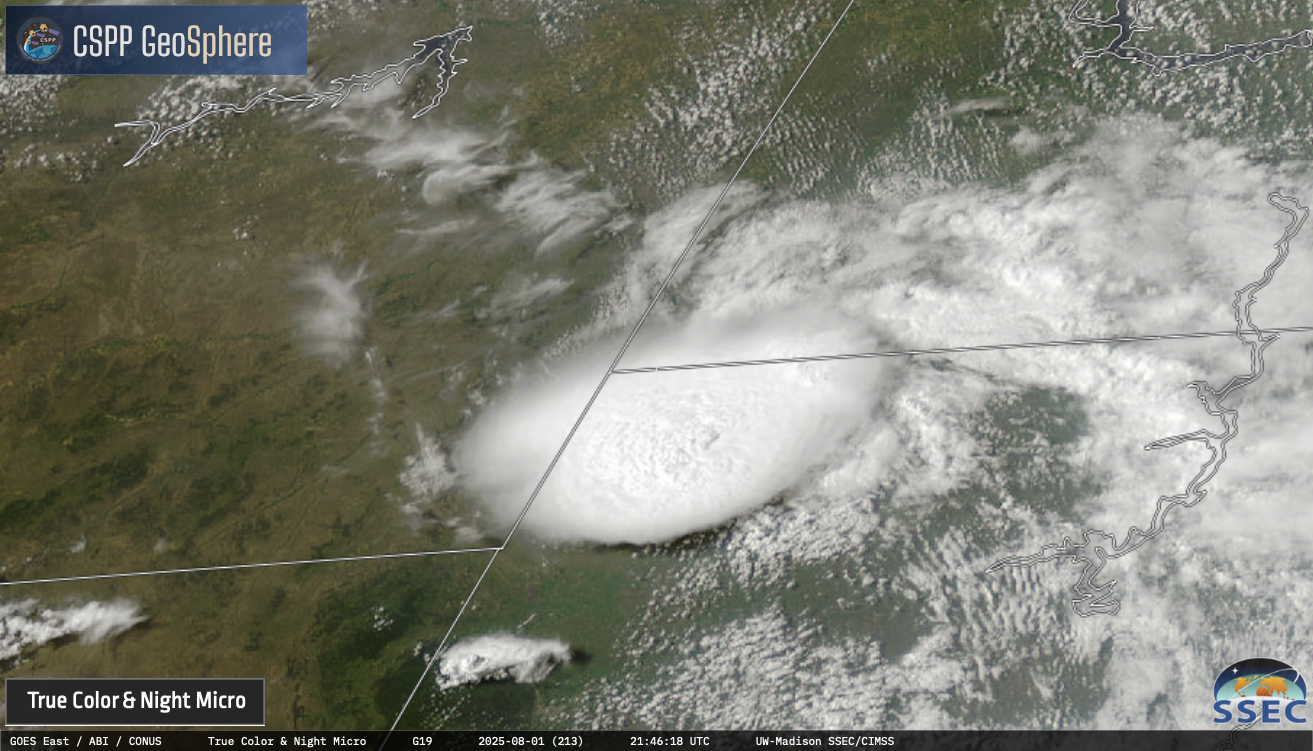
5-minute CONUS Sector GOES-19 (GOES-East) Nighttime Microphysics RGB + daytime True Color images from the CSPP GeoSphere site (above) showed a remnant Mesoscale Convective Vortex (MCV) that migrated eastward from southeastern Montana to northwestern South Dakota — where it helped to force the rapid development of a slow-moving Mesoscale Convective System (MCS) during the afternoon... Read More
5-minute GOES-19 Nighttime Microphysics RGB + daytime True Color RGB images, from 1201 UTC on 01 August to 0051 UTC on 02 August [click to play MP4 animation]
5-minute CONUS Sector GOES-19 (GOES-East)Nighttime Microphysics RGB + daytime True Color images from the CSPP GeoSphere site (above) showed a remnant Mesoscale Convective Vortex (MCV) that migrated eastward from southeastern Montana to northwestern South Dakota — where it helped to force the rapid development of a slow-moving Mesoscale Convective System (MCS) during the afternoon hours on 01 August 2025.
1-minute GOES-19 Red Visible (0.64 µm) images with time-matched (+/- 3 minutes) SPC Storm Reports plotted in red, from 2045 UTC on 01 August to 0127 UTC on 02 August [click to play animated GIF]
The MCS eventually began to produce periodic hail and damaging winds after 2100 UTC, as shown by 1-minute Mesoscale Domain Sector GOES-19 Visible images (above) and Infrared images (below) that included time-matched plots of SPC Storm Reports. The visible imagery revealed numerous pulses of overshooting tops, as well as intricate patterns of cloud-top gravity waves.
1-minute GOES-19 Clean Infrared Window (10.3 µm) images with time-matched (+/- 3 minutes) SPC Storm Reports plotted in blue, from 2045 UTC on 01 August to 0127 UTC on 02 August [click to play animated GIF]
Significant convection across the northern continental United States has had some notable impacts on the aviation network over the past few weeks. On Wednesday, 30 July, Delta Flight 56 was en route from Salt Lake City, UT, with an intended destination of Amsterdam. Shortly after takeoff at 4:30 PM local... Read More
Significant convection across the northern continental United States has had some notable impacts on the aviation network over the past few weeks. On Wednesday, 30 July, Delta Flight 56 was en route from Salt Lake City, UT, with an intended destination of Amsterdam. Shortly after takeoff at 4:30 PM local time (22:30 UTC), this Airbus 330-900neo encountered a thick band of vigorous convection over Wyoming. The GOES-18 Band 13 (10 micron infrared window) imagery for this period shows just how intense the convection was, with numerous cells featuring overshooting tops and enhanced v signatures.
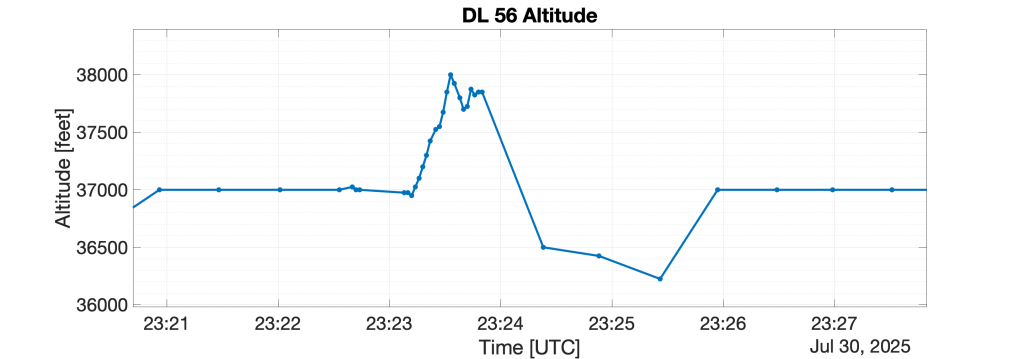
While the plane attempted to avoid the worst of the convection by skirting to the south of the main area of severe thunderstorms, rapidly infilling developed made it very challenging to avoid the turbulence. The loop above covers the period from 2200 UTC (30 minutes before takeoff) to 2350 UTC (about 20 minutes after the severe turbulence was reported). ADS-B data courtesy of Flight Aware shows just how sudden the altitude changes were: over the course of just three minutes, the plane pitched upward approximately 1000 feet (300 m), them dropped sharply 1700 feet (510 m) before returning to its planned altitude of 37000 feet (11.3 km).
____________________
Sequence of GOES-19 Visible (0.64 µm), Infrared (10.3 µm) and Water Vapor (6.2 µm) images at 2316 UTC, 2321 UTC and 2326 UTC on 30 July, centered over southern Wyoming; VOR site names are plotted in orange-red (courtesy Scott Bachmeier, CIMSS) [click to play animated GIF]
A sequence of 5-minute CONUS Sector GOES-19 (GOES-East) Visible, Infrared and Water Vapor images (above) displayed the rapid development of a distinct cluster of thunderstorm overshooting tops about 20 miles NNW of the Cherokee, Wyoming VOR site (identifier CKW) — which became apparent near the location of the Extreme Turbulence encounter (which was 10 miles NNW of CKW, according to the Pilot Report):
RWL UUA /OV CKW340010/TM 2342/FL370/TP A339/TB EXTREME TURB FL370/RM COULD NOT HOLD ALTITUDE +/- 900FT ZDVWC-34
Note that there was a time lag between the turbulence event (2323-2325 UTC) and the time that the Pilot Report was transmitted (2342 UTC), as the pilots regained control of the aircraft and assessed the extent of any damage and injuries to passengers and crew.
1-minute GOES-19 True Color RGB images with time-matched plots of the DL56 aircraft location (green), from 2320-2326 UTC on 30 July (courtesy Jay Hoffman, CIMSS) [click to play animated GIF]
1-minute Mesoscale Domain Sector GOES-19 True Color RGB images (above), which included time-matched plots of the DL56 aircraft location, provided a better view of the rapid development of thunderstorm overshooting tops.
A closer view using 1-minute GOES-19 Visible and Infrared images (below) included cyan * symbols that represented the surface-based location of DL56 at the time of each image — while the yellow + symbols represented the “parallax-corrected” location of DL56 over the cloud features at that time (using the 37000-ft nominal cruising altitude to calculate the parallax adjustment). Judging from the parallax-corrected points, it appears that the aircraft flew directly over (or very near to) the cluster of rapidly-developing convective overshooting tops. (Rapid convective development has been the cause of other severe turbulence events: for example, here, here and here.)
1-minute GOES-19 Visible (0.64 µm, left) and Infrared (10.3 µm, right) images from 2320-2326 UTC on 30 July — with cyan * symbols and yellow + symbols representing the ground-based locations and the parallax-corrected cloud-top locations of the DL56 aircraft, respectively (courtesy Scott Bachmeier, CIMSS) [click to play animated GIF | MP4]
GOES-19 Infrared (10.3 µm) image at 2326 UTC on 30 July, with a cursor sample of the coldest thunderstorm overshooting top; KRIW in yellow denotes the Riverton RAOB site (courtesy Scott Bachmeier, CIMSS) [click to enlarge]
An AWIPS cursor sample of the GOES-19 Infrared image at 2326 UTC (above) showed that the coldest thunderstorm overshooting top (near the extreme turbulence encounter) exhibited an infrared brightness temperature of about -63ºC. According to a plot of rawinsonde data from Riverton, Wyoming (below), that infrared brightness temperature represented a ~1 km overshoot of the Most Unstable (MU) air parcel’s Equilibrium Level (EL) — reaching an altitude around 11.5 km or 37730 ft (above the 37000 ft cruising altitude of DL56).
Plot of rawinsonde data from Riverton, Wyoming at 0000 UTC on 31 July (courtesy Scott Bachmeier, CIMSS) [click to enlarge]
____________________
The CIMSS Turbulence product is a machine learning product that analyzes geostationary satellite imagery to identify areas where turbulence is likely. The contours on the animation below show the probability of moderate or greater turbulence at least once during a ten minute period as determined by this tool. The state of Wyoming (along with most of the Rockies) was clearly an environment in which turbulence could be expected.
A closer view of the MOG turbulence probability product, centered over southern Wyoming, is shown below (courtesy Sarah Griffin, CIMSS). A moving trace of the DL56 flight path is also plotted on the imagery — note the northward jog at the point of the Extreme Turbulence encounter (that red PIREP location is plotted on the last 2 images of the animation). As the areal extent of thunderstorm activity increased during that 4-hour period, so did the coverage of higher MOG turbulence probability.
Unfortunately, numerous injuries occurred during this flight. The plane made an emergency diversion to Minneapolis, and 25 passengers and/or crew were taken to local hospitals.
This was not the only high profile turbulence event in the last week of July 2025. On Sunday 27 July, the Boston Red Sox started their first leg of a road trip by boarding a plane bound for Minneapolis so they could take on the Minnesota Twins. The flight initially diverted to Detroit to allow time for conditions to settle, but then it pushed onward into Minnesota where convection was severe. The plane finally landed around midnight local time (0500 UTC). Once again, the GOES ABI Band 13 is an excellent took for diagnosing vigorous convective storms, with overshooting tops and wave patterns easily discernable.
Numerous players reported experiencing nausea and other impacts from the heavy turbulence, with one player being unable to play the next day due to lasting effects. Sox pitcher Lucas Giolito said, as quoted by MassLive, “It was the worst sustained turbulence I’ve ever experienced. Forty-five minutes straight of left, right, dropping down. At least on a roller coaster, you know when the drop is coming, or you know when you’re rolling right or you’re rolling left. You can see it. But sitting on a plane, it was like, oh boy. At one point, I kind of flew up out of my seat.” Shortstop Trevor Story echoed those comments, saying to MLB “It was awful. It was one of the worst, probably the worst flight I’ve been on turbulence-wise.” With 9 seasons and 10 years respectively in the major leagues for Giolito and Story, these players speak from significant experience with airplane flights.
However, the ordeal has inspired the Red Sox and they have embraced the adversity. Witness their turbulence-inspired celebration, seen here by Ceddanne Rafaela after he hit a triple. While the Sox lost their first post-turbulence game, they won the next two to take the series from the Twins.
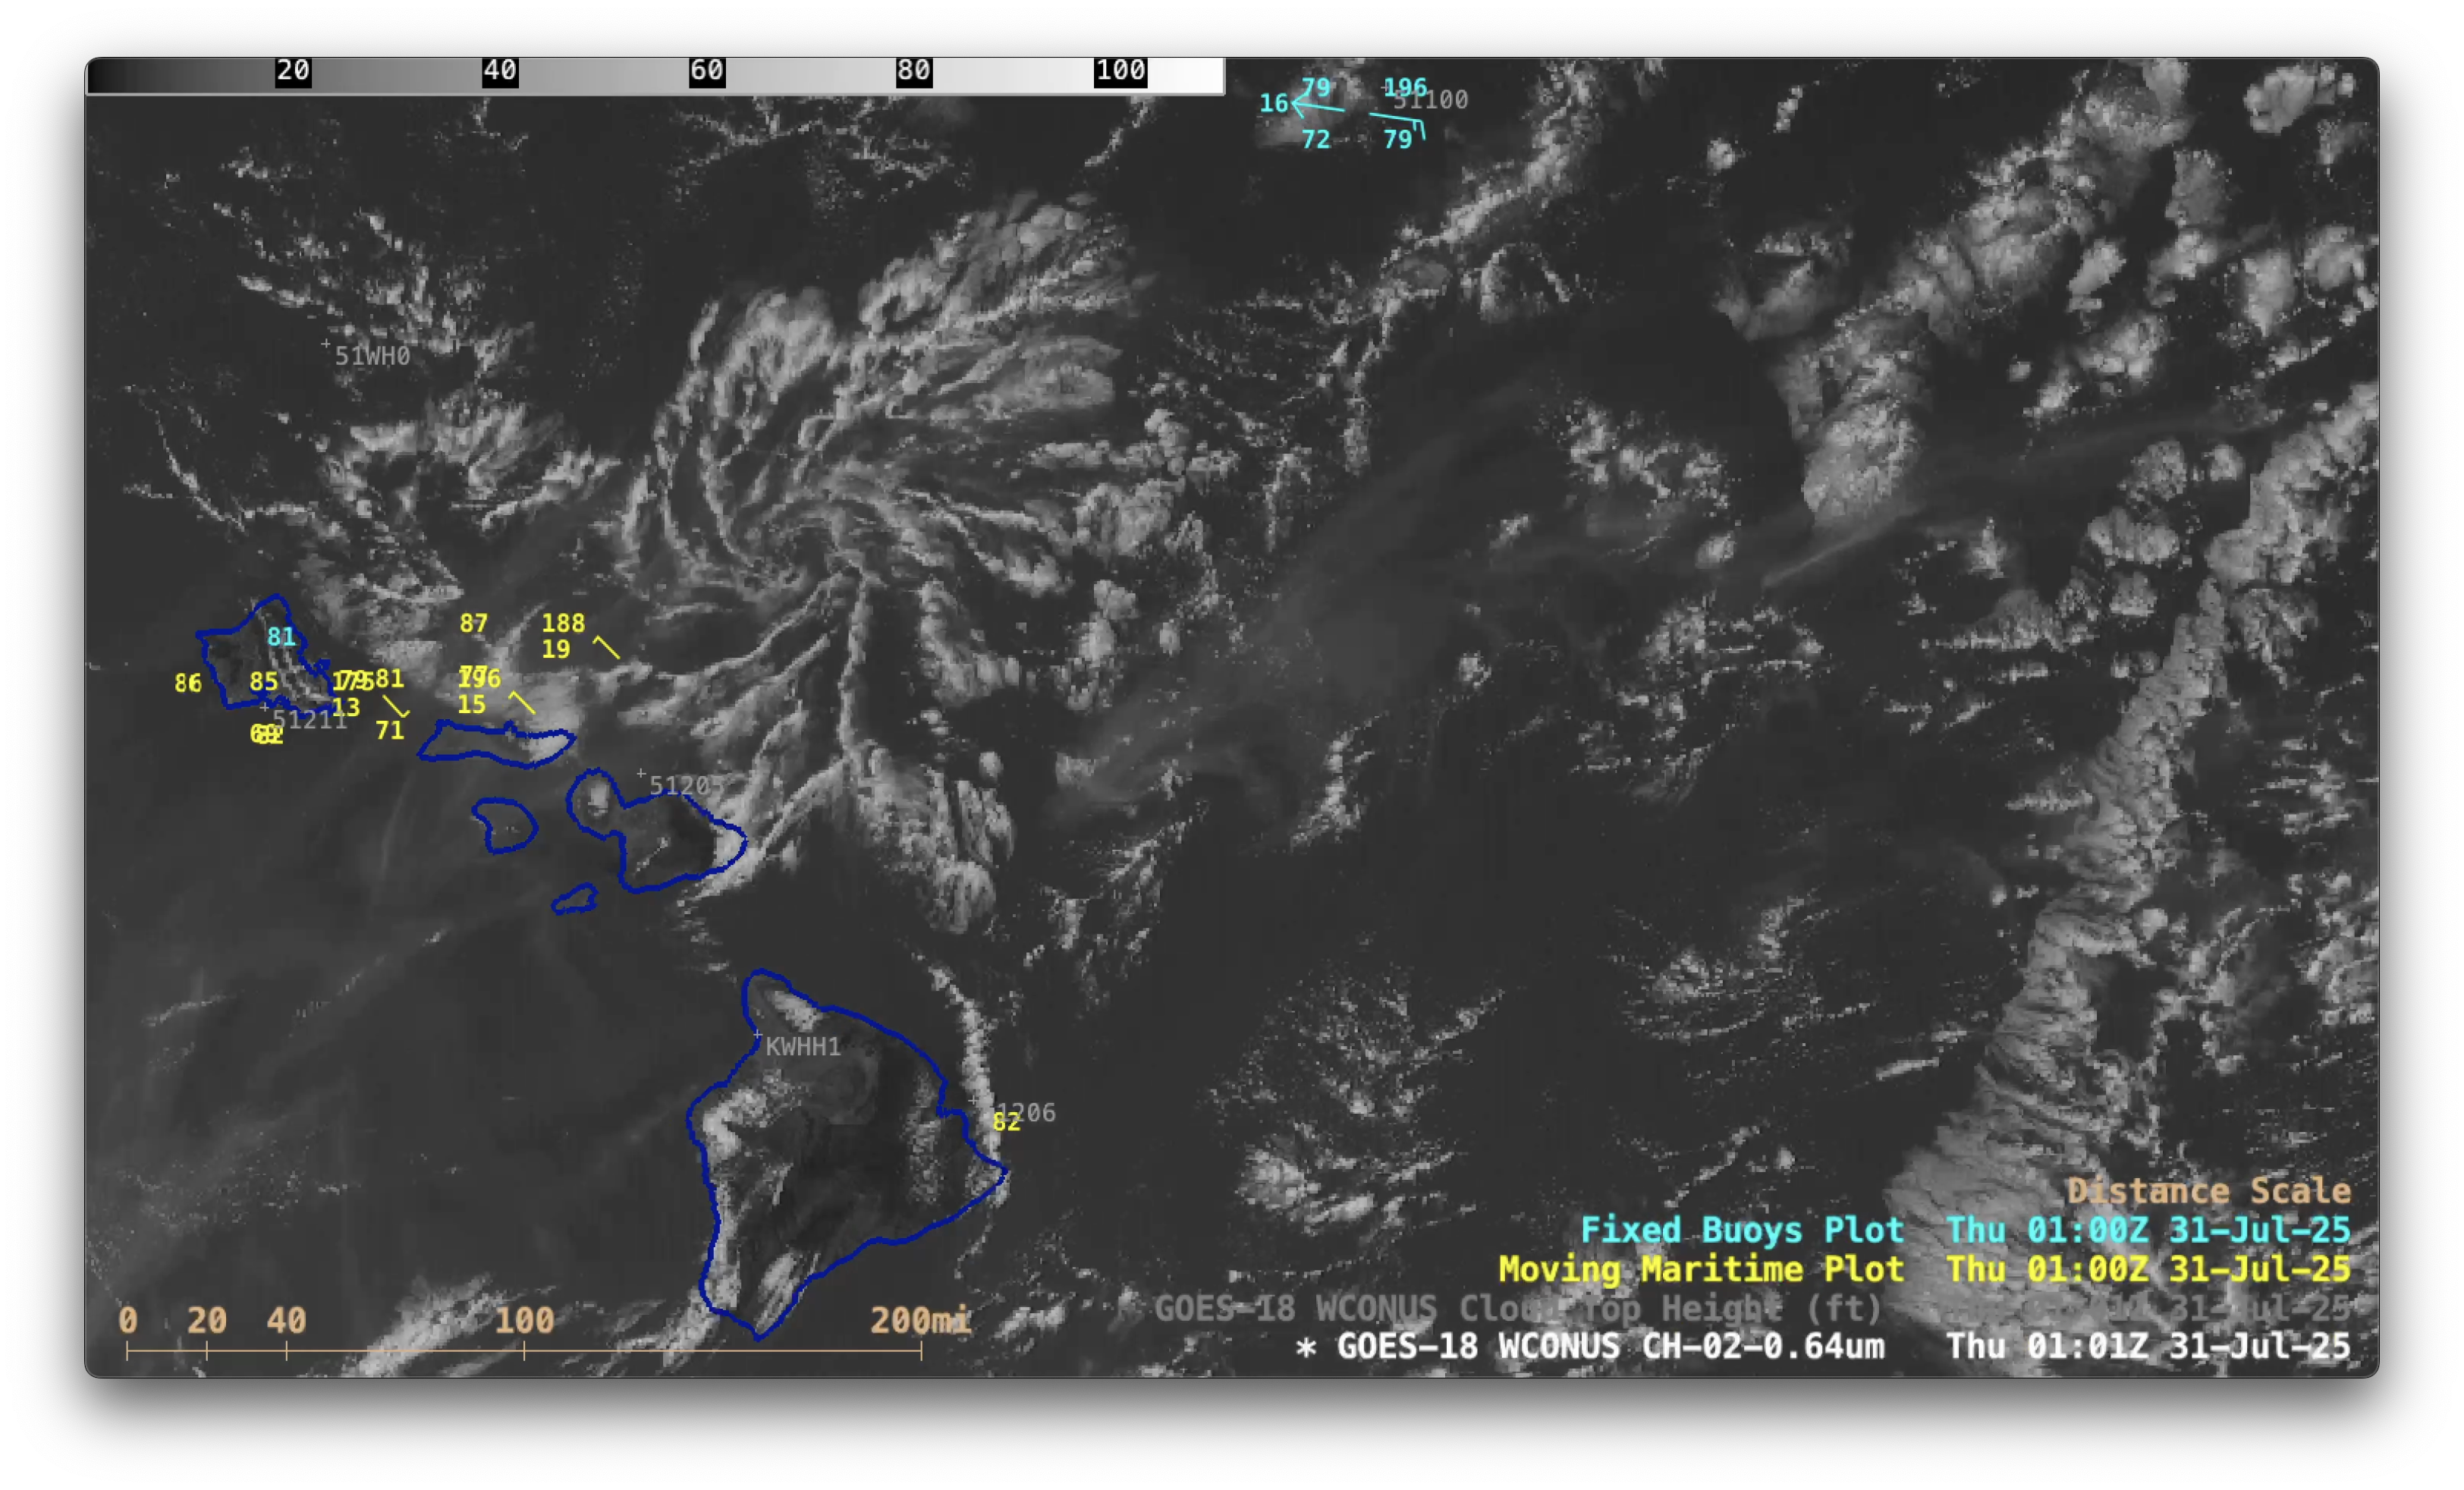
5-minute PACUS Sector GOES-18 (GOES-West) Nighttime Microphysics RGB and daytime True Color RGB images (above) revealed the cyclonic circulation of an actinoform cloud feature as it passed just north of the Hawaiian Islands on 30 July 2025.GOES-18 Visible images (below) included plots of Ship and Fixed Buoy reports — unfortunately,... Read More
GOES-18 Nighttime Microphysics RGB + daytime True Color RGB images, from 1401 UTC on 30 July to 0221 UTC on 31 July [click to play MP4 animation]
5-minute PACUS Sector GOES-18 (GOES-West) Nighttime Microphysics RGB and daytime True Color RGB images (above) revealed the cyclonic circulation of an actinoform cloud feature as it passed just north of the Hawaiian Islands on 30 July 2025.
GOES-18 Visible images (below) included plots of Ship and Fixed Buoy reports — unfortunately, the actinoform cloud feature avoided all of those reports, so any effects on sensible weather could not be ascertained (another case near Hawai`i provided evidence of rain showers associated with an actinoform feature).
GOES-18 Visible images, from 1601 UTC on 30 July to 0201 UTC on 31 July [click to play MP4 animation]


