Ice motion and growth in southern Lake Michigan

GOES-19 (Preliminary/Non-operational) True Color RGB images, from 1511-2156 UTC on 14 January [click to play MP4 animation]
GOES-16 (GOES-East) Visible images (below) included plots of surface and buoy reports — which showed wind gusts in the 25-30 knot range at several sites near the Lake Michigan coast.
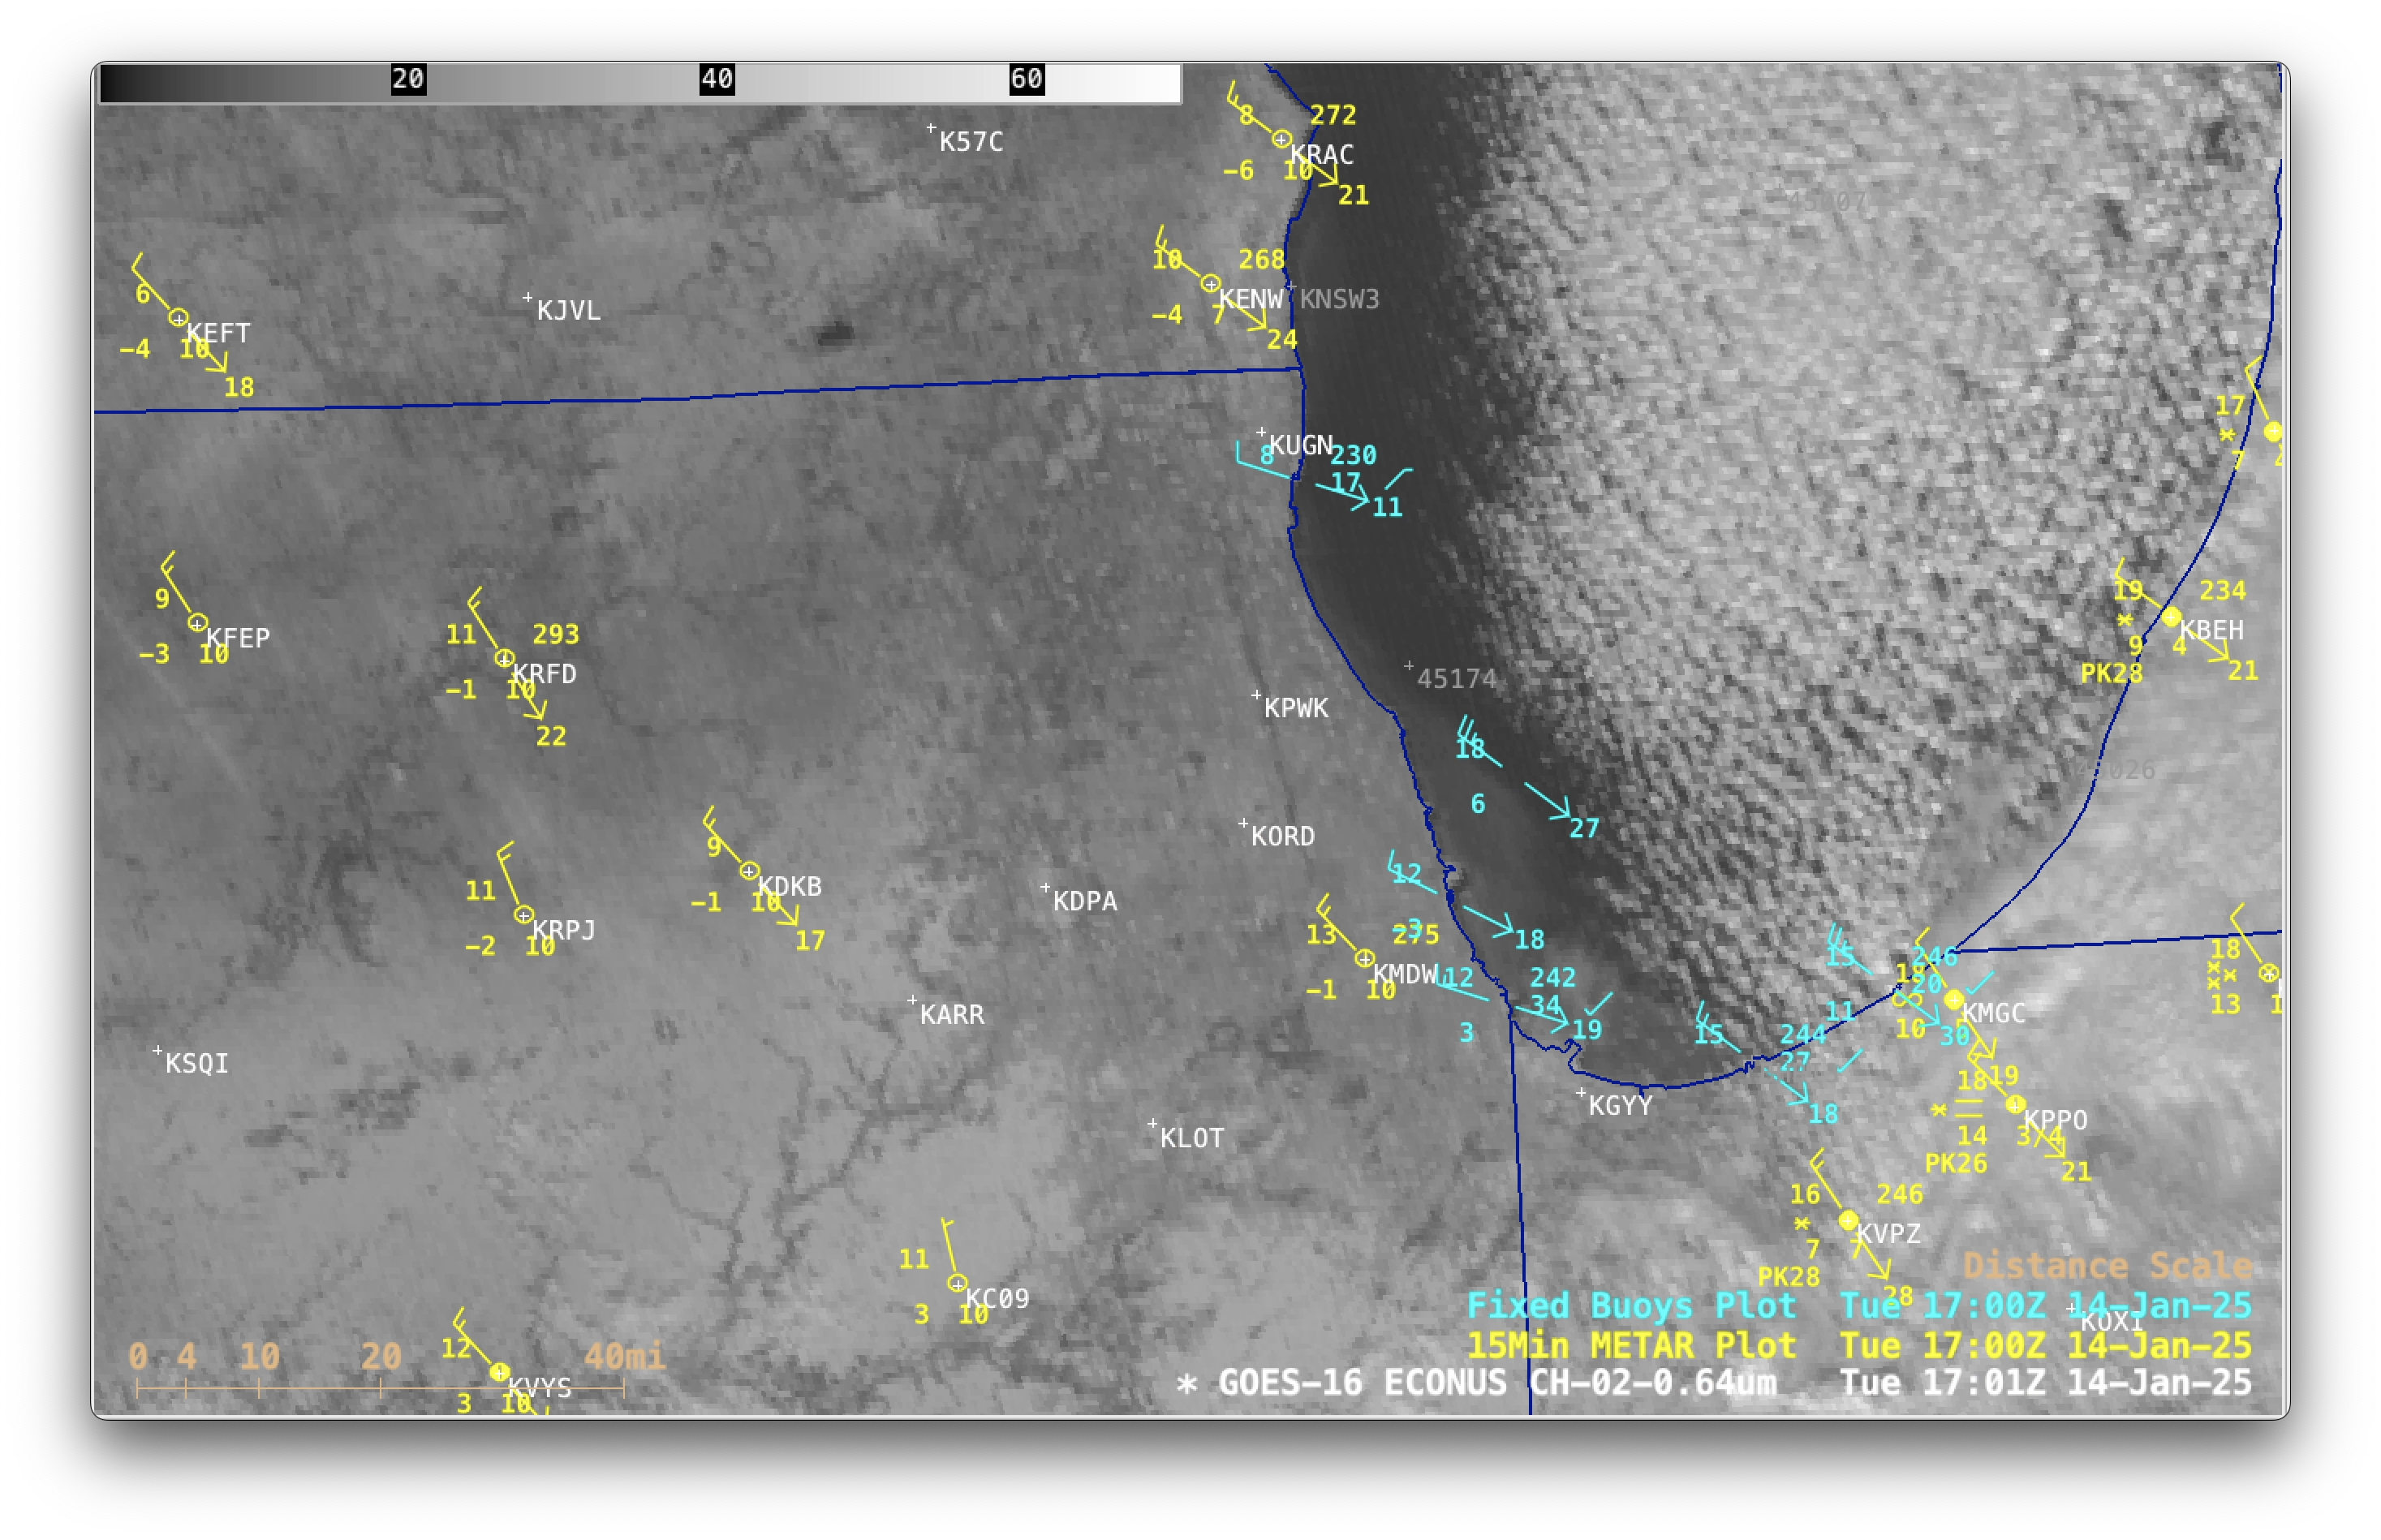
GOES-16 Visible images with plots of 15-minute METAR surface reports (yellow) and hourly Buoy reports (cyan) [click to play MP4 animation]
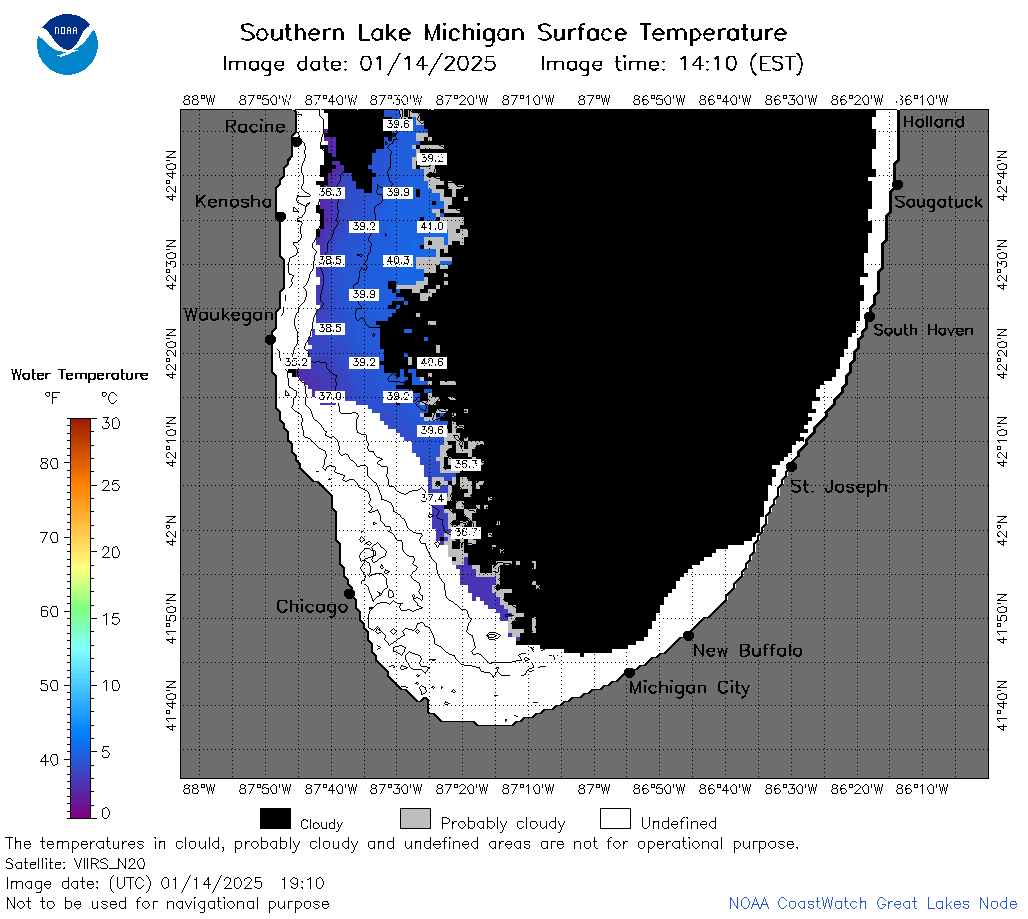
Analysis of Southern Lake Michigan water temperature (derived from NOAA-20 VIIRS data) at 1810 UTC on 14th January; lake ice appears white [click to enlarge]
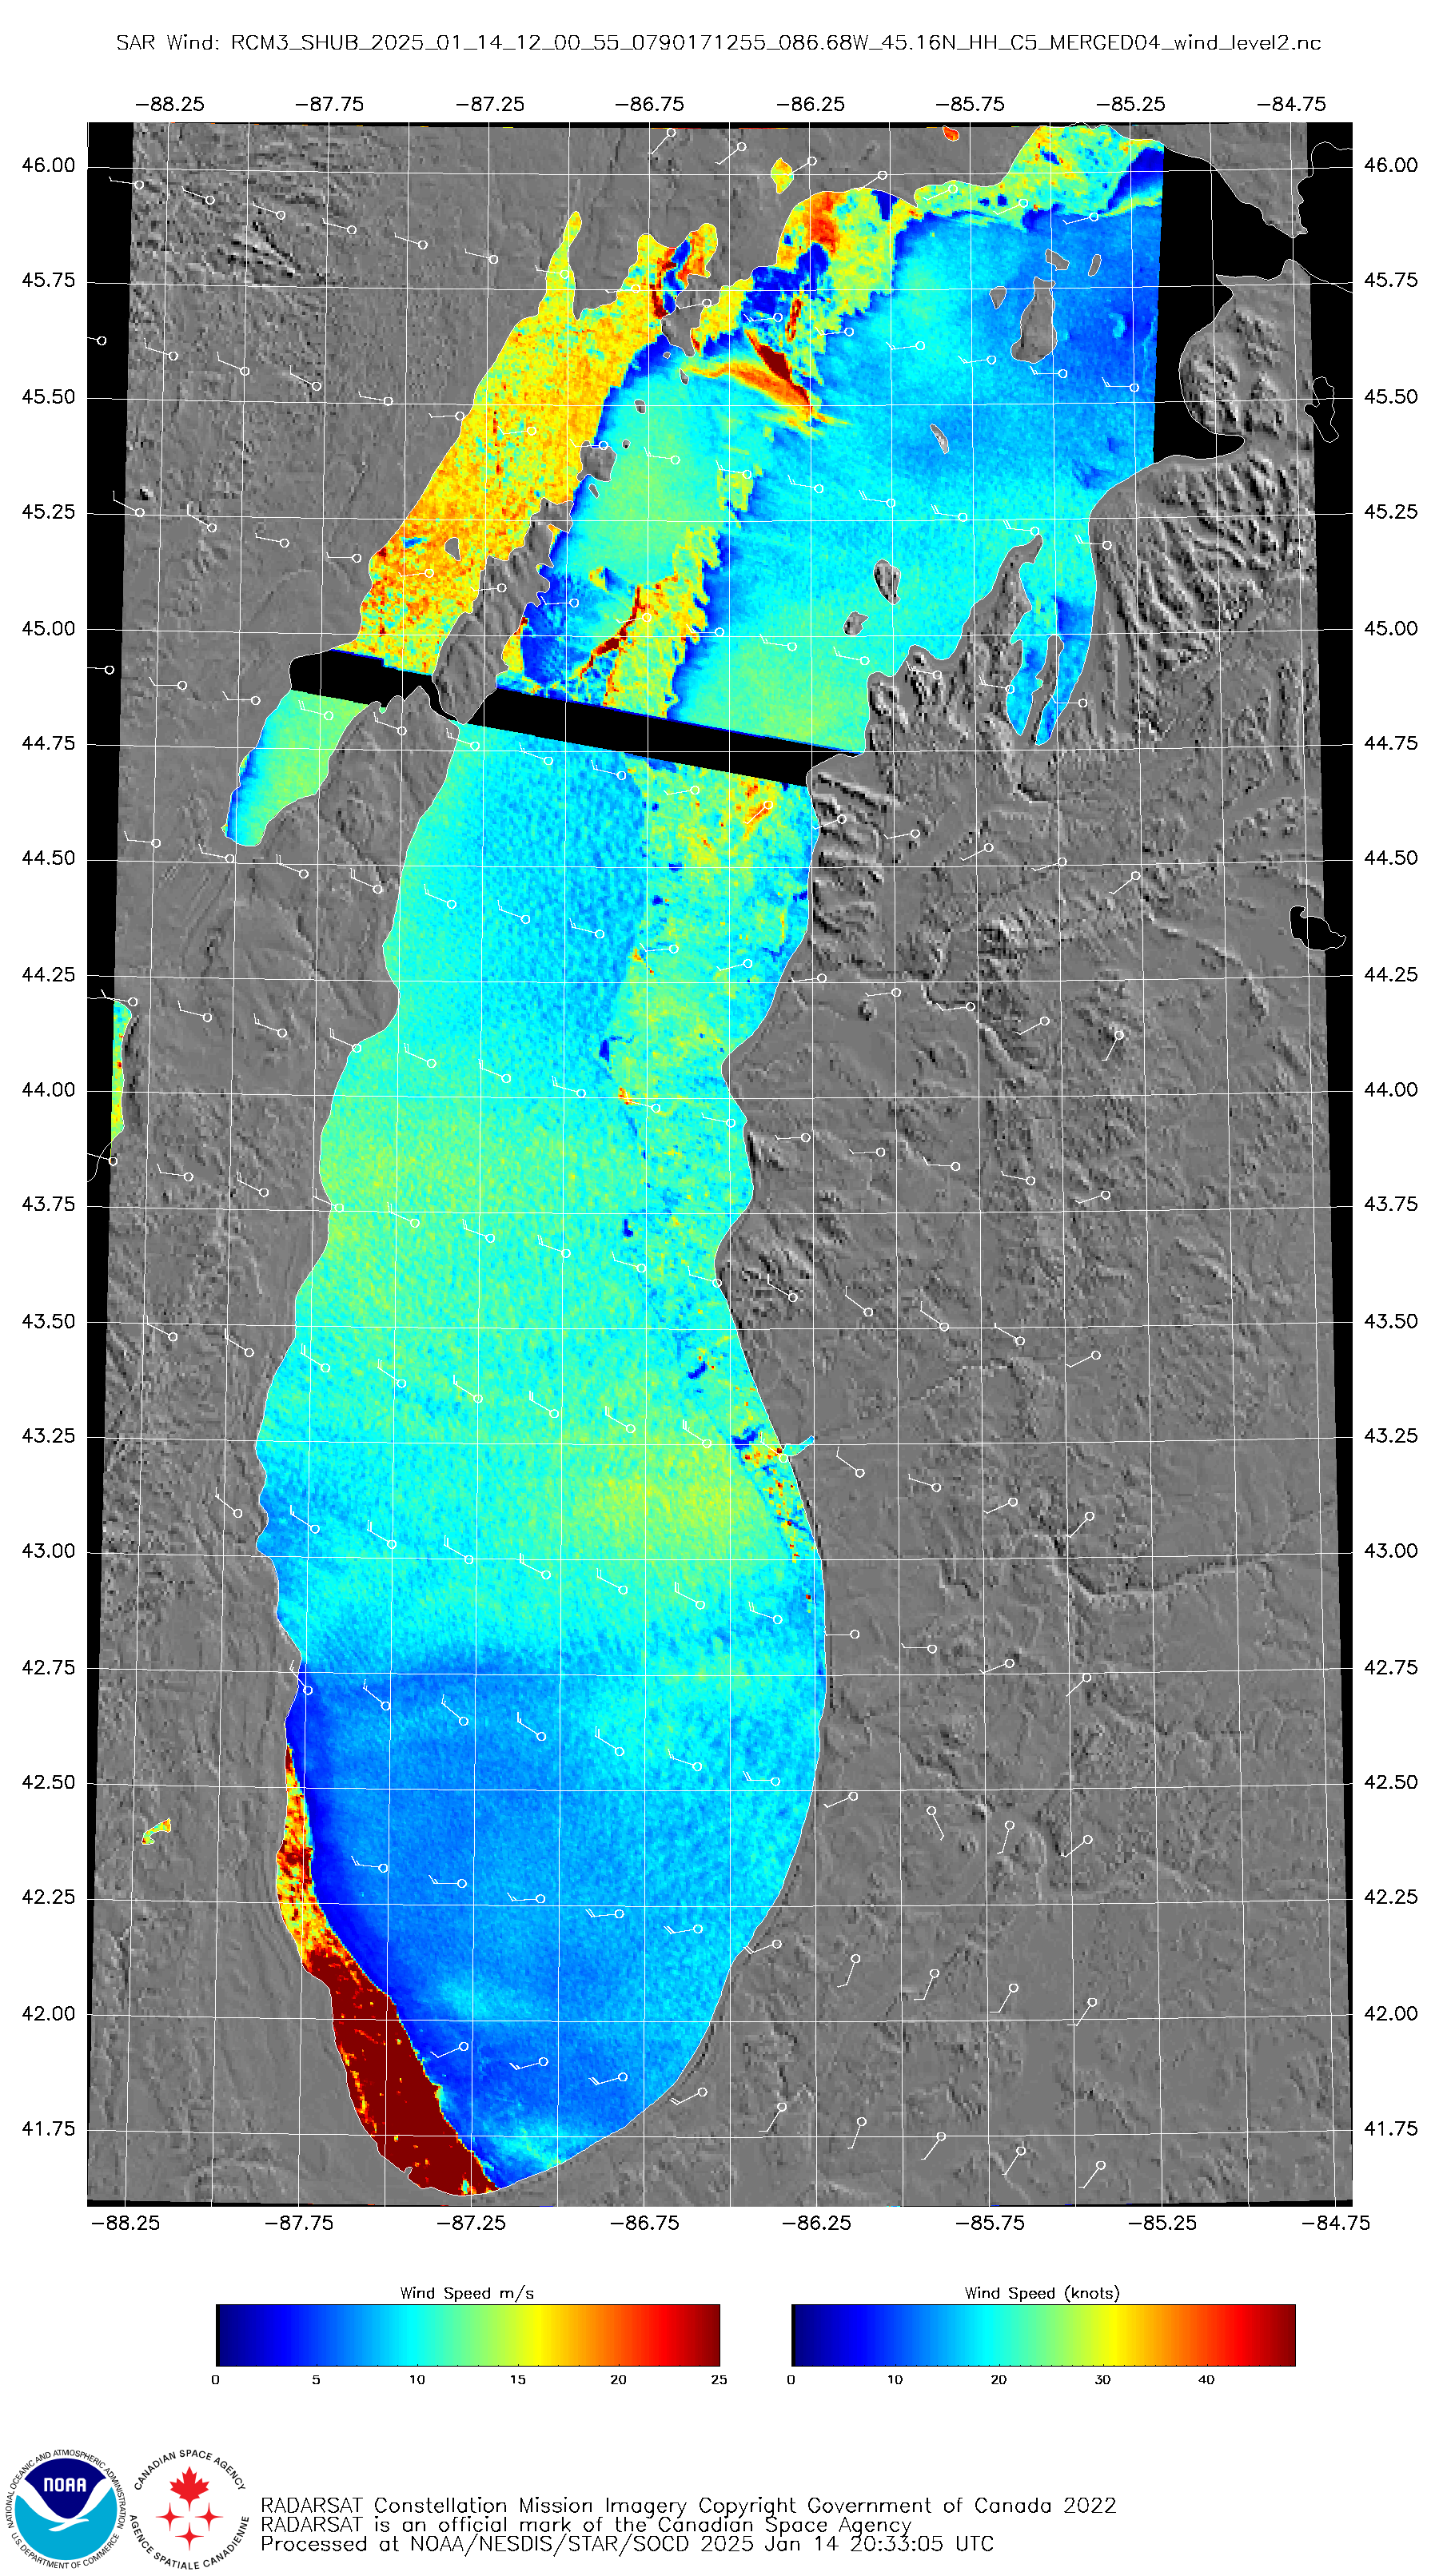
RCM-3 Synthetic Aperture Radar image at 1200 UTC on 14th January [click to enlarge]

GOES-19 (Preliminary/Non-operational) True Color RGB images during the daytime hours on 13/14/15 January [click to play MP4 animation]

Landsat-9 Natural Color RGB image at 1635 UTC on 16th January [click to enlarge]