
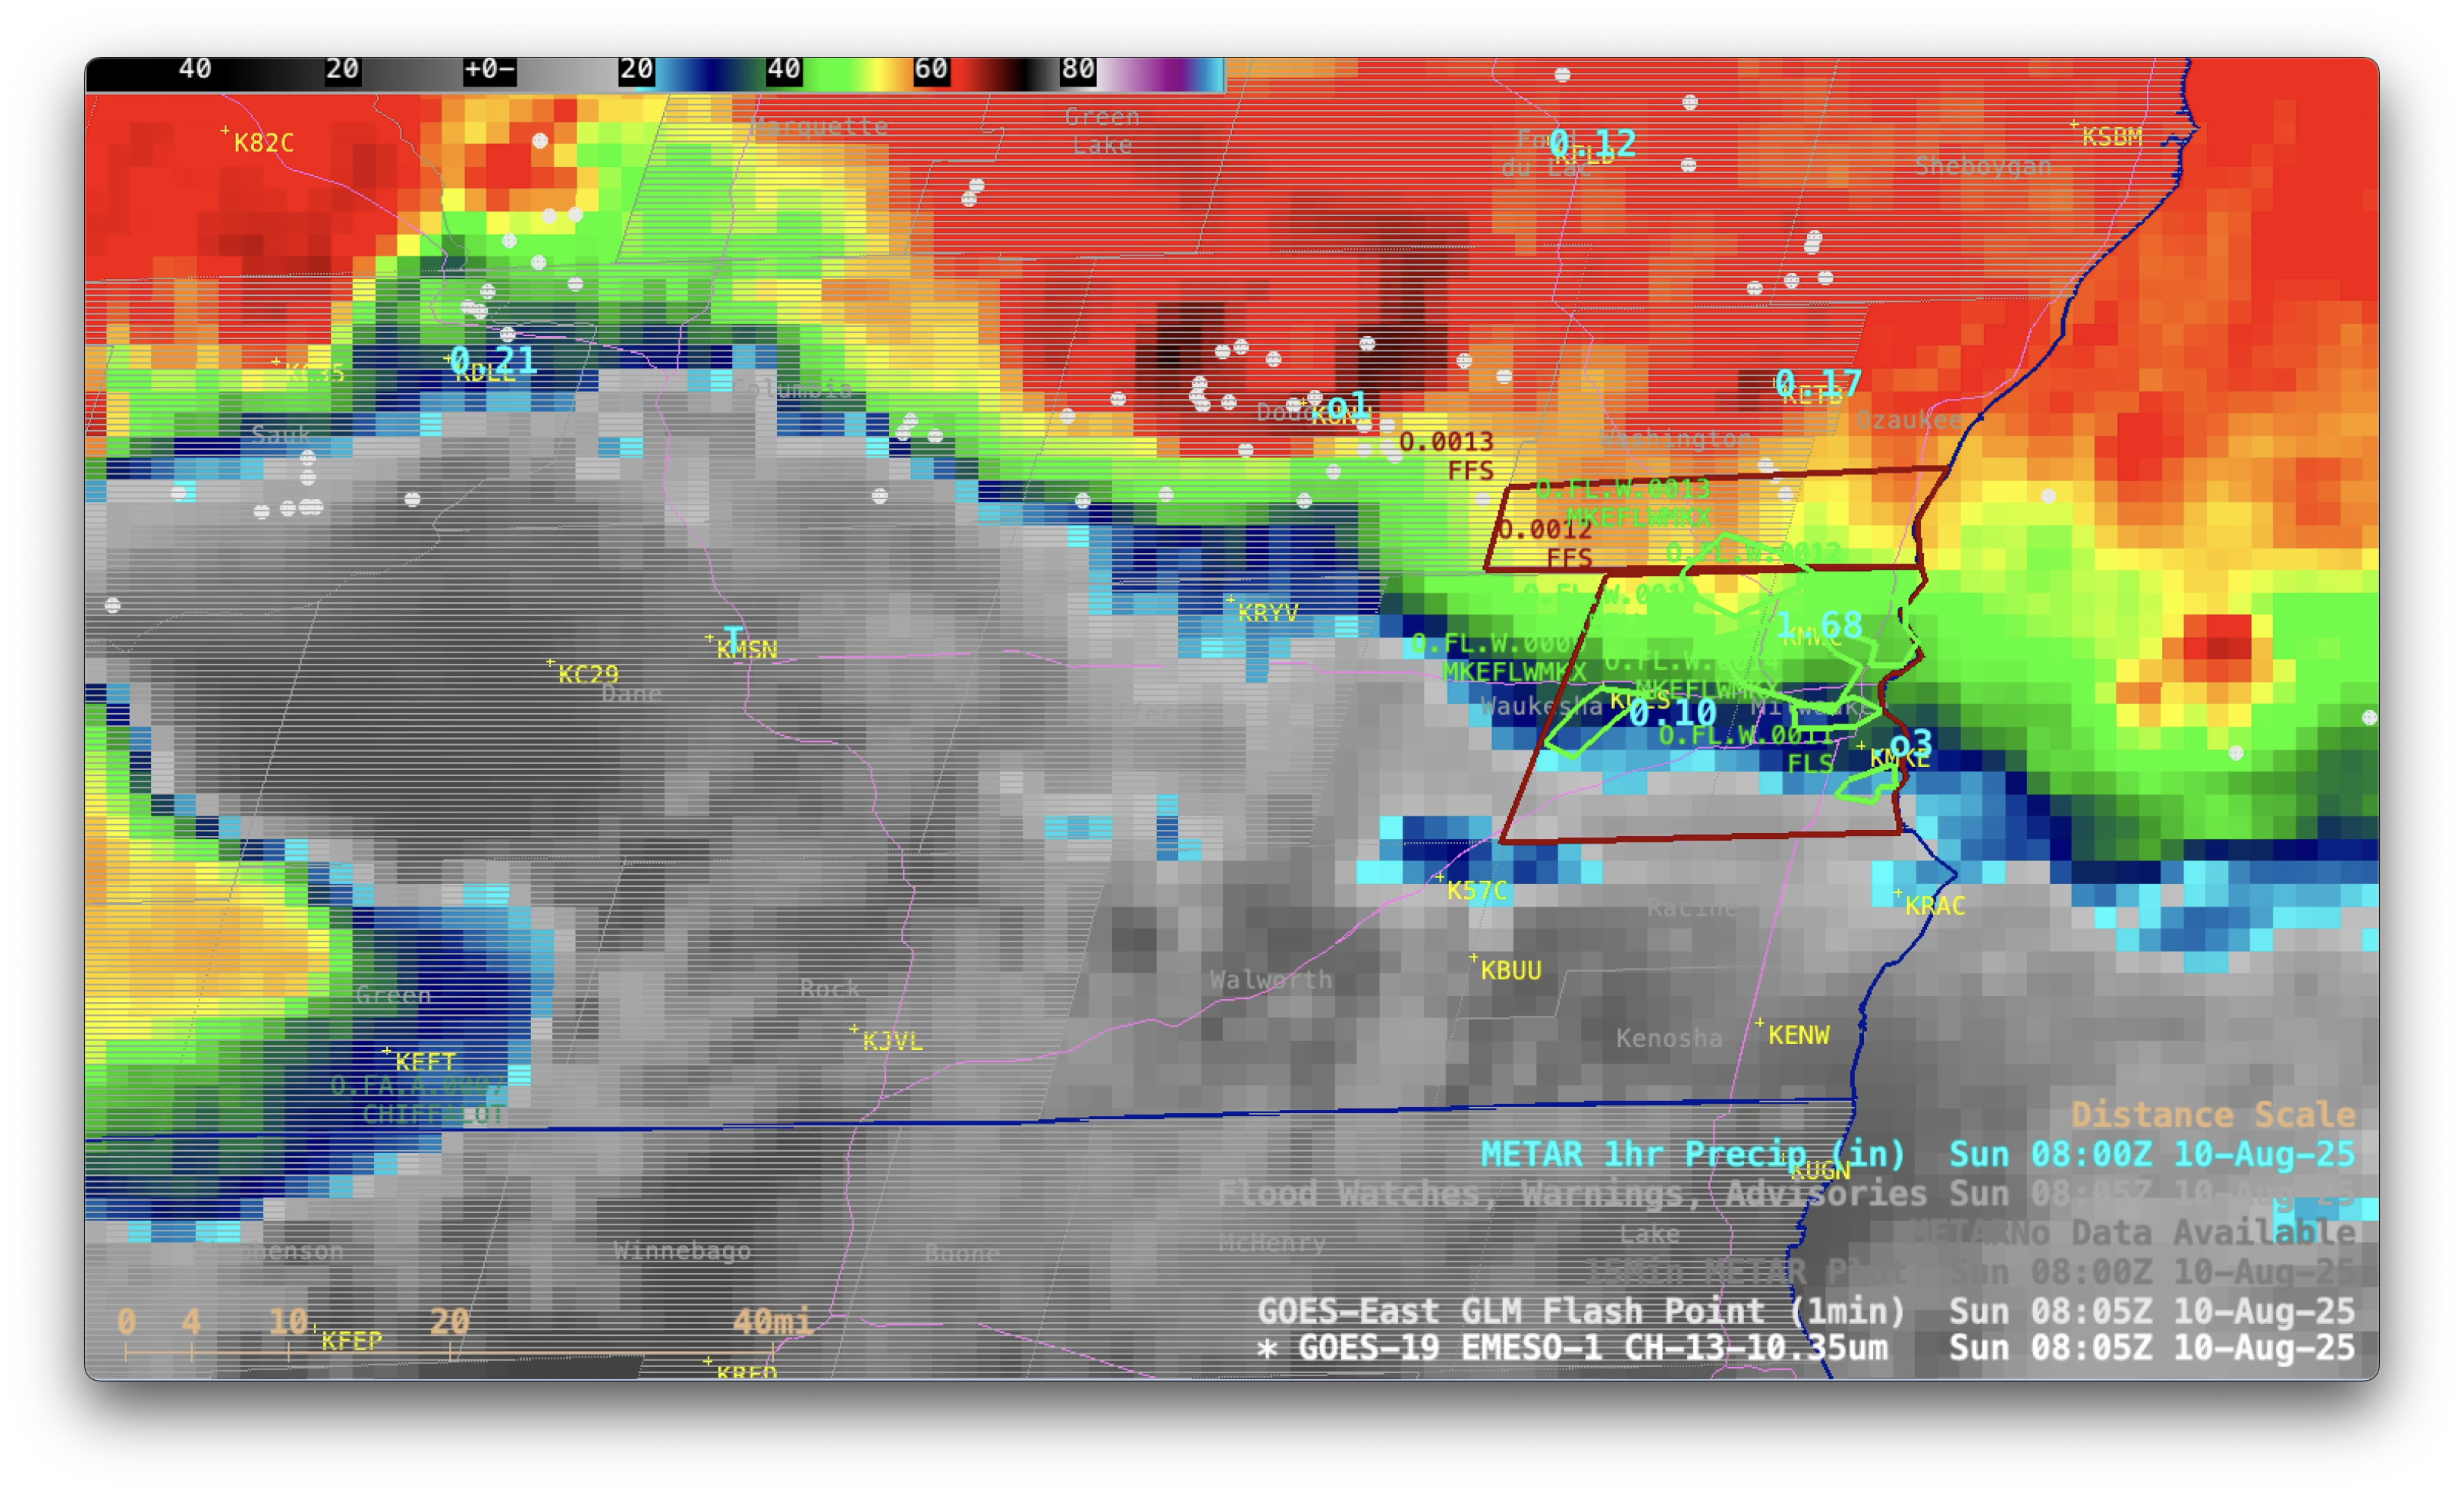
1-minute GOES-19 Infrared images with plots of GLM Flash Points (white), Flood Watches (gray hatched area) / Flash Flood Warnings (red polygons) / Flood Statements (dark green polygons) / Flood Warnings (light green polygons) and 1-hour Precipitation amounts (cyan), from 0000-1300 UTC on 10 August. Interstate highways are plotted in violet. [click to play MP4 animation]
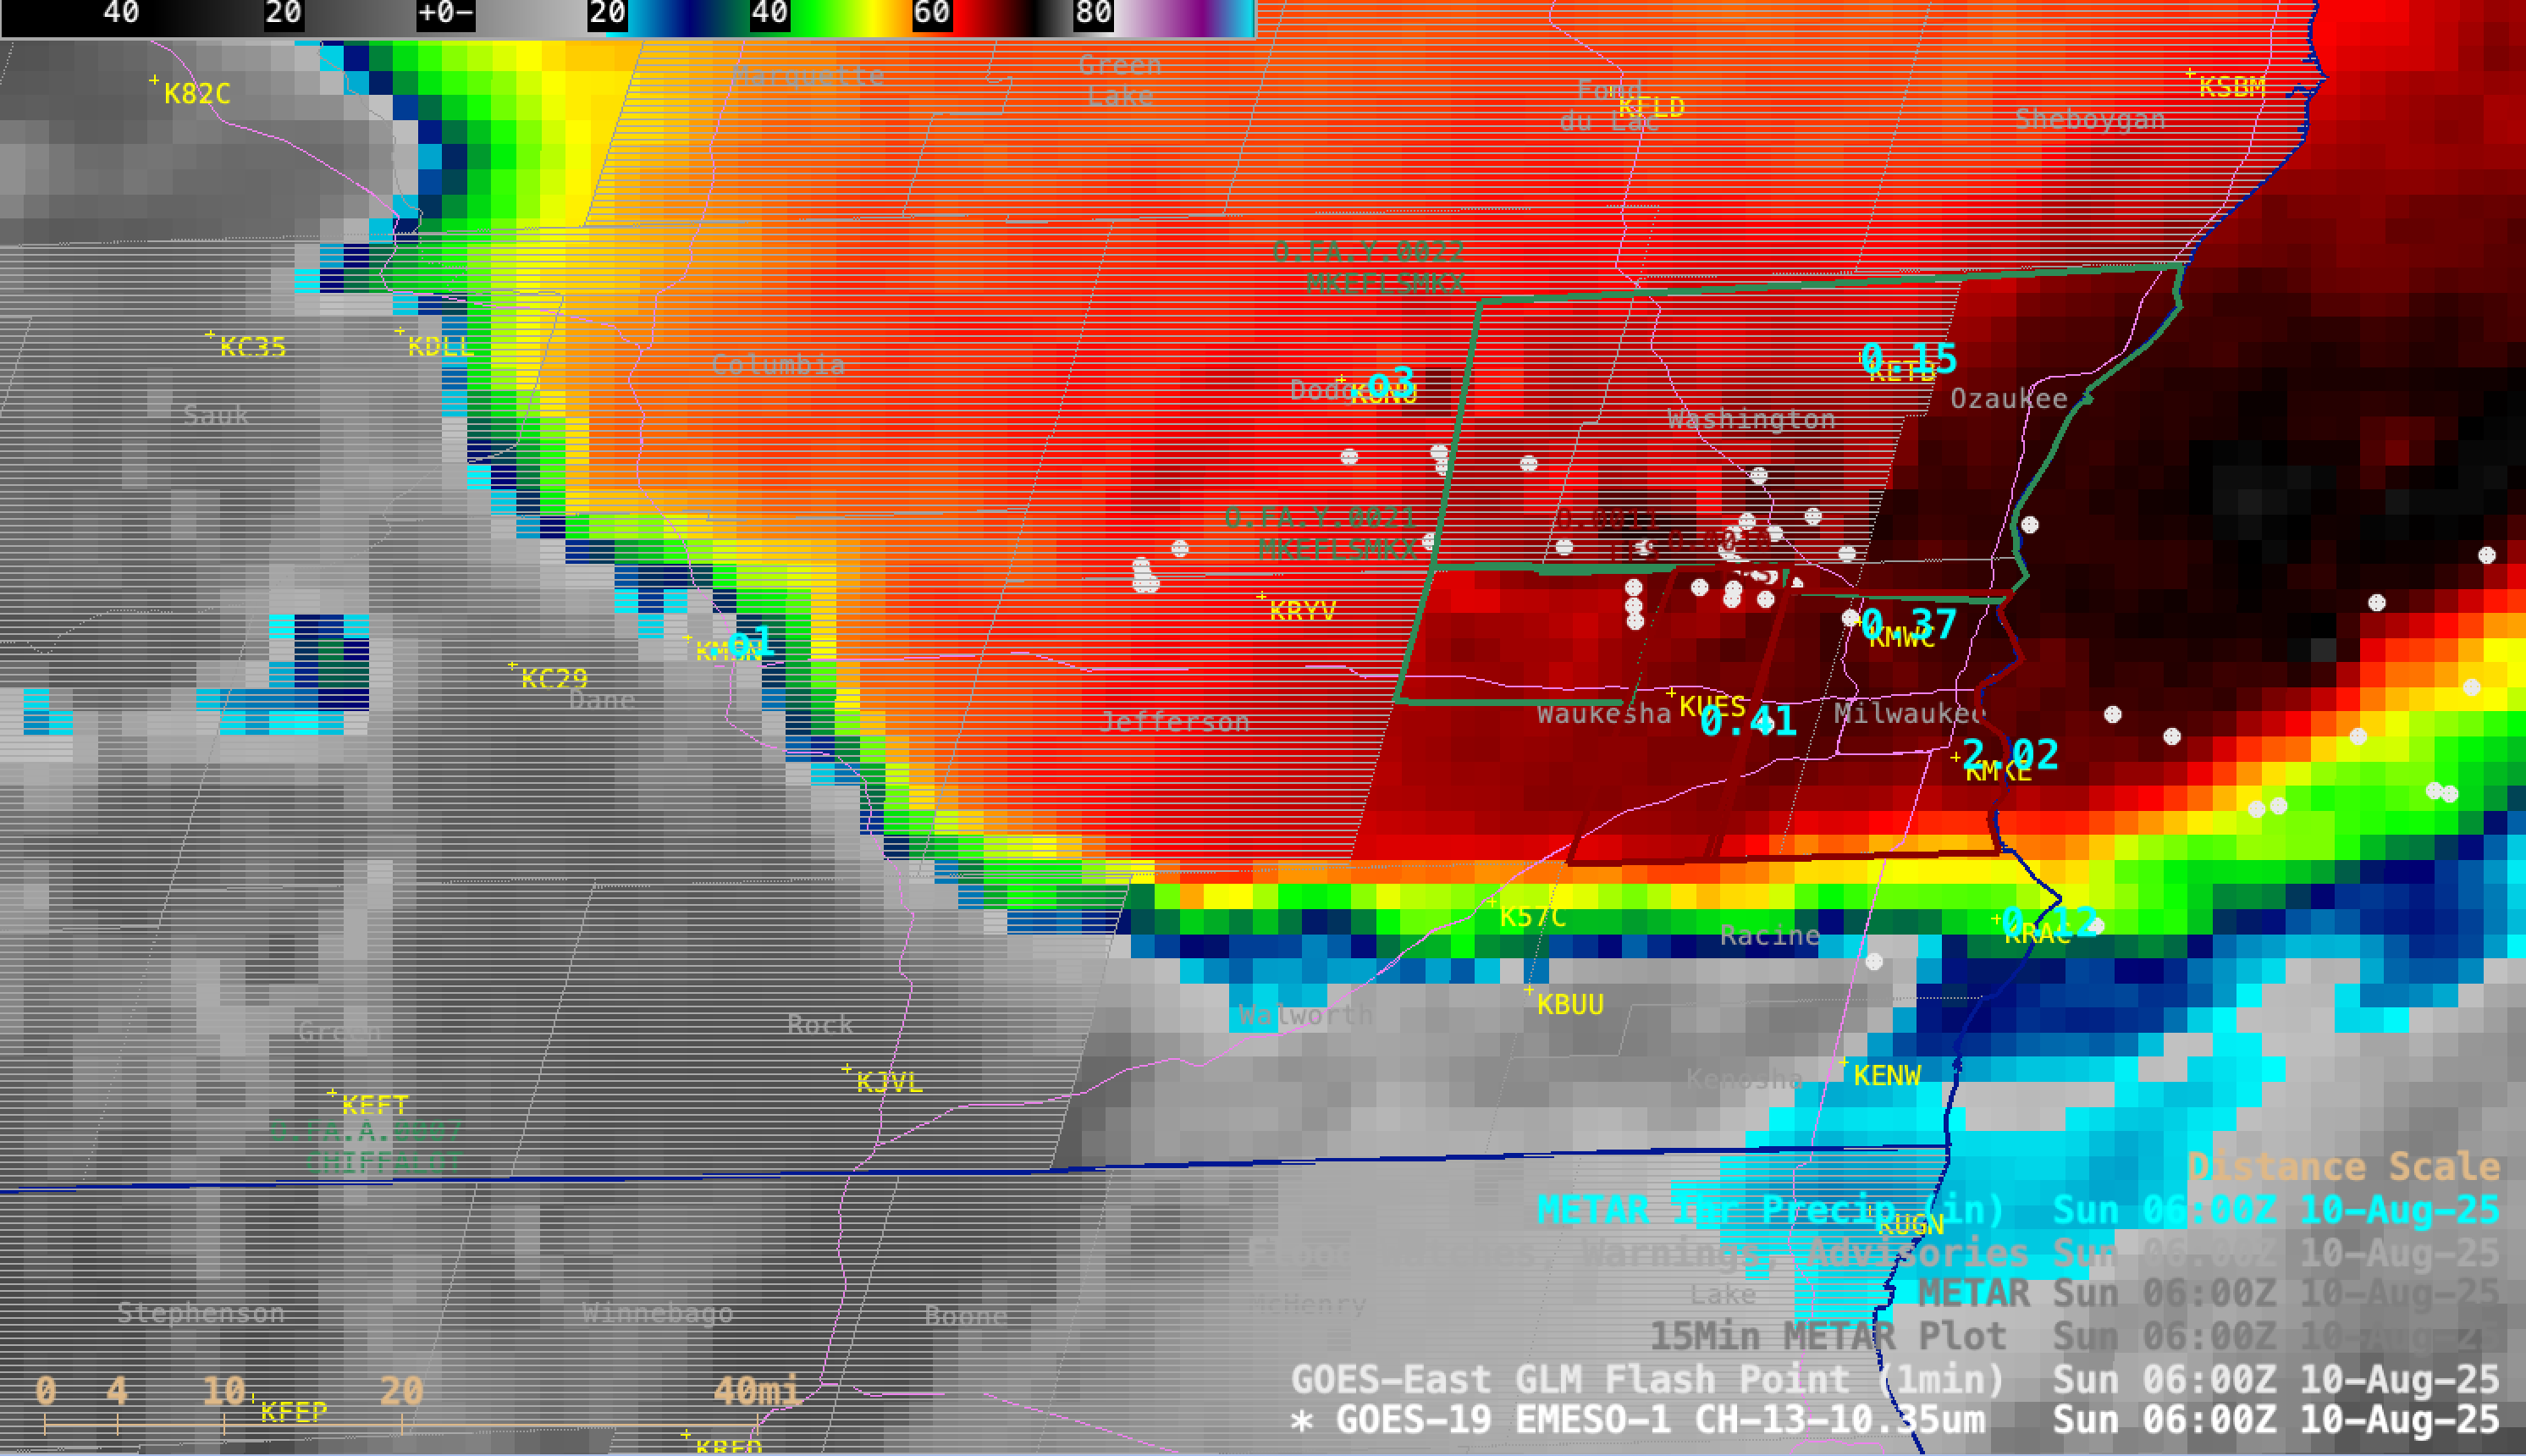
At Milwaukee International Airport, the 24-hour rainfall total of 5.74″ (on 09 August) and the 48-hour rainfall total of 6.91″ (from 09-10 August) were both the second-highest on record for that location. 1-hour precipitation amounts at METAR sites across the metro area were as high as 2.02″ at Milwaukee International Airport KMKE at 0600 UTC (below) — most of Milwaukee County was under a Flash Flood Warning at the time. Other notable 1-hour precipitation amounts included 1.68″ at Milwaukee Timmerman Airport KMWC (at 0800 UTC), 0.97″ at KMKE (at 0400 UTC) and 0.93″ at Waukesha County Airport KUES (at 0300 UTC). These rainfall rates were high enough to occasionally reduce the surface visibility to 1 mile or less at KMKE, KMWC and KUES.
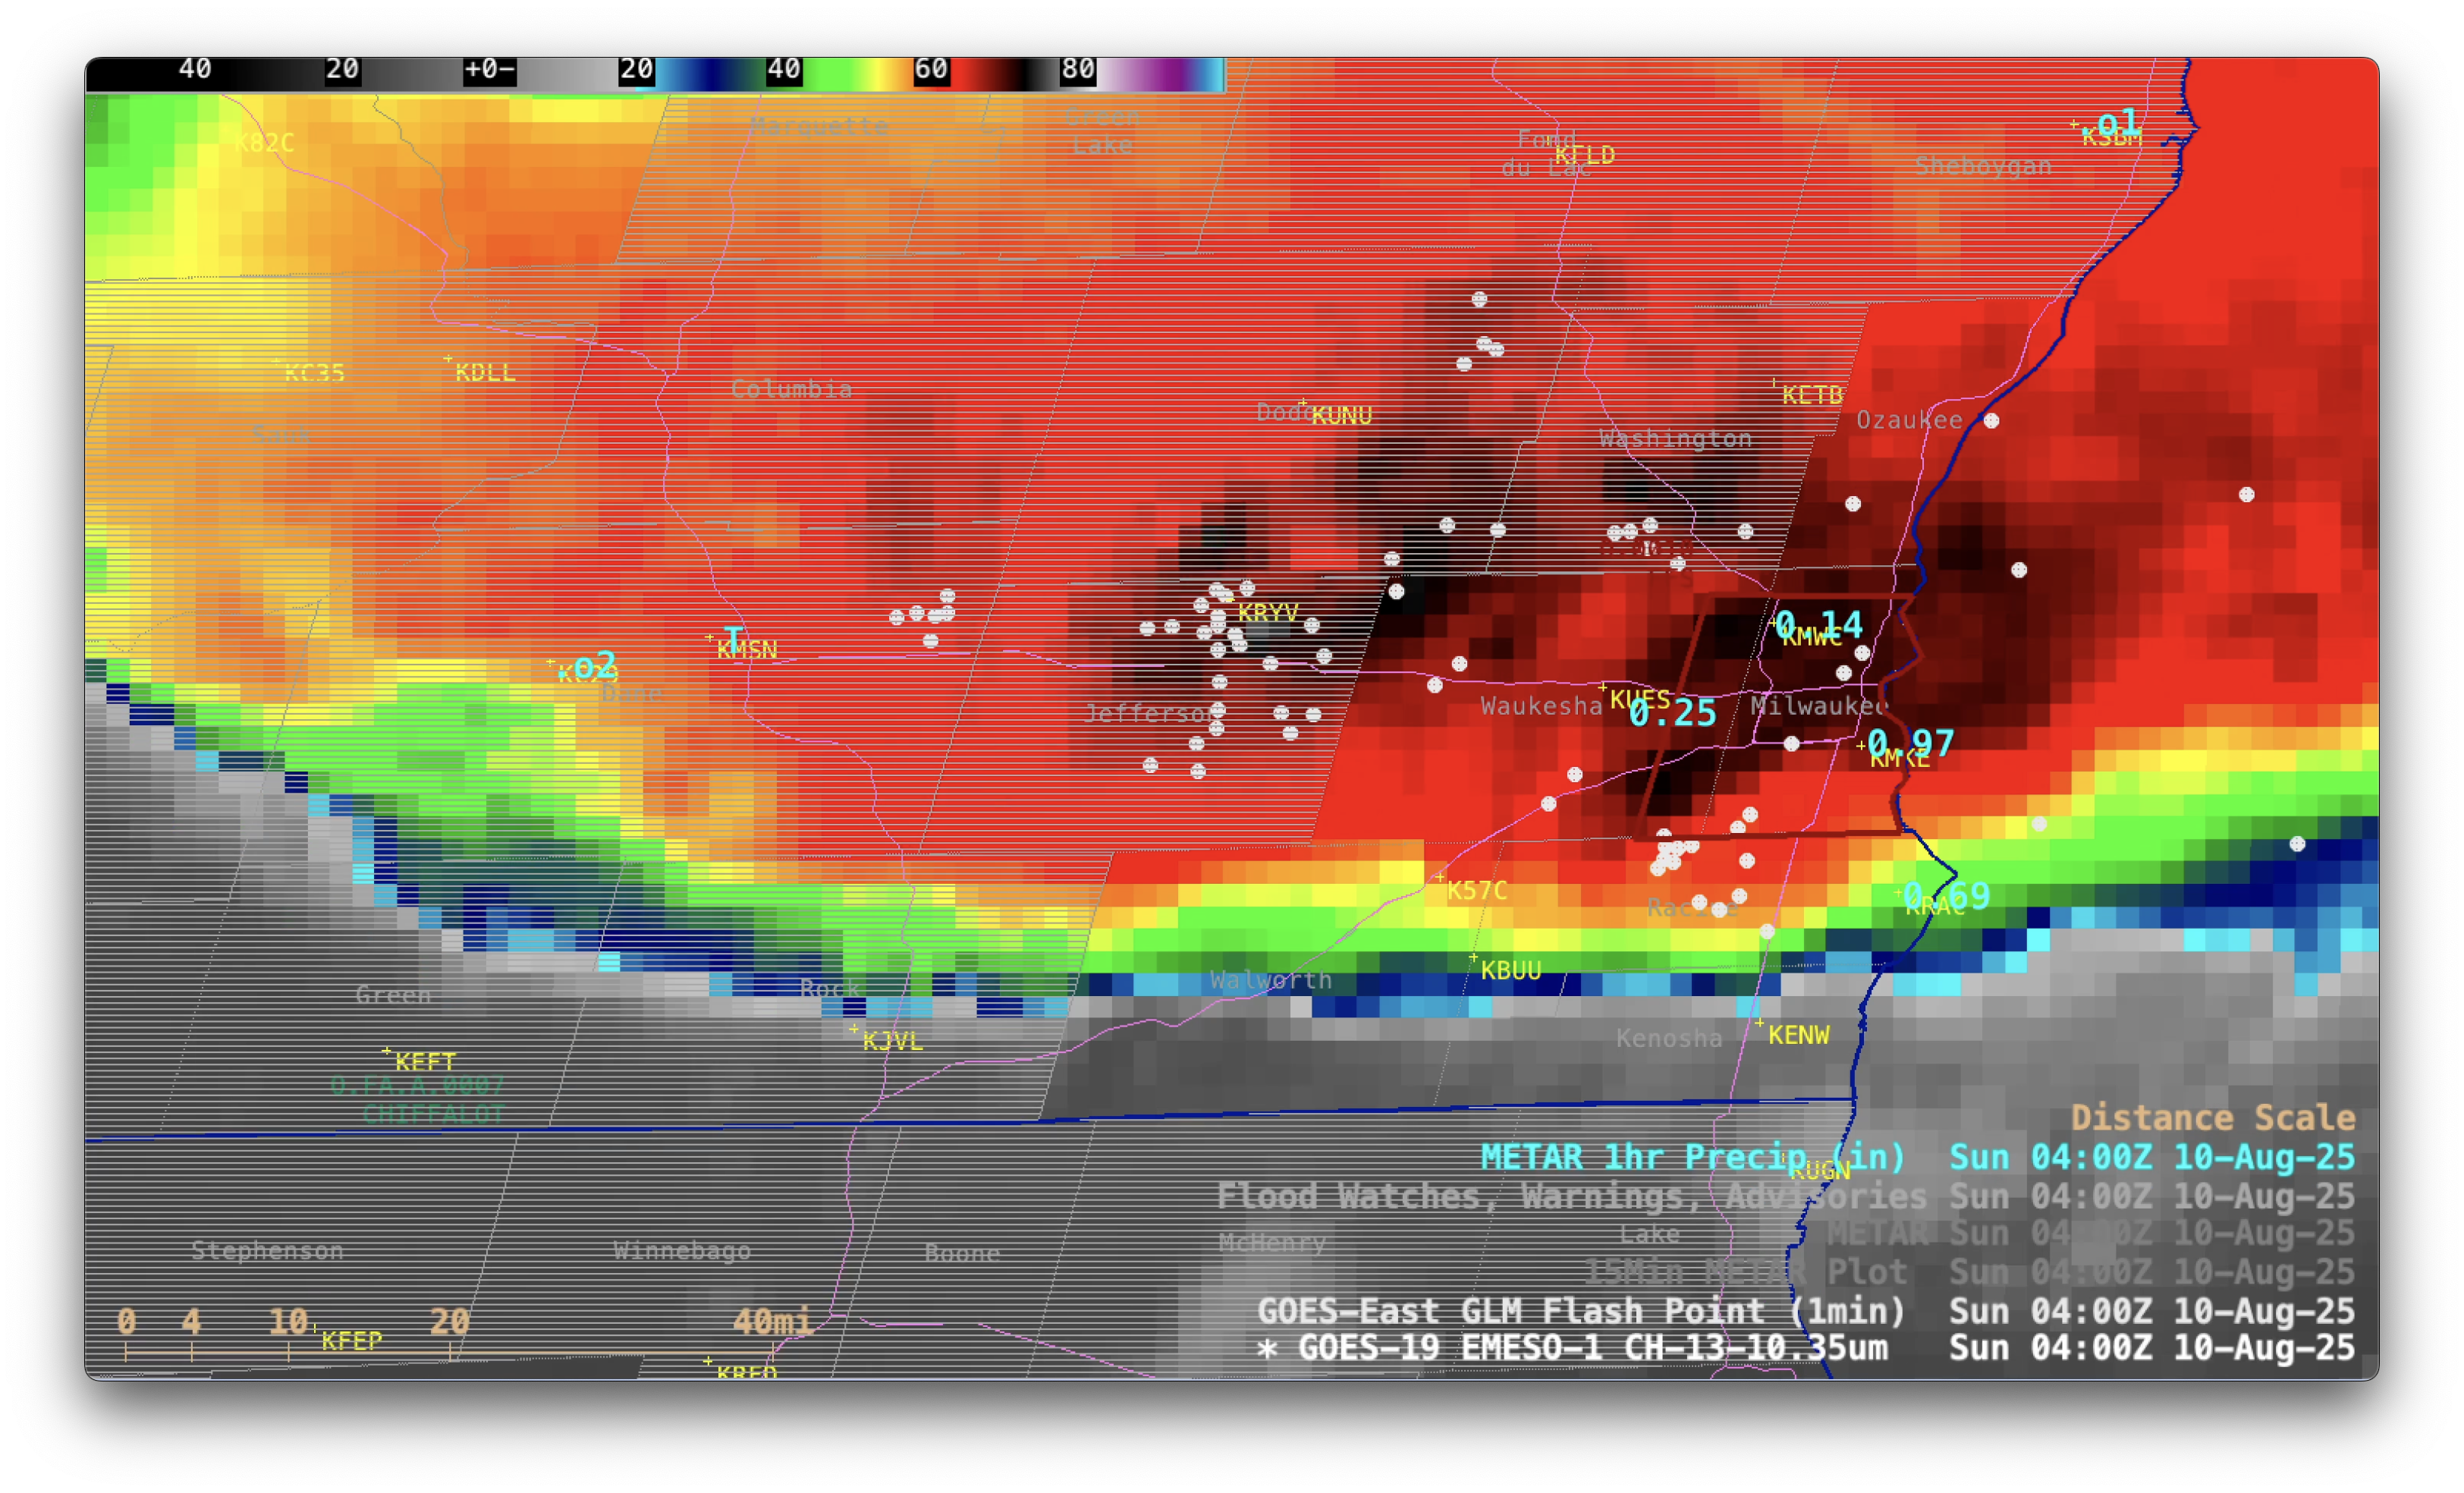
GOES-19 Infrared image at 0600 UTC on 10 August, which included a plot of the 1-hour Precipitation amount of 2.02″ at Milwaukee International Airport KMKE [click to enlarge]
*** In fact, a new 24-hour precipitation record for the state of Wisconsin was set during this event ***
__________

Plot of rawinsonde data from Davenport, Iowa at 0000 UTC on 10 August [click to enlarge]

Plot of the Total Precipitable Water climatology for all 0000 UTC soundings at Davenport, Iowa — with the 10 August / 0000 UTC values highlighted in red [click to enlarge]
__________
In addition to the aforementioned heavy rainfall, during the afternoon hours on 09 August (around 2100 UTC, or 4 PM local time) two hikers were injured by a lightning strike near the Ice Age Trail in Palmyra, with one requiring hospitalization (media report). GOES-19 Visible and Infrared images that included contours of LightningCast Probability (below) indicated that lightning probabilities rapidly increased across that general area, reaching 90-100% over Palmyra about an hour before the lightning strike incident. There were also distinct clusters of GLM Flash Points in the vicinity of Palmyra around and shortly after 2100 UTC.

1-minute GOES-19 Visible (left) and Infrared (right) images, with GLM Flash Points and contours of Parallax-Corrected LightningCast Probability, from 1900-2300 UTC on 09 August [click to play MP4 animation]
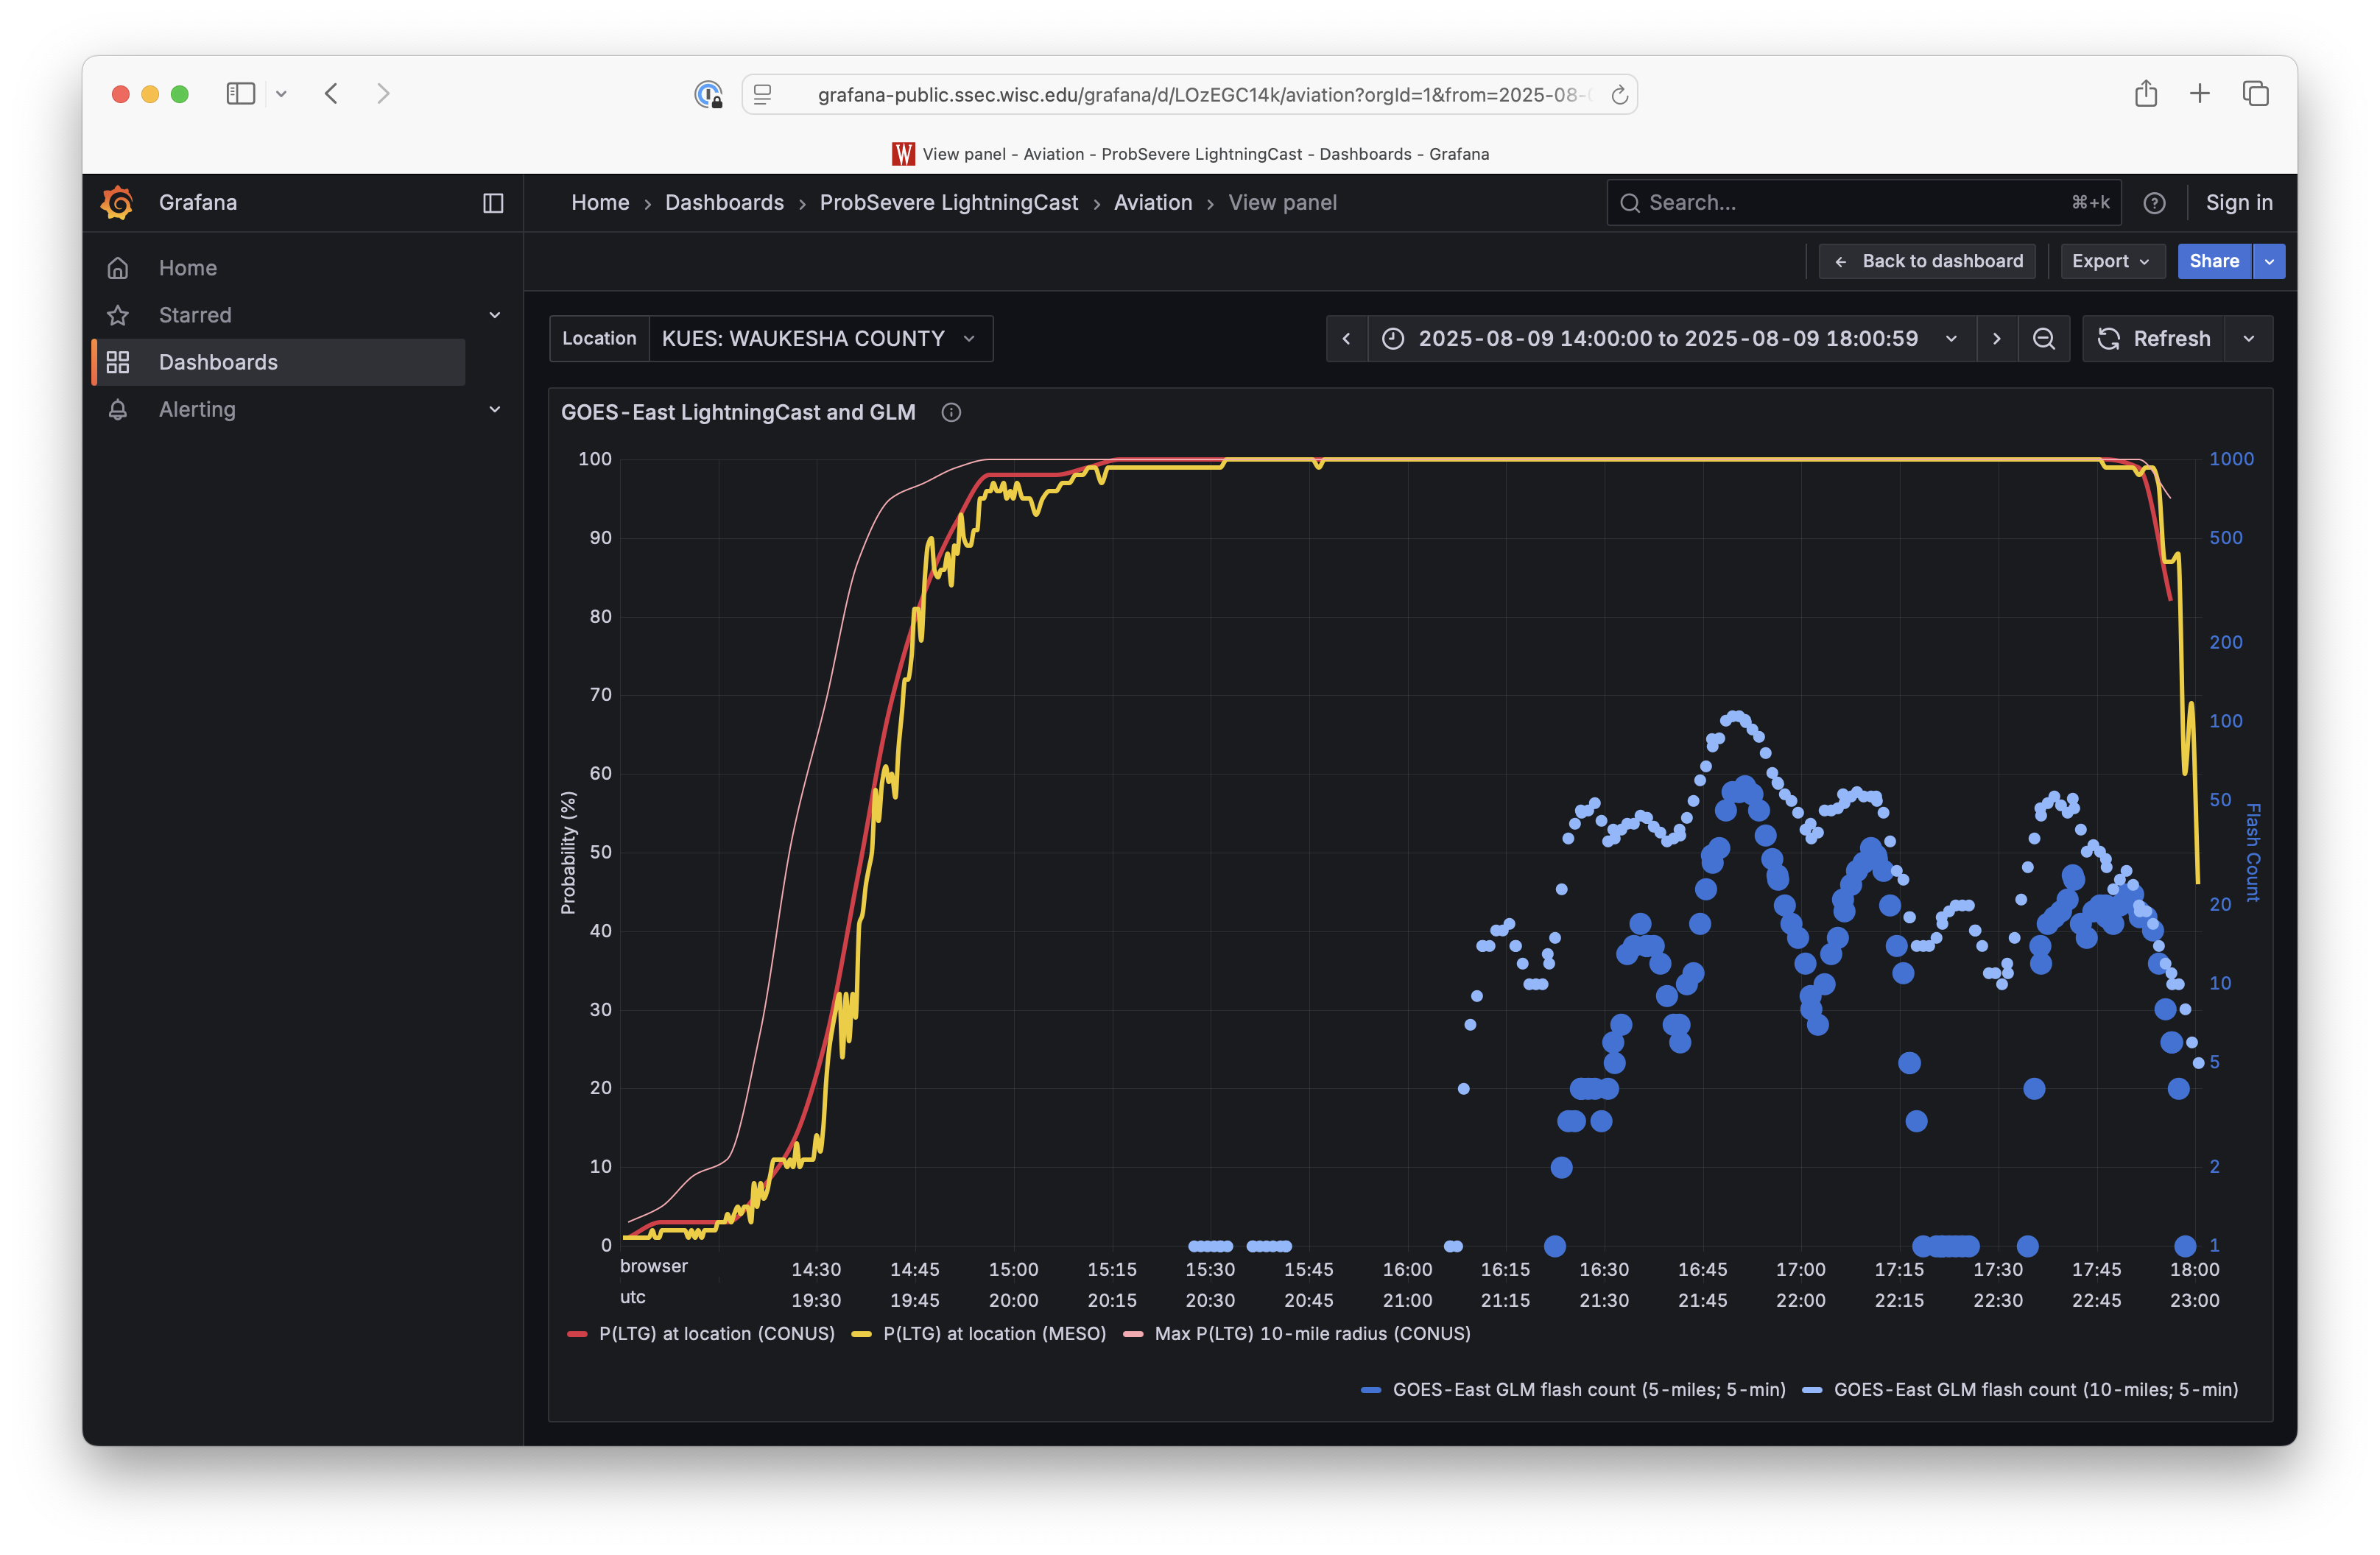
Time series of GOES-19 LightningCast Probability and GOES-19 GLM-detected lightning at and within 5-10 miles of Waukesha County Airport KUES [click to enlarge]
View only this post Read Less


