In the evening of 28 July 2025, residents of the Samoan island of Upolu experienced an intense thunderstorm which produced hail, a very rare event for maritime tropical Pacific environments. Social media videos show 1 – 2 cm hailstones falling around residents excited to see such novel conditions. The forecasters at the National Weather Service office in neighboring Pago Pago, American Samoa (approximately 50 mi or 80 km away), requested and received a mesoscale sector from GOES-18, which easily covered both the US territory of Amercian Samoa as well as the independent nation of Samoa.
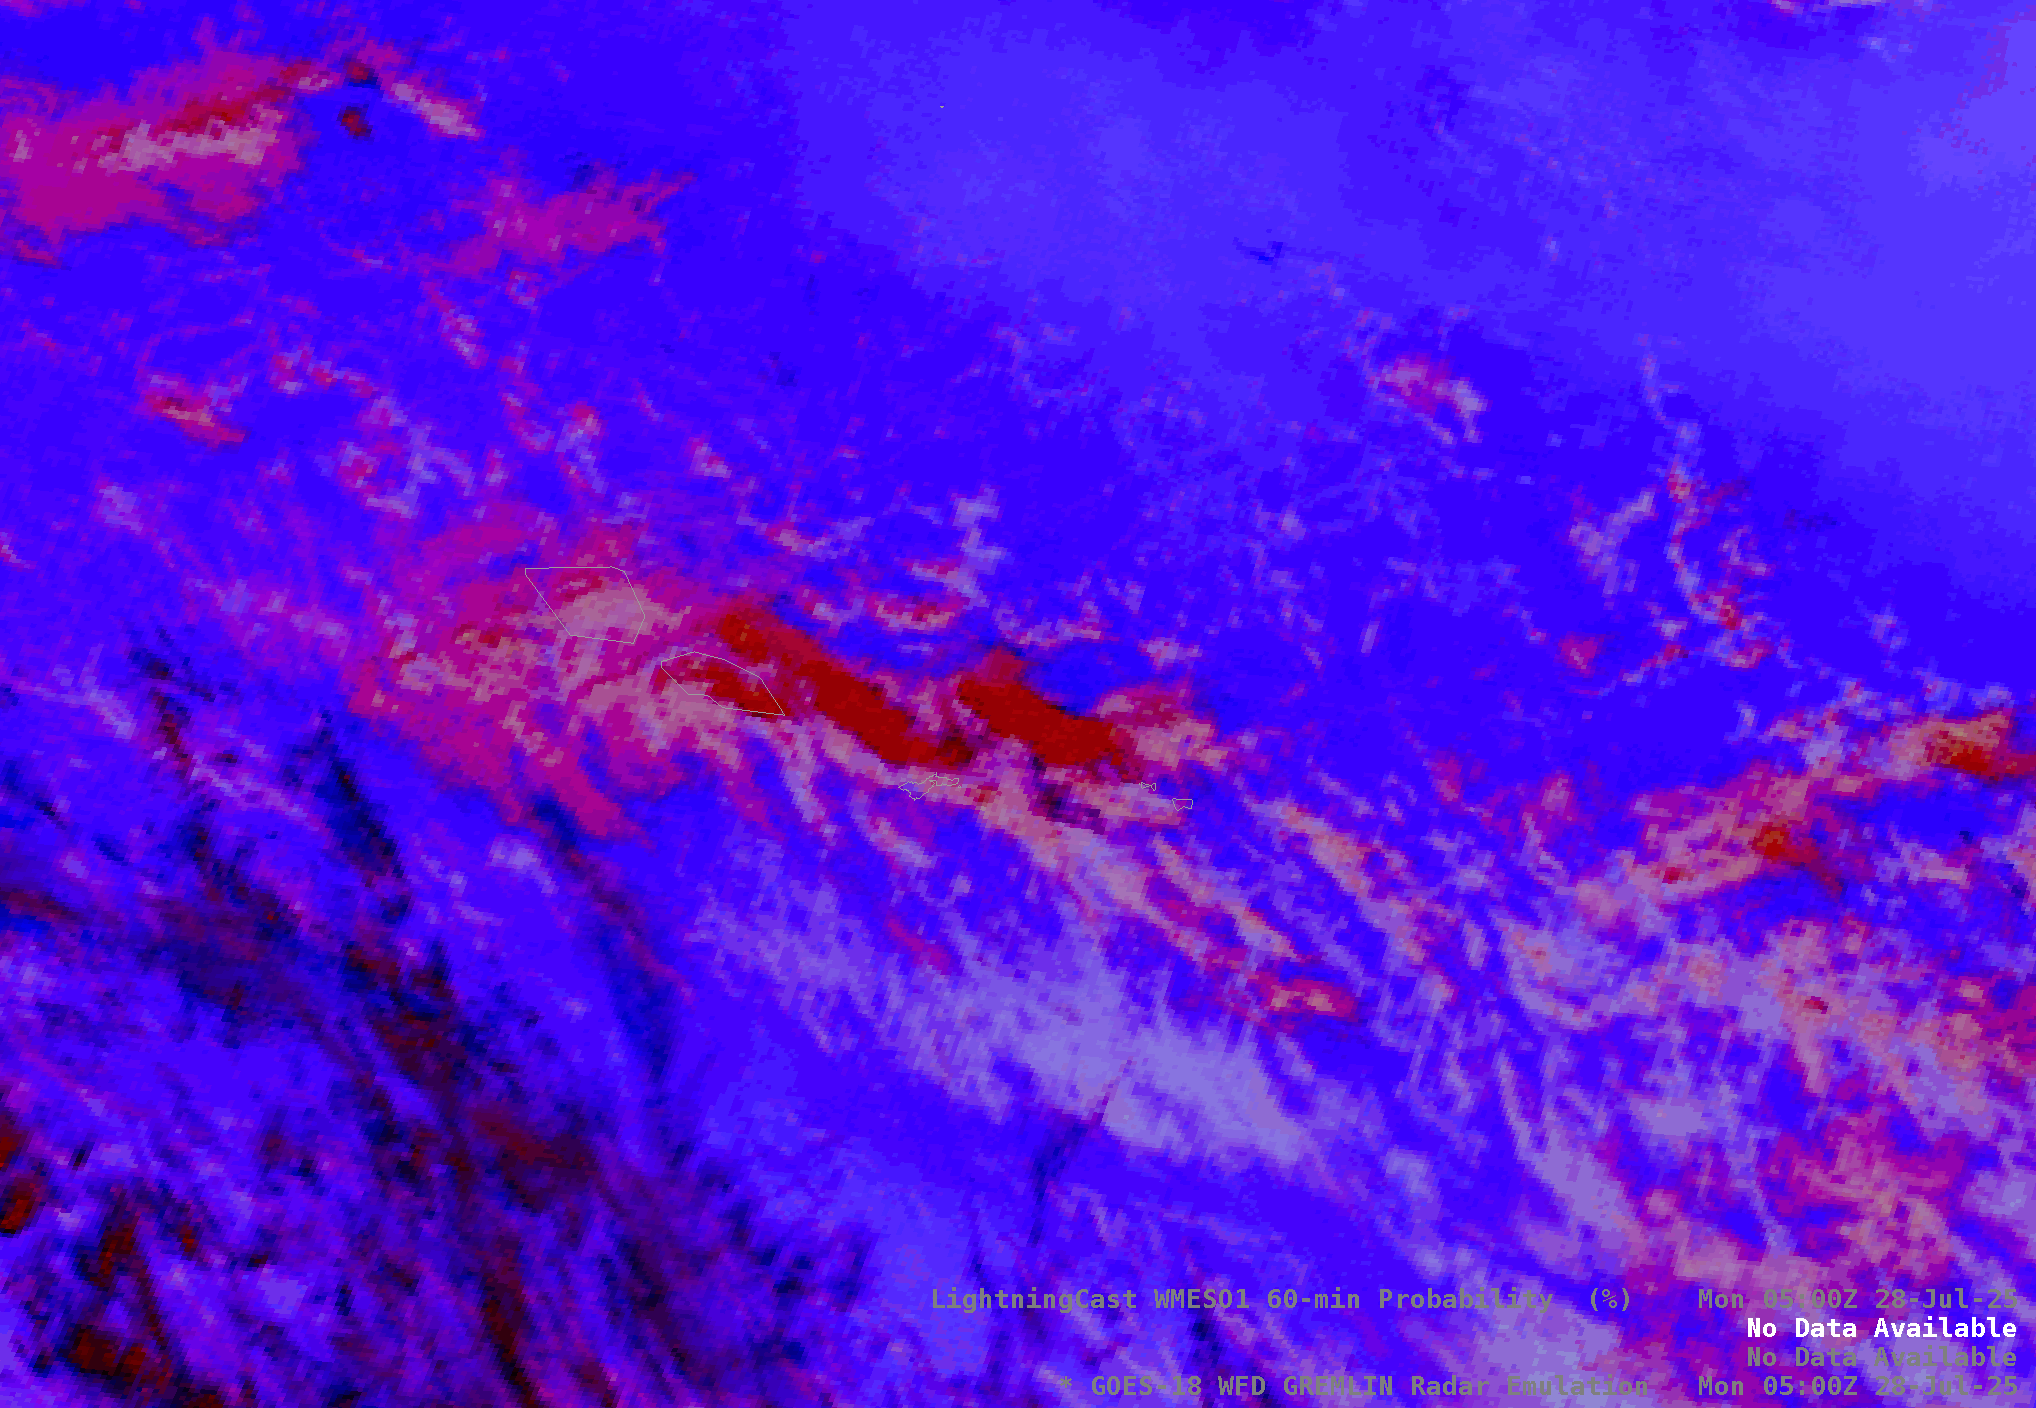
Since American Samoa doesn’t have a radar, the CIMSS ProbSevere algorithm is not well-suited for deployment in that location. However, the CIMSS LightningCast product was available, and it is seen superimposed on the 1 minute mesoscale Band 13 (10 micron data). LightningCast uses AI and machine learning techniques to quantify the probably of a particular storm producing lighting based on its satellite signatures, and here it is clear that this particular storm is capable of producing substantial lightning.
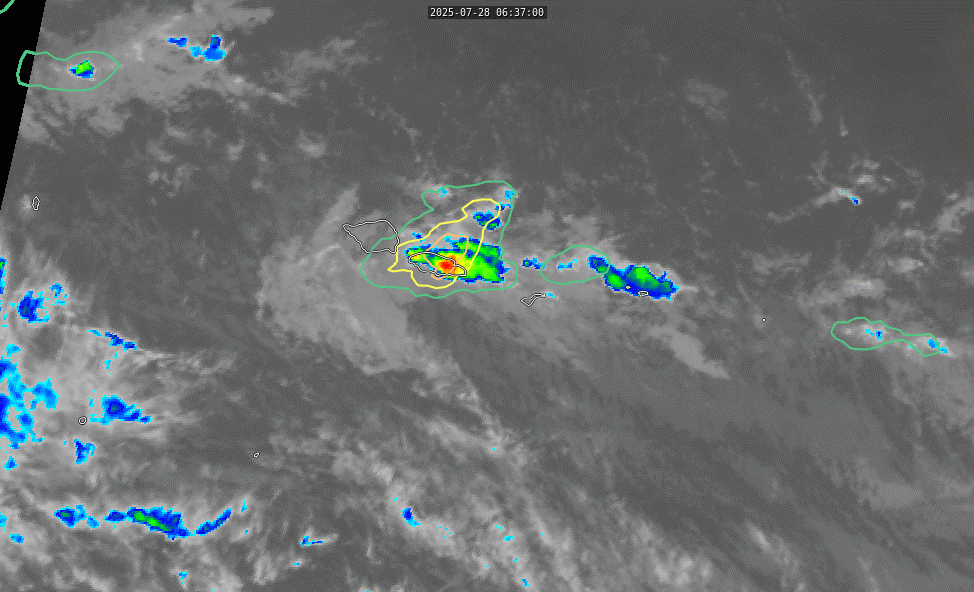
Zooming in on a single frame of the above animation, at 0653 UTC, shows the presence of a very cold brightness temperature at the center of the storm. This is indicative of an overshooting top and is a hallmark of deep, moist convection. Given the storm’s location in the tropics (around 14 degrees south) the troposphere is naturally quite deep and thus the overshooting top indicates the tip of an updraft that penetrates through a very thick layer of the atmosphere.

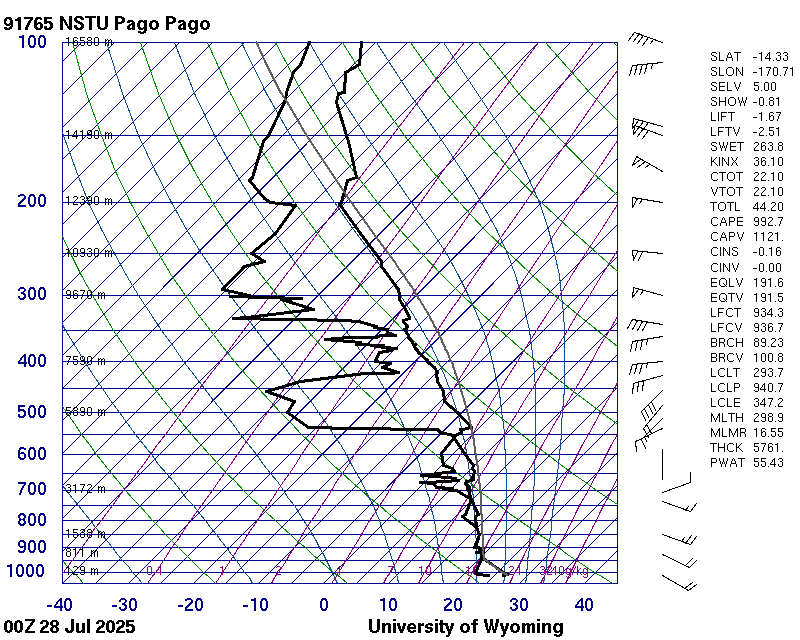
In fact, the 0000 UTC sounding from Pago Pago, AS, shows a tropopause height well over 12 kilometers above the ground, which is a reasonable estimate of the height of the anvil of the cumulonimbus cloud. The overshooting top is soaring even higher above the surface, and thus it is clear that this storm has substantial vertical lift. A classic rule of thumb in the midlatitudes for enhanced hail growth is steep lapse rates in the -10 C to -30 C layer of the atmosphere as this is where hail growth is at its greatest. (Warmer than -10 means water is less likely to freeze on contact, colder than -30 means supercooled droplets are rare). This event exhibits strong instability in the hail growth zone with lapse rates that are much steeper than the moist adiabatic lapse rate (blue lines) between those temperatures.
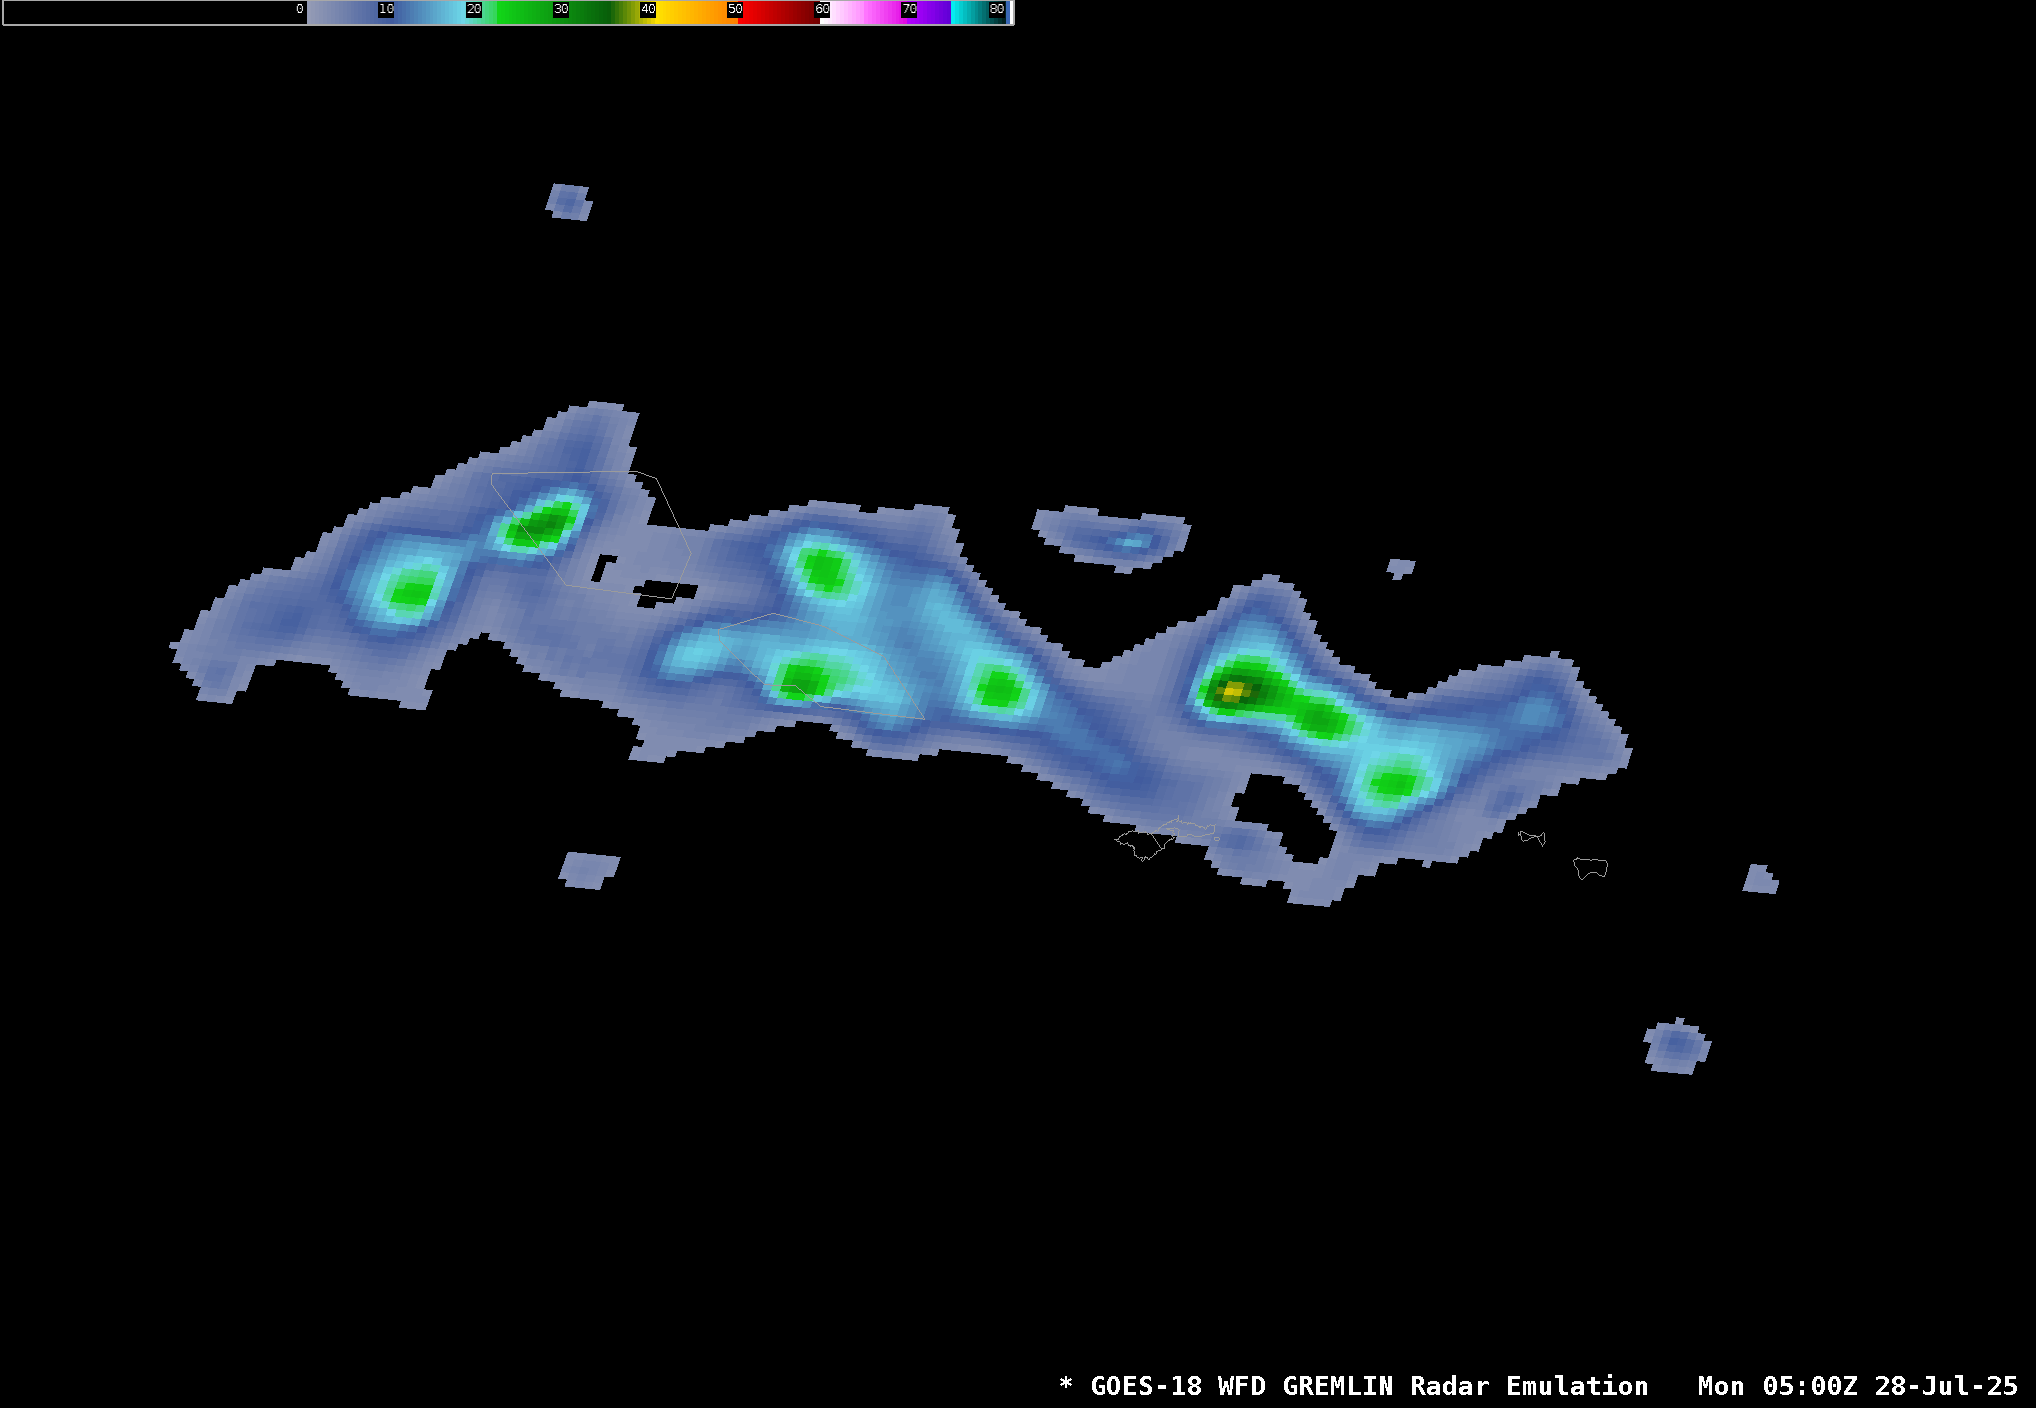
With no radar at Pago Pago, satellite-based estiamtes of precipitation intensity are required. This animation shows a loop of the CIMSS GREMLIN product, which aims to simulate radar reflectivity from satellite observations. GREMLIN was trained using GOES ABI and GLM inputs over the continental United States, and while its accuracy may be highest there, it can still provide useful information in other parts of the GOES domains about the intensity of a storm and its evolution.
The Night Microphysics RGB also can provide some insight. Here, the presence of large areas of red cloud help verify that we are looking at thick ice anvils associated with deep convection, and really helps separate the deep convective clouds from the low level ones. This also makes the vertical shear of the wind profile easy to recognize, with the low level clouds moving to the west with eastward moving anvils superimposed on top of them.
Hail is rare in the tropics for a variety of reasons. The first is that it is quite warm. In the above skew-T, the freezing level is approximately 580 mb. While deep, vigorous convection may be producing hail storms more frequently, they melt by the time they reach the surface. A second factor is that humidity and precipitable water values are high. This inhibits evaporative cooling by the rain (helping to lower the temperature below the cloud and giving the hailstones a greater opportunity to reach the surface). This storm appears to buck that trend with a strong updraft and particularly strong buoyancy in the layer of the atmosphere where hail is most likely to form. Whatever the reason, the people of Samoa will remember this event for a long time to come.
View only this post Read Less


