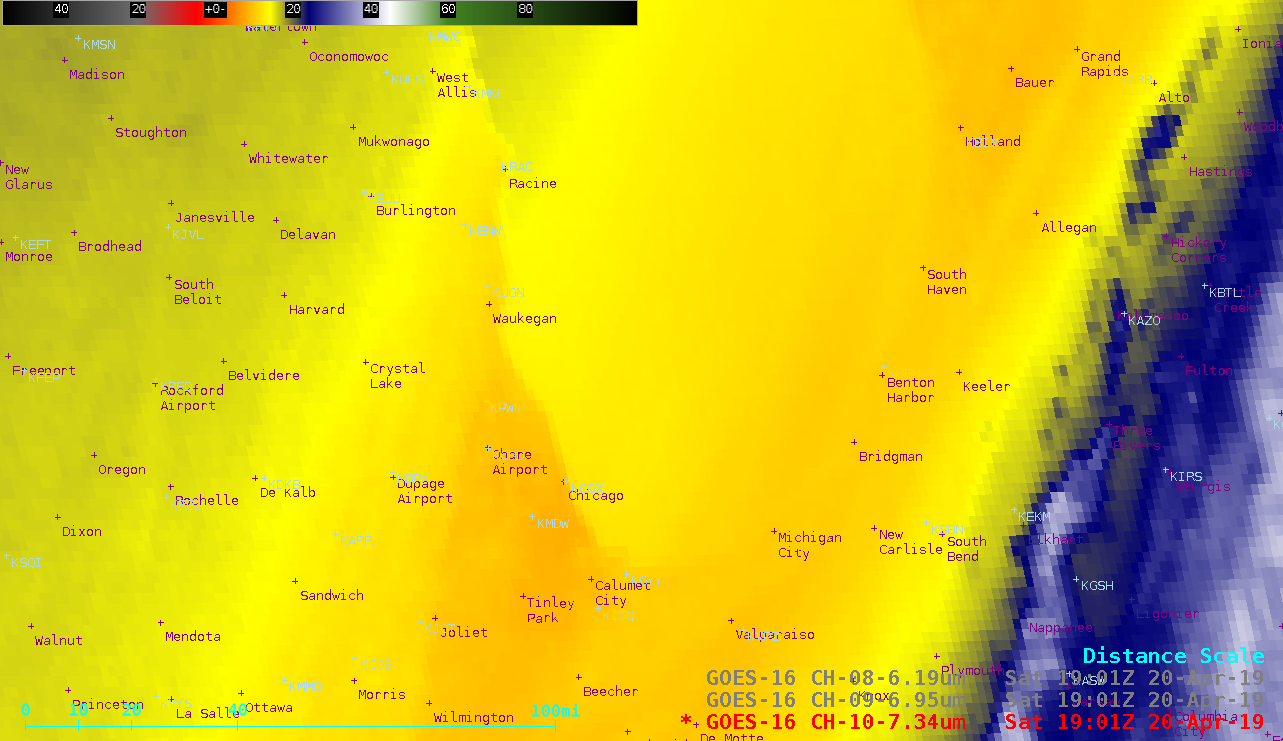
GOES-16 (GOES-East) Low-level (7.3 µm) and Mid-level (6.9 µm) Water Vapor images (above) revealed a southwest-to-northeast oriented band of anomalously-dry air along the northwest periphery of a slow-moving low pressure center over the eastern US on 20 April 2019. The hourly dew point dropped to 10ºF at Chicago O’Hare, with a Relative Humidity value of 12%... Read More
![GOES-16 Low-level (7.3 µm, left) and Mid-level (6.9 µm, right) Water Vapor images [click to play animation | MP4]](https://cimss.ssec.wisc.edu/satellite-blog/wp-content/uploads/sites/5/2019/04/G16_WATER_VAPOR_CHI_20APR2019_2019110_190119_GOES-16_0002PANELS.GIF)
GOES-16 Low-level (7.3 µm, left) and Mid-level (6.9 µm, right) Water Vapor images, with hourly plots of surface reports [click to play animation | MP4]
GOES-16
(GOES-East) Low-level (
7.3 µm) and Mid-level (
6.9 µm) Water Vapor images
(above) revealed a southwest-to-northeast oriented band of
anomalously-dry air along the northwest periphery of a slow-moving low pressure center over the eastern US on
20 April 2019. The hourly dew point dropped to 10ºF at
Chicago O’Hare, with a Relative Humidity value of 12% — a new
record low value for Chicago. In addition, the dew point dropped to 6ºF at the
Chicago Midway and
Chicago Executive airports. With this dry air in place, note that the coastline of a portion of southern Lake Michigan could be seen in the 7.3 µm (and to a lesser extent, the 6.9 µm) Water Vapor images.
AWIPS examples of the GOES-16 Low-level and Mid-level Water Vapor imagery are shown below.
![GOES-16 Low-level (7.3 µm) and Mid-level (6.9 µm) Water Vapor images [click to play animation | MP4]](https://cimss.ssec.wisc.edu/satellite-blog/wp-content/uploads/sites/5/2019/04/chi_wv10_nomap-20190420_190119.png)
GOES-16 Low-level (7.3 µm) and Mid-level (6.9 µm) Water Vapor images [click to play animation | MP4]
A larger-scale view of the GOES-16 Low-level Water Vapor (7.3 µm) image at 1201 UTC
(below) showed that the Gaylord, Michigan (KAPX) and Lincoln, Illinois (KILX) rawinsonde sites were located within the elongated zone of dry air.
![GOES-16 Low-level Water Vapor (7.3 µm) image, with plots of rawinsonde sites [click to enlarge]](https://cimss.ssec.wisc.edu/satellite-blog/wp-content/uploads/sites/5/2019/04/G16_WV10_RAOB_SITES_20APR2019_2019110_120119_GOES-16_0001PANEL.GIF)
GOES-16 Low-level Water Vapor (7.3 µm) image at 1201 UTC, with plots of rawinsonde sites [click to enlarge]
Plots of GOES-16 Water Vapor
weighting functions for Gaylord, Michigan (KAPX) and Lincoln, Illinois (KILX) at 12 UTC
(below) showed significant contributions from Band 10
(7.3 µm, violet) radiation originating at the surface — this allowed the thermal signature of the outline of Lake Michigan to be easily seen in the 7.3 µm Water Vapor imagery. Although the contribution of Band 9
(6.9 µm, blue) radiation originating near the surface was small, it was still enough to enable a brief and subtle coastal signature to be seen in the 6.9 µm images.
![GOES-16 Water Vapor weighting functions for Gaylord, Michigan and Lincoln, Illinois at 12 UTC [click to enlarge]](https://cimss.ssec.wisc.edu/satellite-blog/wp-content/uploads/sites/5/2019/04/190420_12utc_kapx_kilx_waterVapor_weightingFunctions_anim.gif)
GOES-16 Water Vapor weighting functions for Gaylord, Michigan (KAPX) and Lincoln, Illinois (KILX) at 12 UTC [click to enlarge]
Plots of Total Precipitable Water
sounding climatology for Gaylord, Michigan (KAPX) and Lincoln, Illinois (KILX), with record minimum values for 20 April at 12 UTC highlighted within a red box
(below) showed that the 0.10″ at KAPX and the 0.12″ at KILX set new records for that date/time.
![Plots of Total Precipitable Water sounding climatology for Gaylord, Michigan (KAPX) and Lincoln, Illinois (KILX), with record minimum values for 20 April at 12 UTC highlighted within a red box [click to enlarge]](https://cimss.ssec.wisc.edu/satellite-blog/wp-content/uploads/sites/5/2019/04/190420_12utc_kapx_kilx_tpw_sounding_climatology_anim.gif)
Plots of Total Precipitable Water sounding climatology for Gaylord, Michigan (KAPX) and Lincoln, Illinois (KILX), with record minimum values for 20 April at 12 UTC highlighted within a red box [click to enlarge]
View only this post
Read Less

![GOES-17 "Red" Visible (0.64 µm) and Shortwave Infrared (3.9 µm) images [click to play animation | MP4]](https://cimss.ssec.wisc.edu/satellite-blog/wp-content/uploads/sites/5/2019/04/190424_goes17_visible_shortwaveInfrared_East_Pacific_ship_tracks_anim.gif)

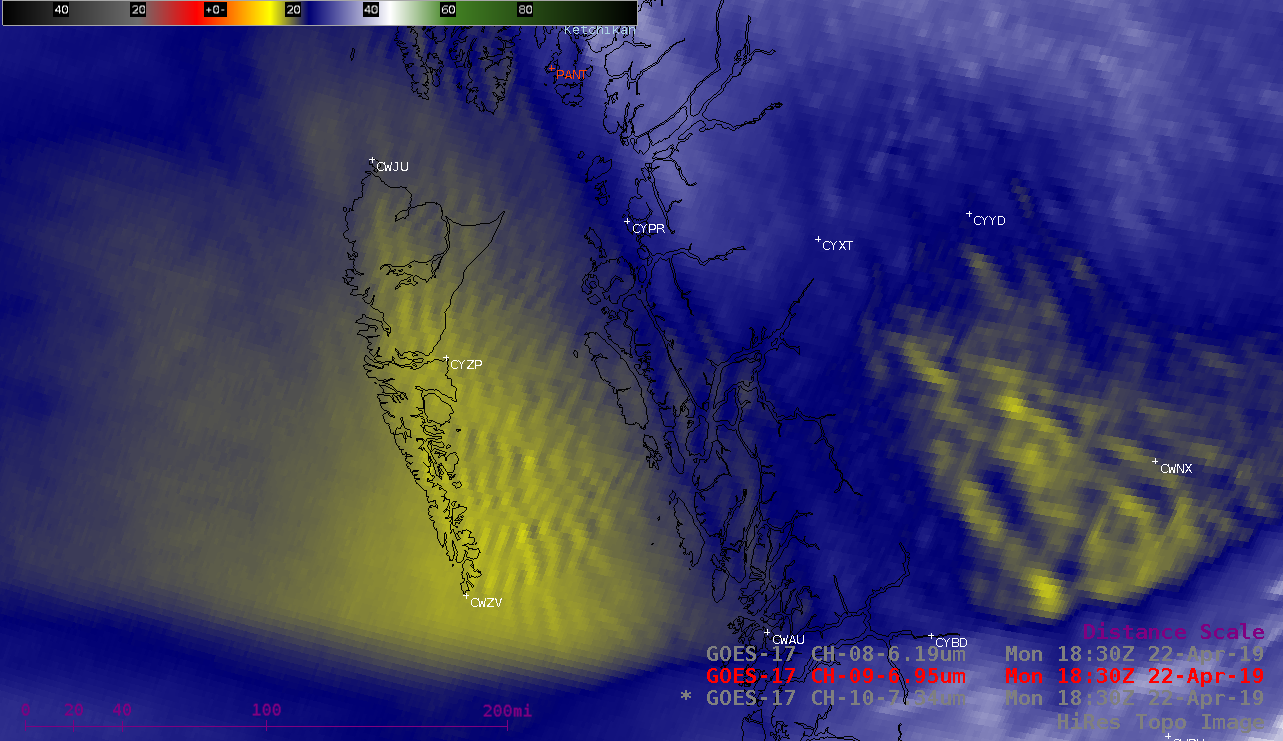
![GOES-17 Low-level (7.3 µm), Mid-level (6.9 µm) and Upper-level (6.2 µm) Water Vapor images, with topography [click to play animation | MP4]](https://cimss.ssec.wisc.edu/satellite-blog/wp-content/uploads/sites/5/2019/04/190422_goes17_waterVapor_Haida_Gwaii_waves_anim.gif)
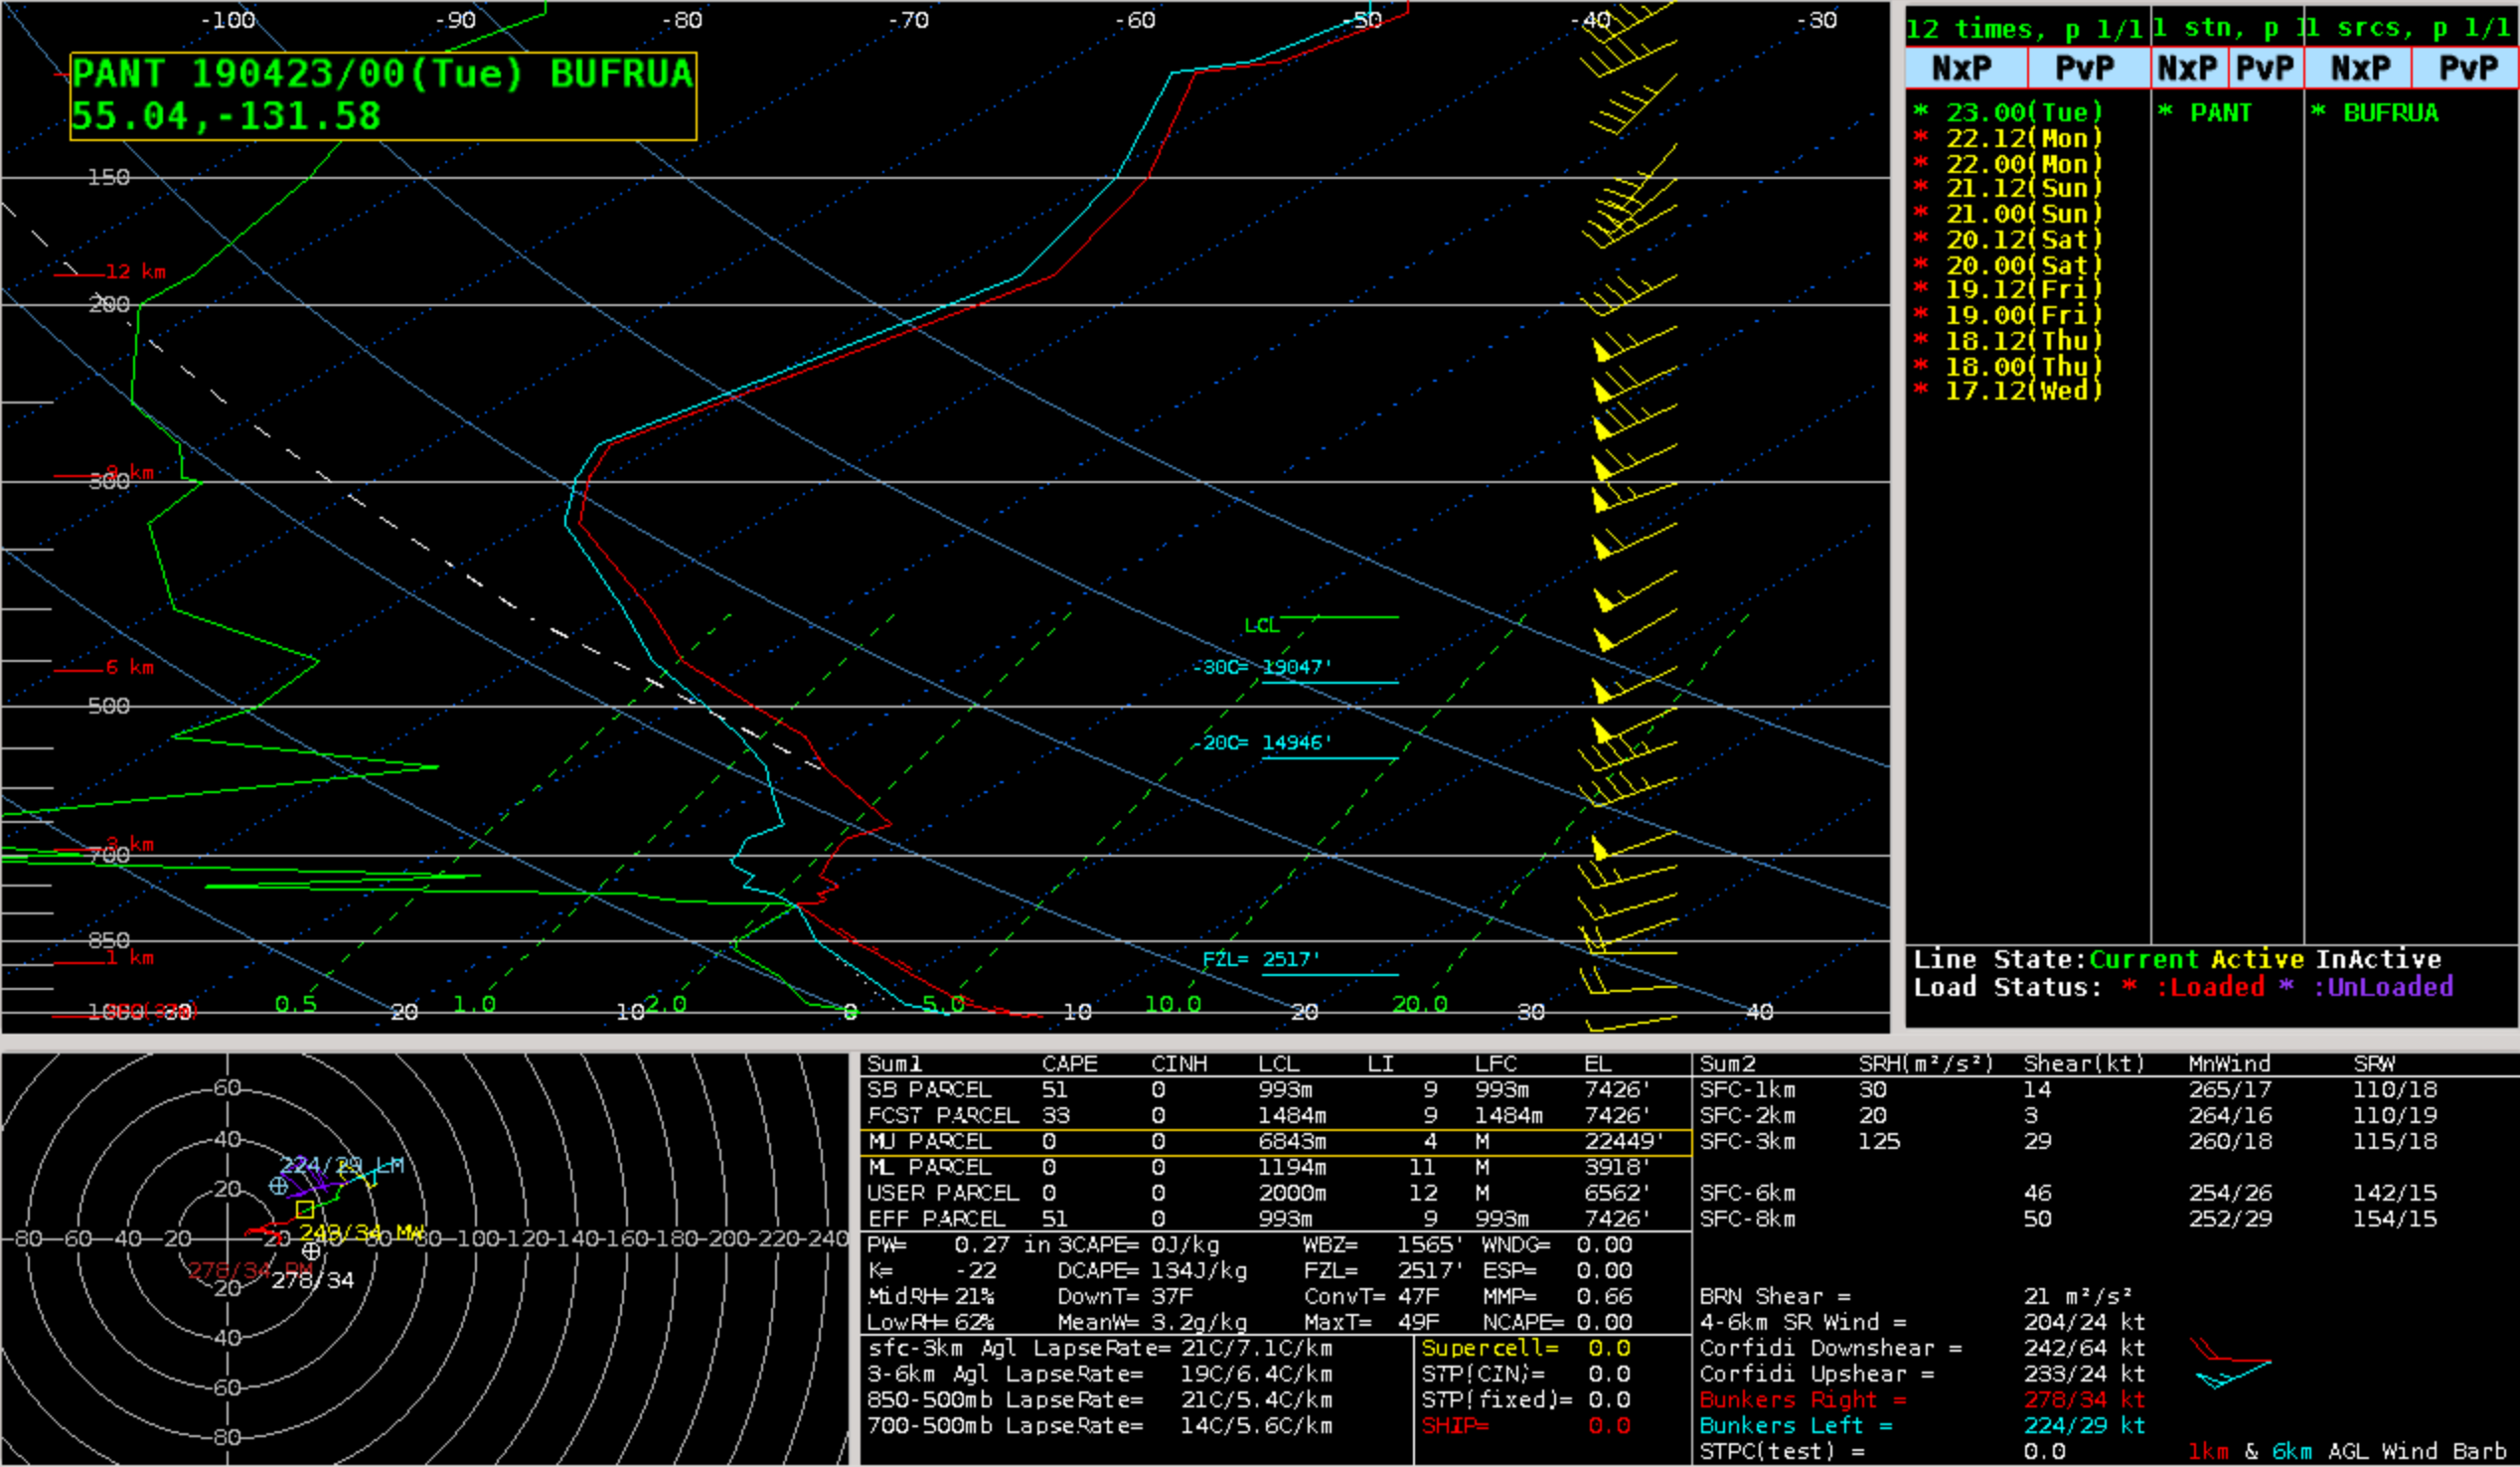
![GOES-17 Water Vapor weighting functions calculated from 12 UTC rawinsonde data at Annette Island, Alaska [click to enlarge]](https://cimss.ssec.wisc.edu/satellite-blog/wp-content/uploads/sites/5/2019/04/190423_00utc_pant_waterVapor_weightingFunctions.png)
![Suomi NPP VIIRS Visible (0.64 µm) and Infrared Window (11.45 µm) images at 2137 UTC [click to enlarge]](https://cimss.ssec.wisc.edu/satellite-blog/wp-content/uploads/sites/5/2019/04/190422_2137utc_suomiNPP_viirs_visible_infrared_Haida_Gwaii_anim.gif)
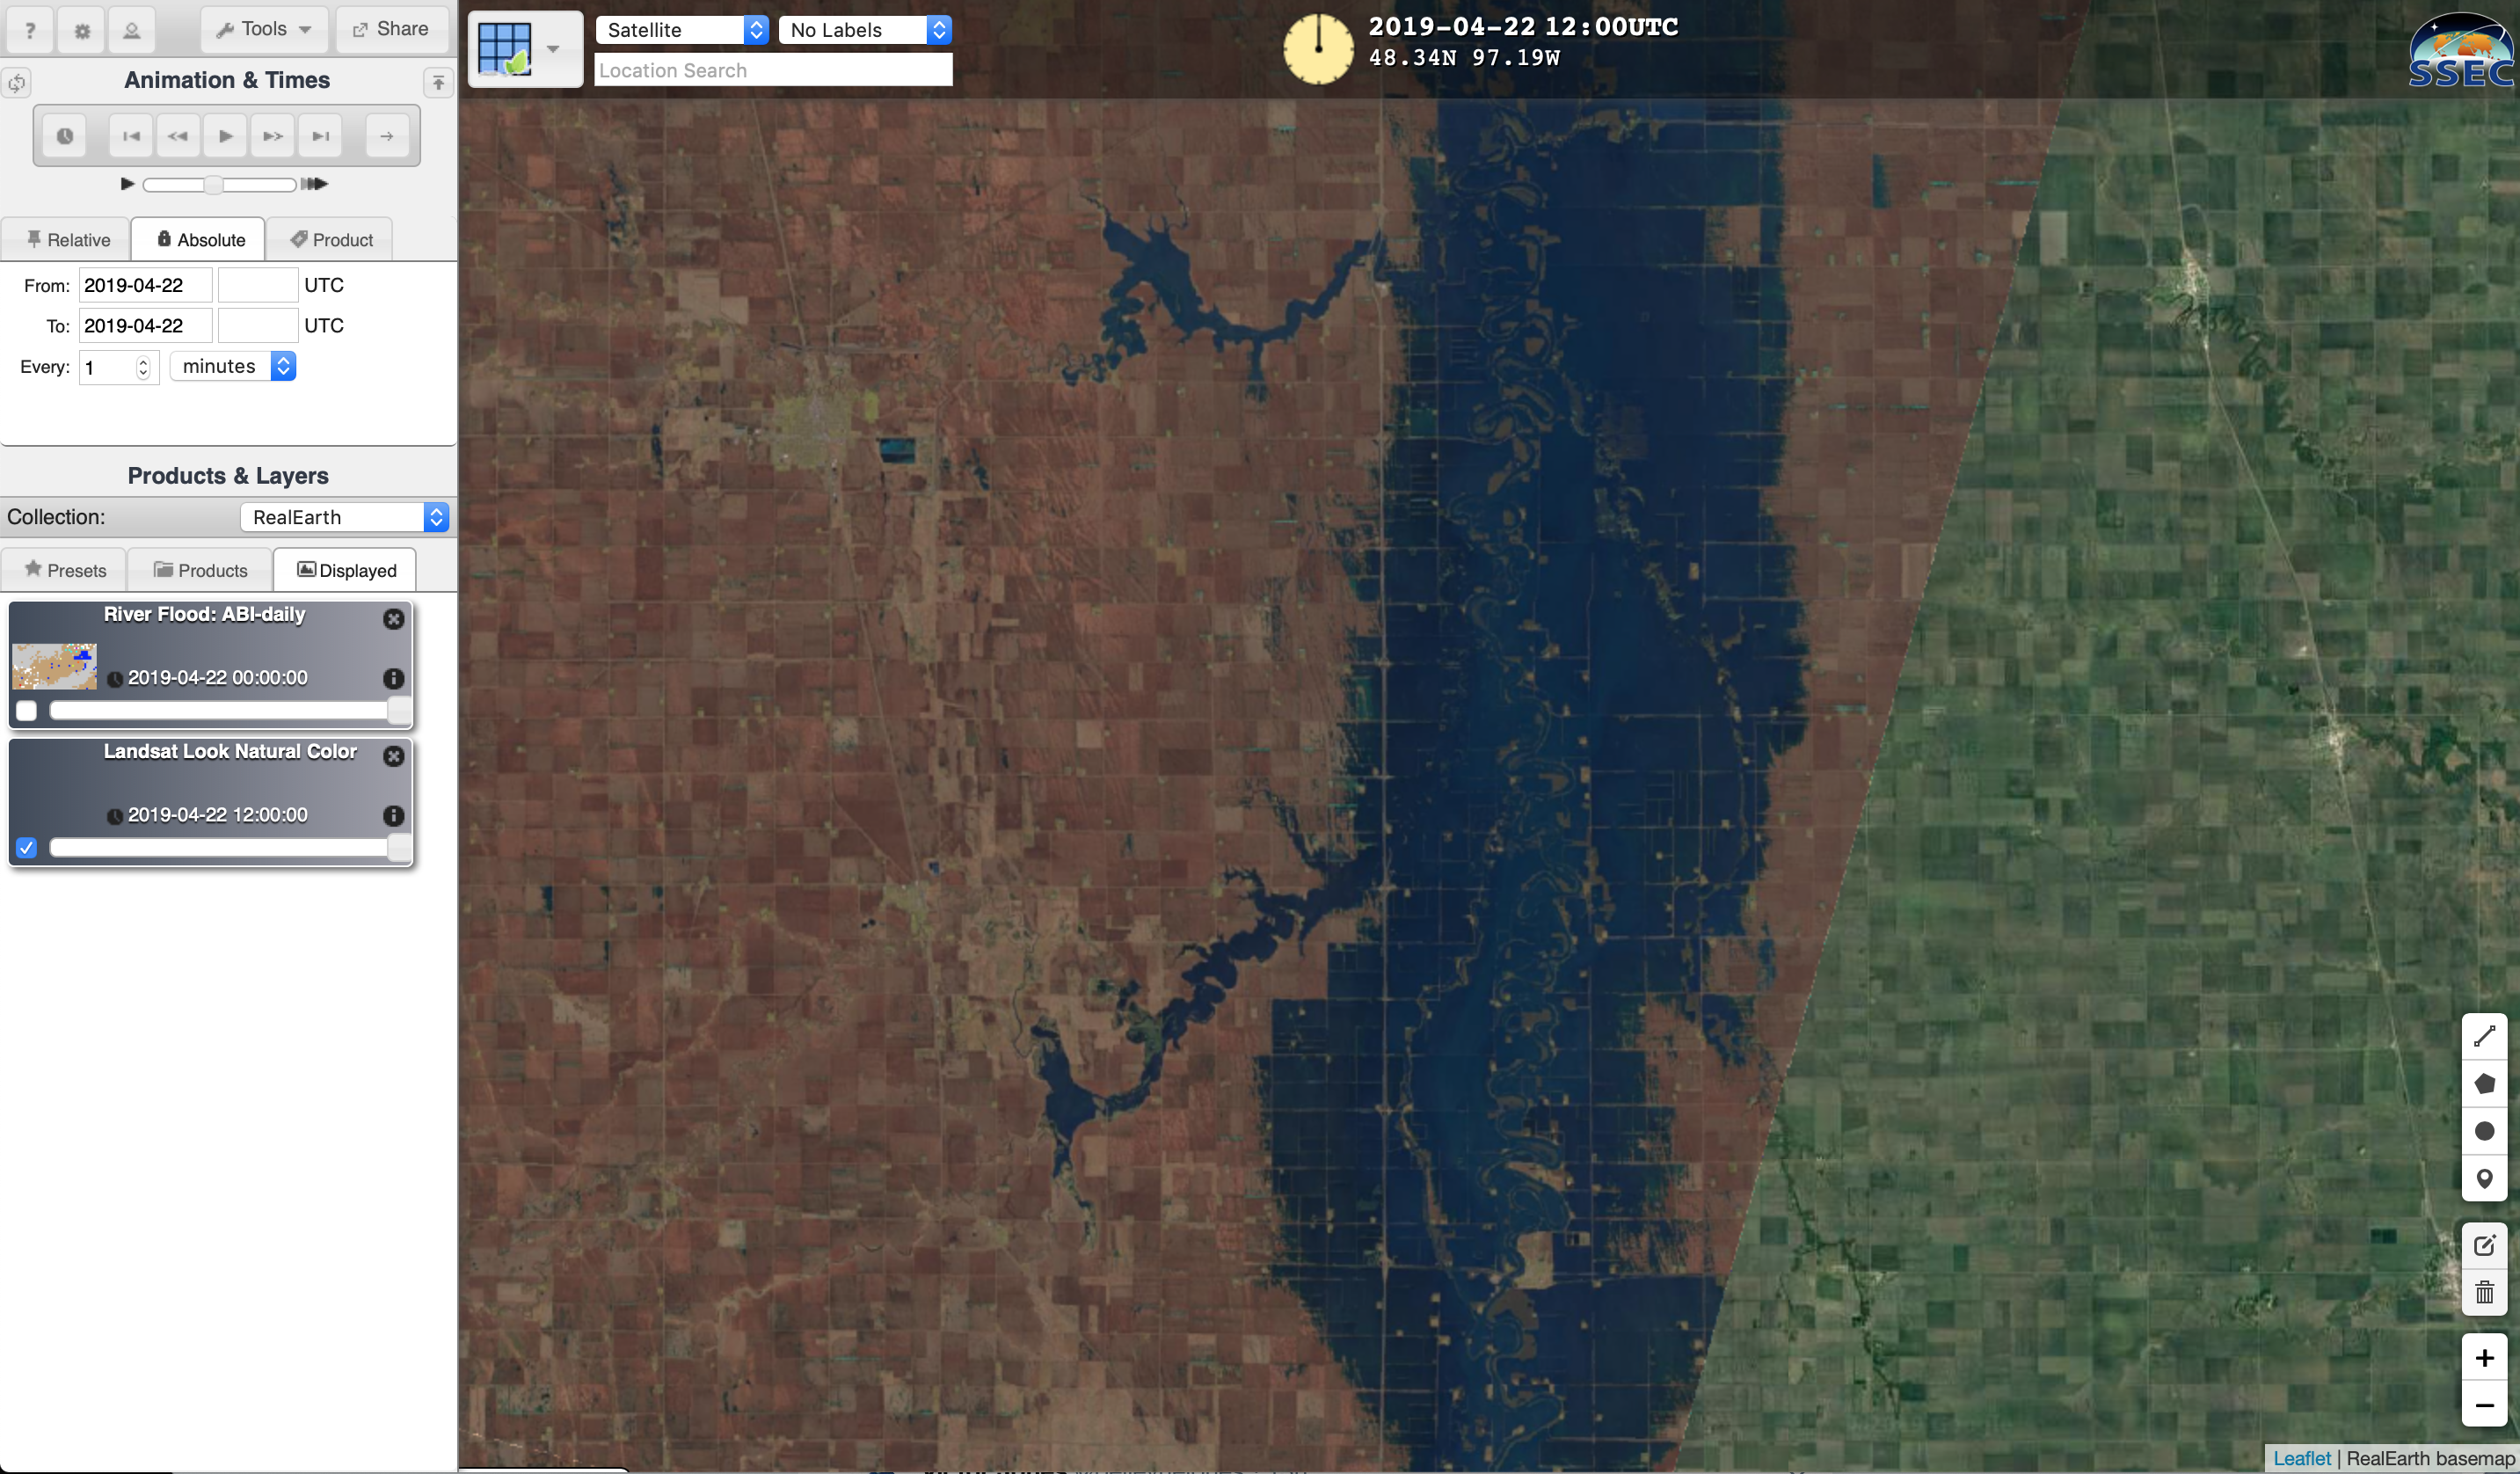
![Landsat-8 False Color RGB image and GOES-16 Flood Detection product [click to enlarge]](https://cimss.ssec.wisc.edu/satellite-blog/wp-content/uploads/sites/5/2019/04/190422_landsat8_falsecolor_goes16_riverflood_ND_anim.gif)
![Google Maps background, Landsat-8 False Color RGB image and GOES-16 Flood Detection product [click to enlarge]](https://cimss.ssec.wisc.edu/satellite-blog/wp-content/uploads/sites/5/2019/04/190422_landsat8_falsecolor_goes16_riverflood_Red_River_ND_anim.gif)
![Google Maps background, Landsat-8 False Color RGB image,and Suomi NPP VIIRS + GOES-16 Flood Detection products [click to enlarge]](https://cimss.ssec.wisc.edu/satellite-blog/wp-content/uploads/sites/5/2019/04/190422_landsat8_falsecolor_viirs_goes16_riverflood_SD_anim.gif)
![GOES-16 Low-level (7.3 µm, left) and Mid-level (6.9 µm, right) Water Vapor images [click to play animation | MP4]](https://cimss.ssec.wisc.edu/satellite-blog/wp-content/uploads/sites/5/2019/04/190420_goes16_waterVapor_Chicago_anim.gif)
![GOES-16 Low-level (7.3 µm) and Mid-level (6.9 µm) Water Vapor images [click to play animation | MP4]](https://cimss.ssec.wisc.edu/satellite-blog/wp-content/uploads/sites/5/2019/04/190420_goes16_waterVapor_Chicago_v2_anim.gif)
