Potential Vorticity anomaly over the East Pacific Ocean
![GOES-17 Air Mass RGB images [click to play animation | MP4]](https://cimss.ssec.wisc.edu/satellite-blog/wp-content/uploads/sites/5/2019/01/190129_goes17_airmassRGB_anim.gif)
GOES-17 Air Mass RGB images [click to play animation | MP4]
* GOES-17 images shown here are preliminary and non-operational *
GOES-17 Air Mass RGB images from the AOS site (above) showed the characteristic signature of a Potential Vorticity (PV) anomaly over the East Pacific Ocean on 29 January 2019. A descending tropopause brought ozone-rich air from the stratosphere down to very low altitudes — and this ozone-rich air was highlighted by deeper shades of red (the Air Mass RGB uses the 9.6 µm Ozone band to calculate the Green component). A Gale Force low became better organized beneath this PV anomaly, quickly reaching it’s occluded stage (surface analyses).
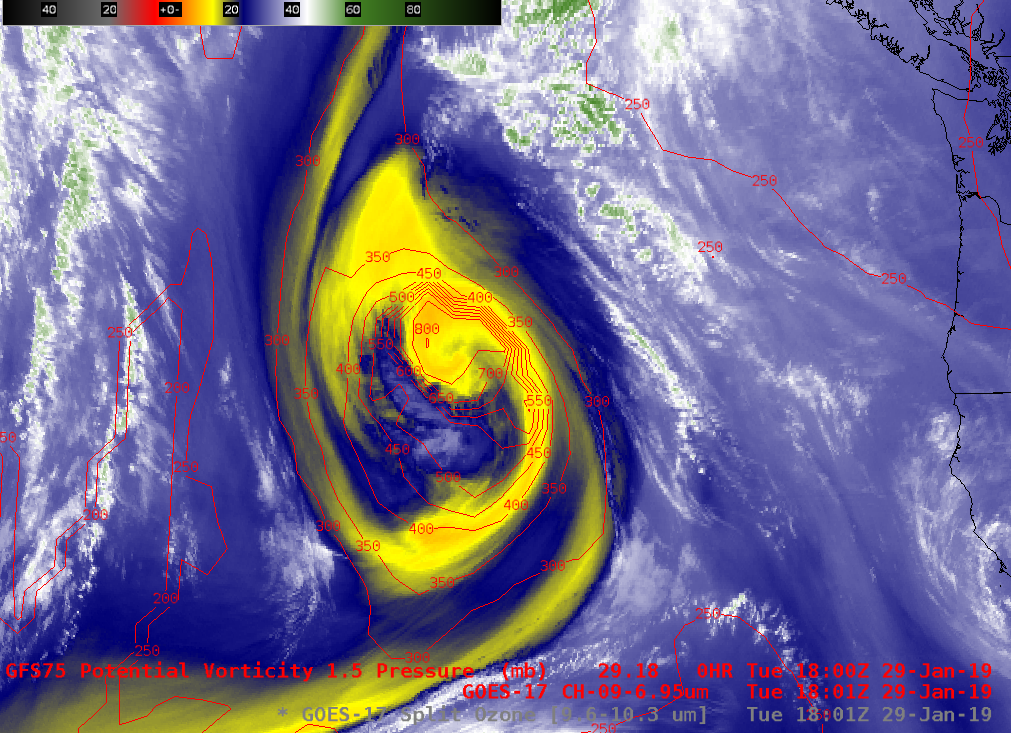
The deepening midlatitude cyclone also exhibited a vivid signature on GOES-17 Mid-level Water Vapor (6.9 µm) imagery (below). An overlay of the GFS75 model PV1.5 pressure — a parameter commonly used to diagnose the level of the “dynamic tropopause” — showed values as low as 800 hPa at 18 UTC.
![GOES-17 Mid-level Water Vapor (6.9 µm) images, with and without contours of GFS75 model PV1.5 pressure [click to play animation | MP4]](https://cimss.ssec.wisc.edu/satellite-blog/wp-content/uploads/sites/5/2019/01/190129_goes17_waterVapor_pv1.5pressure_EPAC_anim.gif)
GOES-17 Mid-level Water Vapor (6.9 µm) images, with and without contours of GFS75 model PV1.5 pressure [click to play animation | MP4]