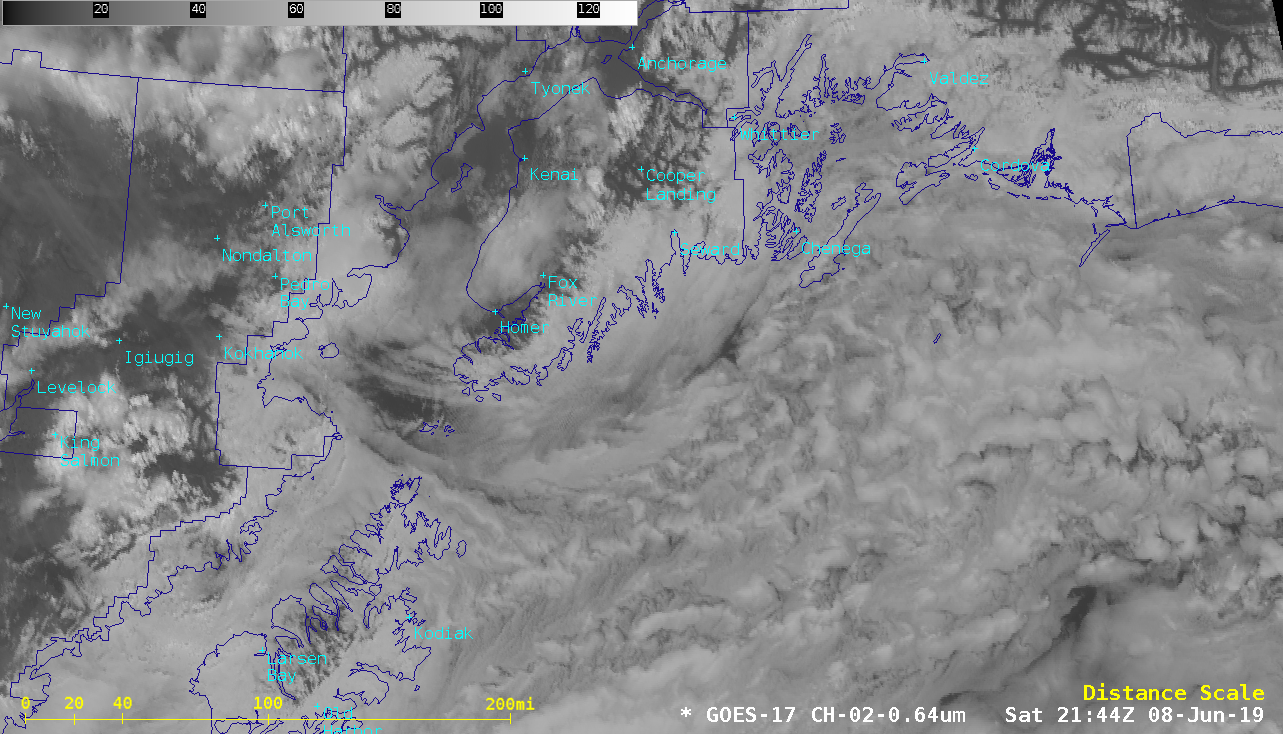
1-minute Mesoscale Domain Sector GOES-17 (GOES-West) “Red” Visible (0.64 µm) images (above) showed a fast-moving jet of marine layer stratus moving westward from the Seward-Chenega area into the far southern Cook Inlet in south-central Alaska on 08 June 2019. A narrow finger of the marine stratus penetrated farther inland across the lower elevations of... Read More

GOES-17 “Red” Visible (0.64 µm) images [click to play animation | MP4]
1-minute
Mesoscale Domain Sector GOES-17
(GOES-West) “Red” Visible (
0.64 µm) images
(above) showed a fast-moving jet of marine layer stratus moving westward from the Seward-Chenega area into the far southern
Cook Inlet in south-central Alaska on 08 June 2019. A narrow finger of the marine stratus penetrated farther inland across the lower elevations of Iliamna Lake (which is located between Pedro Bay and Kokhanok). Note that at 2245 UTC the GOES-17 Mesoscale Sector was shifted southward, to better monitor a Gulf of Alaska storm.
This inland intrusion of marine stratus was driven by the presence of a warm thermal trough across Interior and Southwest Alaska (surface analyses) — animations of 10-minute GOES-17 Full Disk visible imagery (below) included hourly plots of surface wind barbs and air temperature. Note that some sites farther inland across southwestern Alaska had temperatures in the upper 60s to low 70s F.
![GOES-17 "Red" Visible (0.64 µm) images [click to play animation | MP4]](https://cimss.ssec.wisc.edu/satellite-blog/wp-content/uploads/sites/5/2019/06/G17_VIS_AK_08JUN2019_2019159_200034_GOES-17_0001PANEL.GIF)
GOES-17 “Red” Visible (0.64 µm) images, with hourly surface wind barbs plotted in cyan and temperatures plotted in yellow [click to play animation | MP4]
At Iliamna Airport — located along the northern edge of Lake Iliamna — southeasterly winds gusted to 22 knots at 01 and 03 UTC
(below).
![Time series plot of surface reports from Iliamna Airport [click to enlarge]](https://cimss.ssec.wisc.edu/satellite-blog/wp-content/uploads/sites/5/2019/06/190608_PAIL_SFCMG.GIF)
Time series plot of surface reports from Iliamna Airport [click to enlarge]
A similar type of thermally-driven phenomenon is sometimes observed in the San Francisco Bay area, as shown
here and
here.
View only this post
Read Less

![GOES-16 "Clean" Infrared Window (10.35 µm) images, with SPC Storm Reports plotted in cyan [click to play MP4 animation | 159 MB animated GIF]](https://cimss.ssec.wisc.edu/satellite-blog/wp-content/uploads/sites/5/2019/06/G16_IR_NE_SVR_08JUN2019_2019159_222654_GOES-16_0001PANEL.GIF)
![GOES-17 "Red" Visible (0.64 µm) images [click to play animation | MP4]](https://cimss.ssec.wisc.edu/satellite-blog/wp-content/uploads/sites/5/2019/06/190608_goes17_visible_AK_v2_anim.gif)
![GOES-16 “Red” Visible (0.64 µm) images, with hourly surface wind barbs plotted in cyan, temperatures plotted in yellow and SPC Storm Reports plotted in red [click to play animation | MP4]](https://cimss.ssec.wisc.edu/satellite-blog/wp-content/uploads/sites/5/2019/06/190605_goes16_visible_Lake_Michigan_anim.gif)
![Time series plot of surface reports from Milwaukee Mitchell International Airport [click to enlarge]](https://cimss.ssec.wisc.edu/satellite-blog/wp-content/uploads/sites/5/2019/06/190605_KMKE_SFCMG.GIF)
![Time series plot of surface reports from Racine Batten International Airport [click to enlarge]](https://cimss.ssec.wisc.edu/satellite-blog/wp-content/uploads/sites/5/2019/06/190605_KRAC_SFCMG.GIF)
![GOES-16 “Red” Visible (0.64 µm) images, with hourly surface wind barbs plotted in cyan [click to play animation | MP4]](https://cimss.ssec.wisc.edu/satellite-blog/wp-content/uploads/sites/5/2019/06/190605_goes16_visible_surfaceWinds_TX_anim.gif)
![850 hPa Relative Vorticity product, from 00 UTC on 02 June to 00 UTC on 06 June 2019 [click to play animation]](https://cimss.ssec.wisc.edu/satellite-blog/wp-content/uploads/sites/5/2019/06/190602_190605_850hPaRelativeVorticity_Invest91L_anim.gif)
