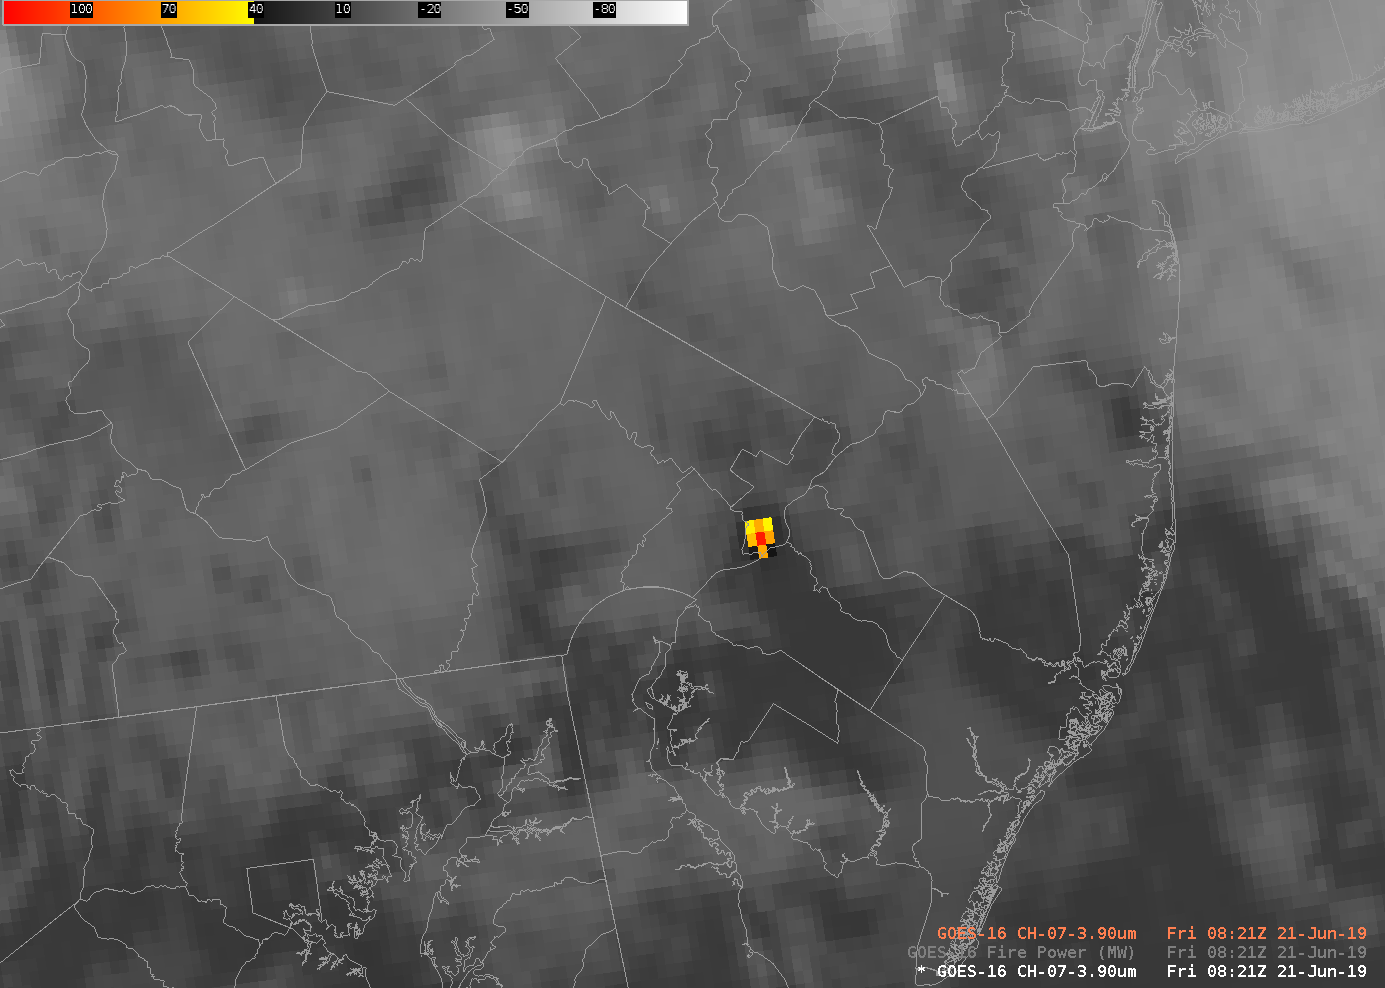
GOES-16 Shortwave Infrared imagery (3.9 µm) from the CONUS sector (orange label) and Mesoscale sector (white label) scans over Philadelphia at the nominal time of 0821 UTC on 21 June 2019 (Click to enlarge)
An earth-shaking refinery explosion (News story 1, 2) occurred in Philadelphia, PA under variably cloudy skies on Friday morning 21 June 2019. The toggle above shows GOES-16 3.9 µm Shortwave Infrared imagery from the mesoscale sector (with 1-minute imagery) and from the CONUS sector (with 5-minute imagery) at similar nominal times, 0821 UTC. There is a noticeable difference between the character of the signal in the mesoscale sector and the CONUS sector. This chart shows that a CONUS sector scan (shown in Blue at that link for Mode 6A that applies to GOES-16) occurs over a span of time from either 76 seconds to 233 seconds, or from 376 seconds to 533 seconds every 10 minutes (600 seconds). The nominal time of the image will be when the scan starts. Thus, the CONUS time at 08:21 UTC — that shows a very hot spot — is scanning over Philadelphia at some time in the following 2+ minutes after the scan start time (08:21:54). The Meso scale time of 08:21 UTC is scanning Philadelphia at very close to 08:21:05 UTC.
The mesoscale sector from 0820 to 0826 UTC shows no scene quite so hot as the CONUS sector. The warmest brightness temperature from the mesoscale sector, 51.5 C, occurs in the 0823 UTC image. This contrasts with the warmest brightness temperature of 118.2 C in the CONUS sector! This suggests an ephemeral explosion or rapidly-changing cloud cover that frequently masked the view (or both!). The GOES-16 CONUS sector scanned just at the right time; the Mesoscale sector, even with higher temporal resolution, did not see the worst of the explosion.

GOES-16 Shortwave Infrared imagery (3.9 µm) from the a Mesoscale sector (white label) over Philadelphia from 0821 to 0826 UTC on 21 June 2019 (Click to enlarge)
Toggles between the CONUS image at 0821 and the mesoscale sectors at 0822 UTC and at 0823 UTC suggest that GOES-16 CONUS sector scanned Philadelphia shortly after 0822 UTC. The shift between the CONUS and mesoscale sectors is in opposite directions at the two times. (Note that Philadelphia County is outlined in both of those linked-to toggles.)
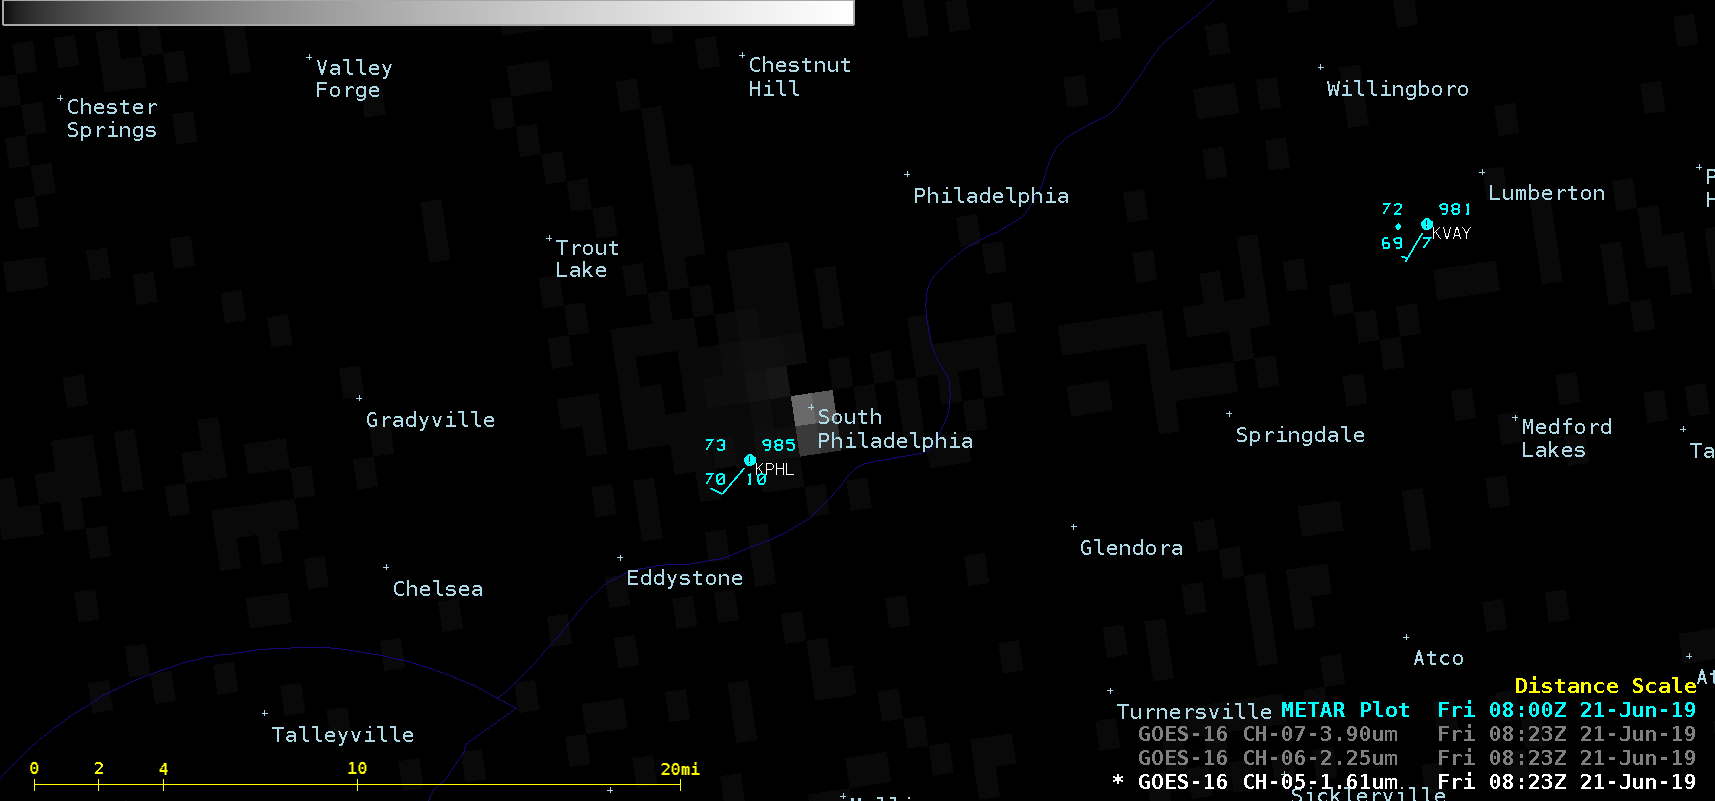
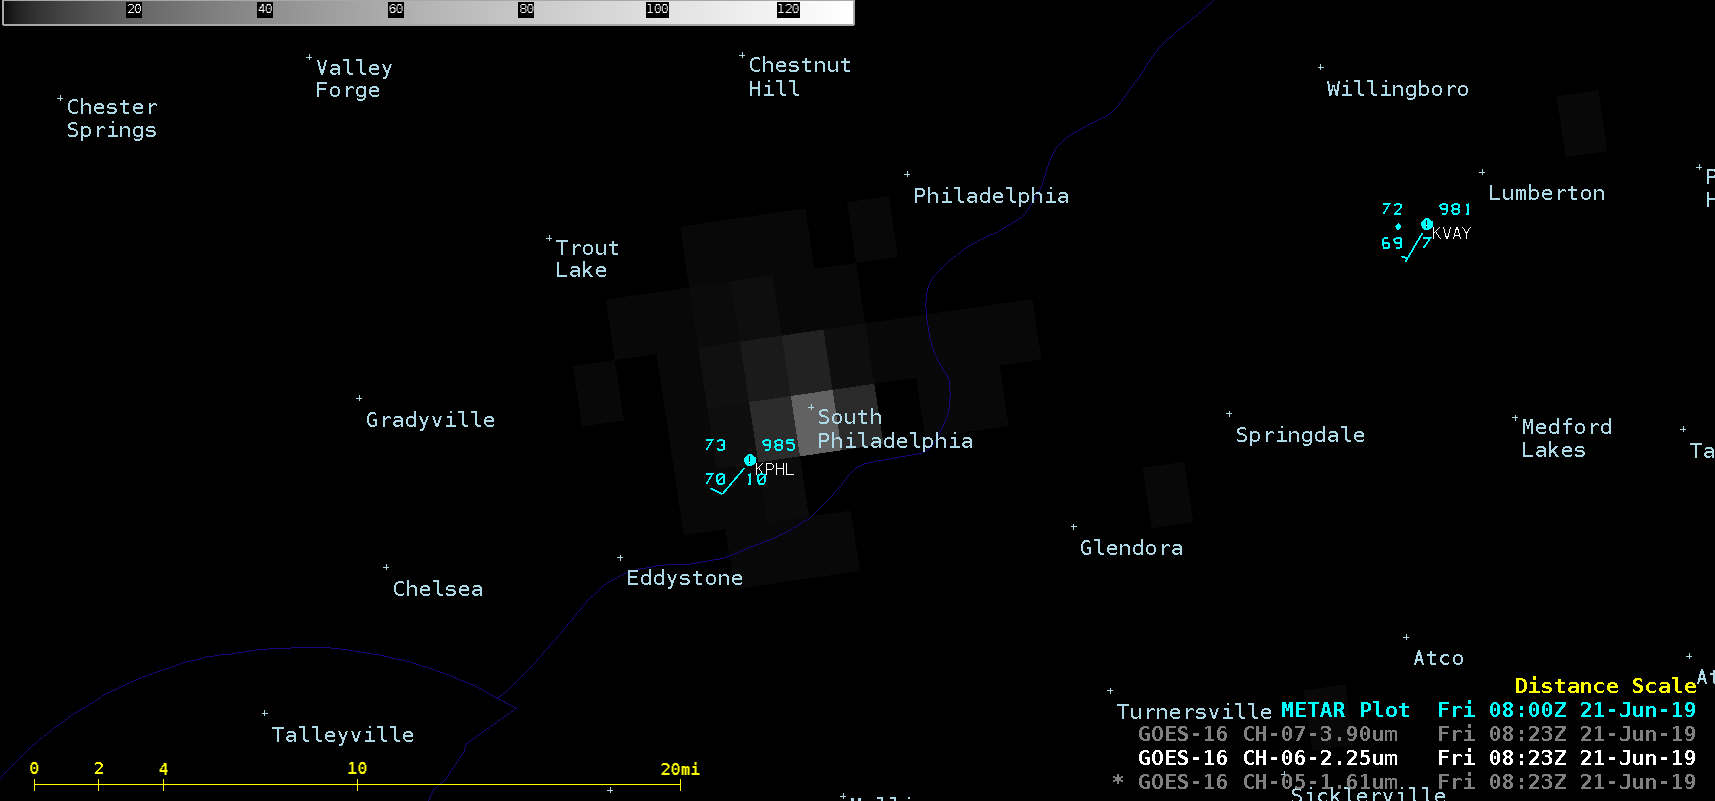
As has been observed with other similar events (for example, here, here and here), a closer look at the area showed that a nighttime thermal signature of the fire was also evident in GOES-16 Near-Infrared 1.61 µm and 2.24 µm imagery (below).
![GOES-16 Near-Infrared (1.61 µm and 2.24 µm) and Shortwave Infrared (3.9 µm) images [click to play animation | MP4]](https://cimss.ssec.wisc.edu/satellite-blog/wp-content/uploads/sites/5/2019/06/190621_goes16_nearInfrared_shortwaveInfrared_Philadelphia_refinery_fire_anim.gif)
GOES-16 Near-Infrared (1.61 µm and 2.24 µm) and Shortwave Infrared (3.9 µm) images [click to play animation | MP4]
View only this post Read Less


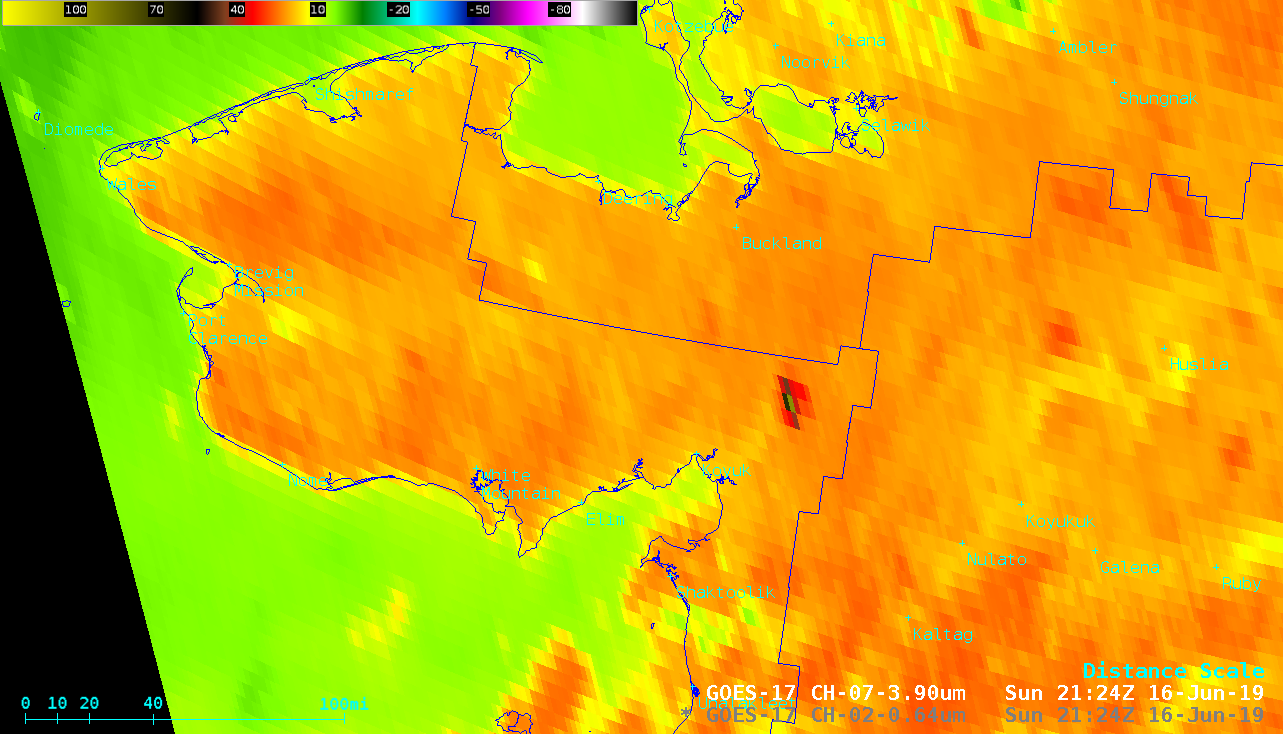
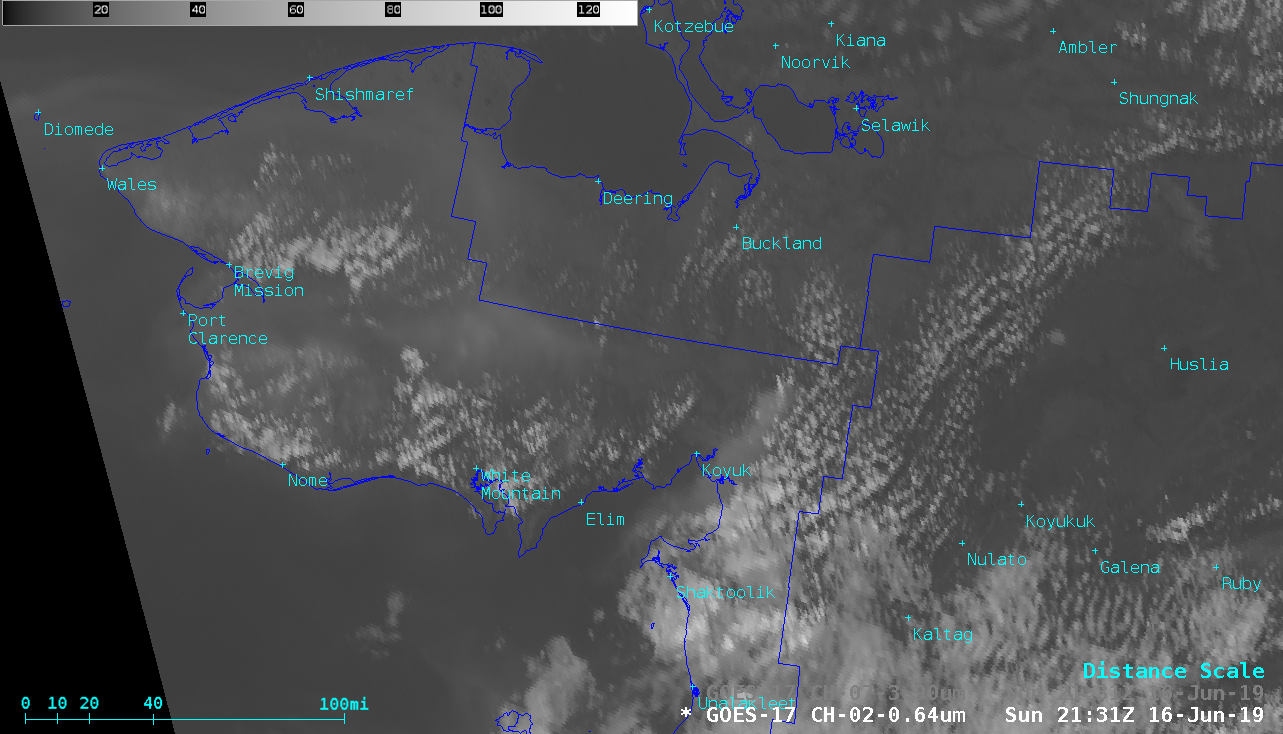
![Suomi NPP VIIRS Shortwave Infrared (3.74 µm) and Visible (0.64 µm) images, with surface observations plotted in yellow [click to enlarge]](https://cimss.ssec.wisc.edu/satellite-blog/wp-content/uploads/sites/5/2019/06/190616_suomiNPP_viirs_shortwaveInfrared_visible_AK_wildfire_anim.gif)
![Time series plot of surface observation data from Unalakeet [click to enlarge]](https://cimss.ssec.wisc.edu/satellite-blog/wp-content/uploads/sites/5/2019/06/190616_PAUN_SFCMG.GIF)
![Time series plot of surface observation data from St. Michael [click to enlarge]](https://cimss.ssec.wisc.edu/satellite-blog/wp-content/uploads/sites/5/2019/06/190616_PAMK_SFCMG.GIF)
![NOAA-20 VIIRS True Color RGB and Infrared Window (11.45 µm) images [click to enlarge]](https://cimss.ssec.wisc.edu/satellite-blog/wp-content/uploads/sites/5/2019/06/190616_15utc_noaa20_viirs_trueColor_infraredWindow_AK_wildfire_smoke_anim.gif)
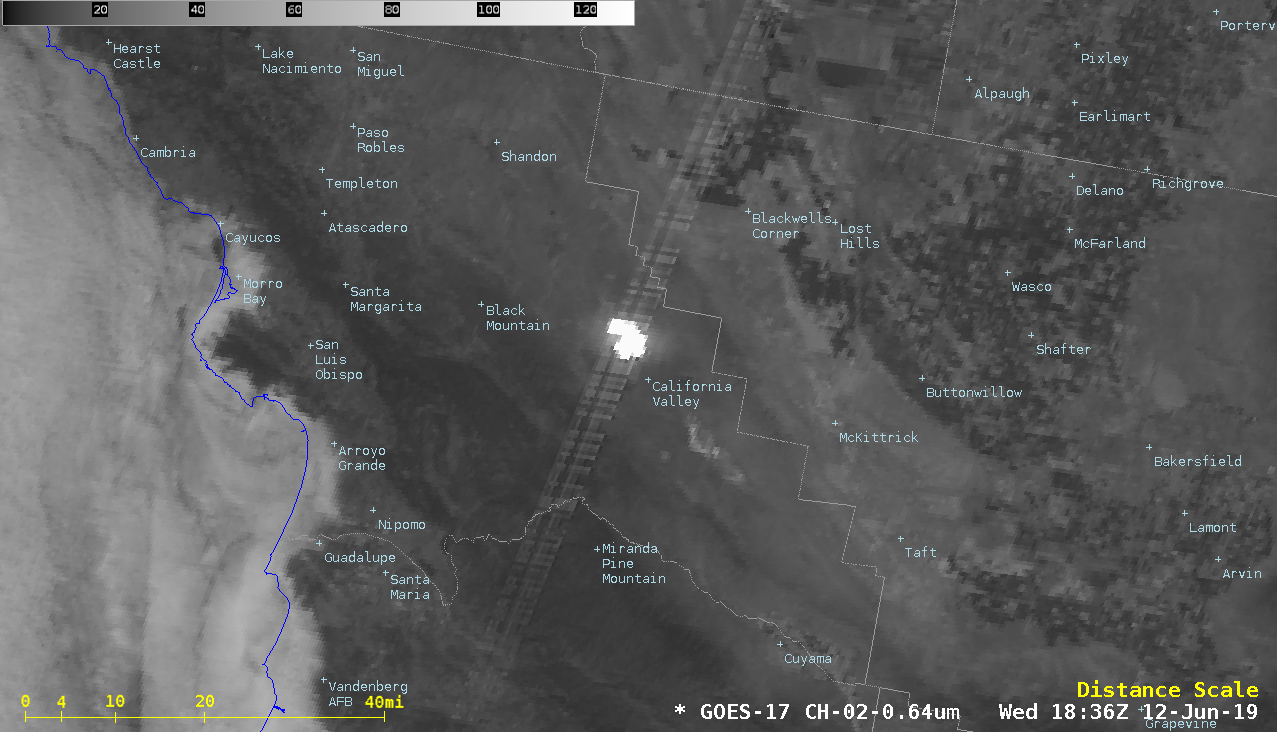

![GOES-17 "Red" Visible (0.64 µm) images [click to play animation | MP4]](https://cimss.ssec.wisc.edu/satellite-blog/wp-content/uploads/sites/5/2019/06/190612_goes17_visible_mcidas_CA_solar_farm_anim.gif)
![Multi-panel images of all 16 ABI bands of GOES-17 [click to play animation | MP4]](https://cimss.ssec.wisc.edu/satellite-blog/wp-content/uploads/sites/5/2019/06/190612_goes17_16panel_CA_solar_farm_anim.gif)
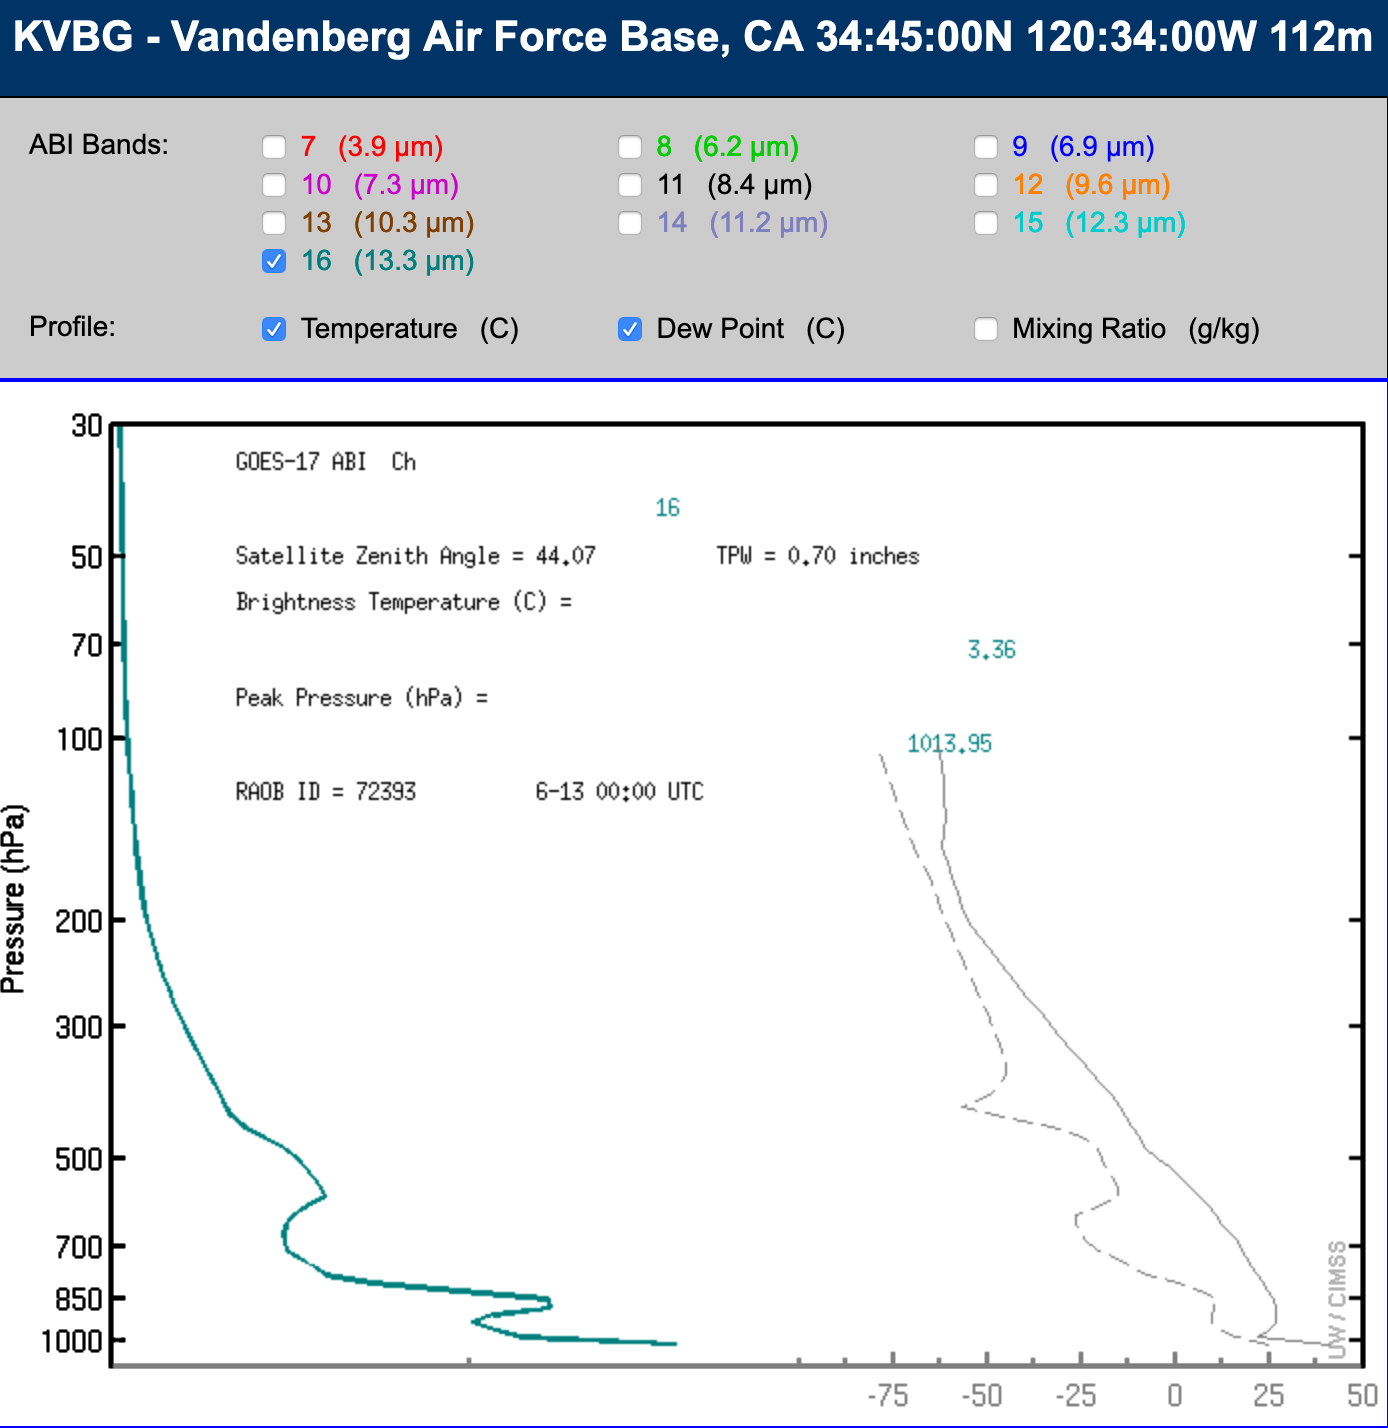
![Infrared and Water Vapor weighting functions calculated using rawinsonde data from Vandenberg CA at 00 T on 13 June [click to enlarge]](https://cimss.ssec.wisc.edu/satellite-blog/wp-content/uploads/sites/5/2019/06/190613_00utc_kvbg_infrared_waterVapor_weightingFunctions_anim.gif)
![Multi-panel images of all 16 ABI bands of GOES-17 [click to play animation | MP4]](https://cimss.ssec.wisc.edu/satellite-blog/wp-content/uploads/sites/5/2019/06/190607_goes17_16panel_CA_solar_farm_anim.gif)
![GOES-17 Mid-leve Water Vapor (6.9 µm, top) and GOES-15 Water Vapor (6.5 µm. bottom) imagess [click to play animation | MP4]](https://cimss.ssec.wisc.edu/satellite-blog/wp-content/uploads/sites/5/2019/06/190611_goes17_goes15_waterVapor_Arctic_anim.gif)
![6-hourly GFS 500 hPa geopotential height, wind, and standardized height anomaly [click to enlarge]](https://cimss.ssec.wisc.edu/satellite-blog/wp-content/uploads/sites/5/2019/06/190611_190612_500hPa_height_anomaly_anim.gif)
