Solar heating of the ABI instruments (on both GOES-16 and GOES-17) occurs at night around the Equinoxes. As the ABI points down to the Earth to observe the atmosphere and surface, sunlight falls on the ABI, warming it, and the Loop Heat Pipe that is not operating at capacity on... Read More
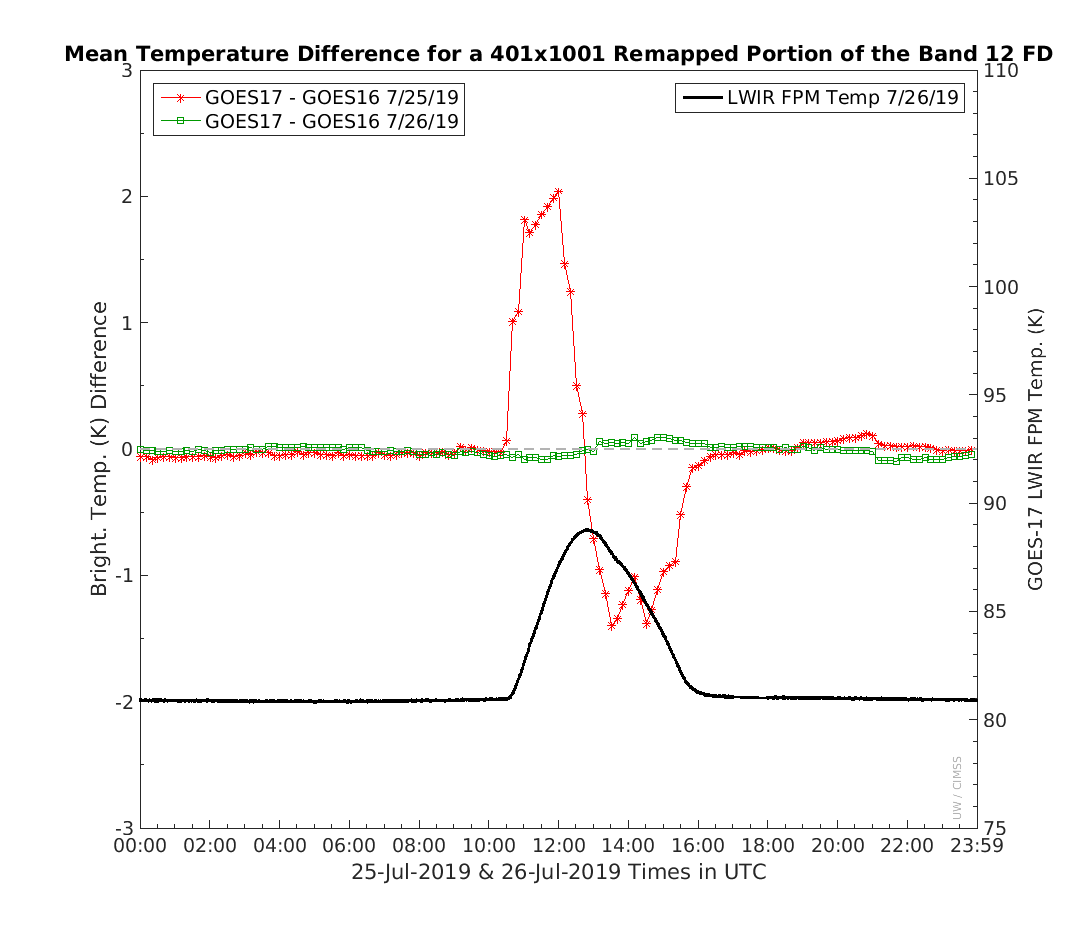
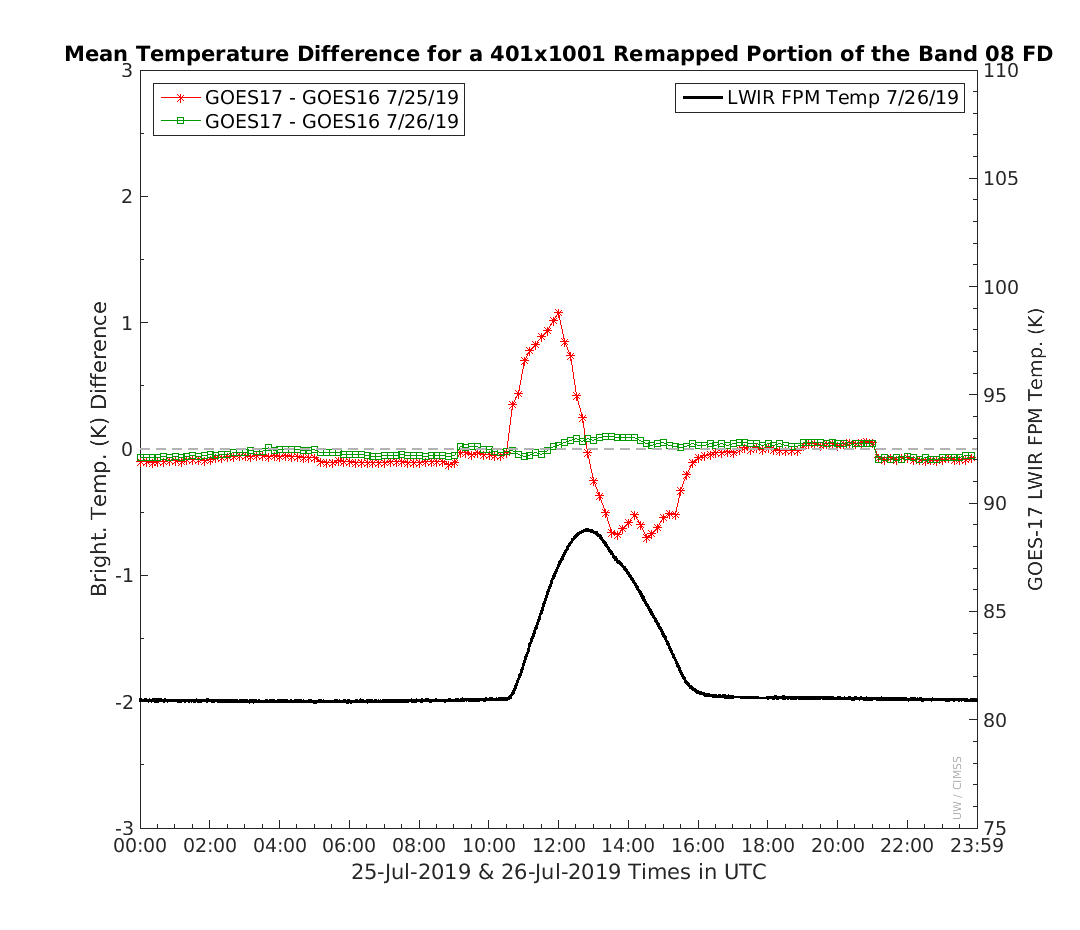
Mean GOES17 – GOES16 Brightness Temperature Difference for a 401×1001 pixel footprint centered on the Equator halfway between the GOES-West and GOES-East subsatellite points. On 25 July (Red line), before Predictive Calibration was implemented, GOES-17 showed a warm bias as the Focal Plane Temperature (shown in black) increased, and a cold bias as Focal Plane Temperature decreased. On 26 July (green line), after predictive calibration was implemented, the large positive and negative biases are gone. (Click figure to enlarge)
Solar heating of the ABI instruments (on both GOES-16 and GOES-17) occurs at night around the Equinoxes. As the ABI points down to the Earth to observe the atmosphere and surface, sunlight falls on the ABI, warming it, and the Loop Heat Pipe that is not operating at capacity on GOES-17 does not circulate enough heat to radiators for dissipation to space. So, the temperature of the ABI increases during part of the night, reaches a maximum, and then decreases (as the solar illumination of the ABI decreases).
The change in temperature means that calibration looks at the Internal Calibration Target (ICT) within the ABI that occur regularly will quickly become invalid because of the changing temperature of the ABI. The images below show the temperature of the Focal Plane within the GOES-17 ABI in mid-June, in mid-July and in late July. For the best calibration, the focal plane temperatures would be steady. They are not. Note that the y-axis values are different in the plots. More significant warming is present in the latest plot and those peak values will steadily increase until Eclipse Season starts in late August. This blog post shows the effects of the warming in mid-April of this year. Predictive Calibration accounts for the change in the temperatures in between calibration looks and was implemented in the GOES-17 Ground Station at 1721 UTC on 25 July 2019. The beneficial effects of Predictive Calibration are shown in the figure (courtesy Mat Gunshor, CIMSS) above for ABI band 12; large warm and cold biases have been mitigated. ABI band 8 (6.2 µm) shows similar improvements.
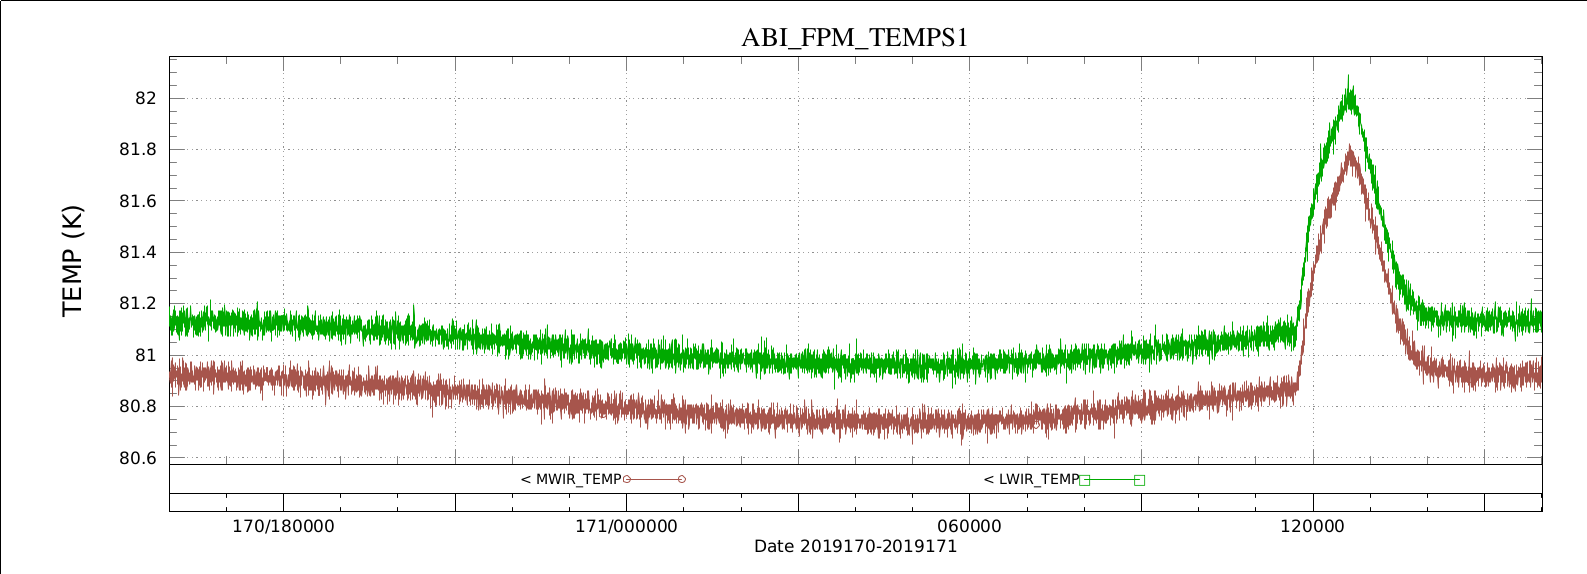
Focal Plane Temperature as measured on the ABI on 19/20 June 2019, times as indicated. Note the baseline value near 81 K for both mid-wave infrared (MWIR, 3.9 µm – 8.4 µm) in red brown and long-wave IR (LWIR 9.6 µm to 13.2 µm) in green that increases to around 82 K around 1300 UTC
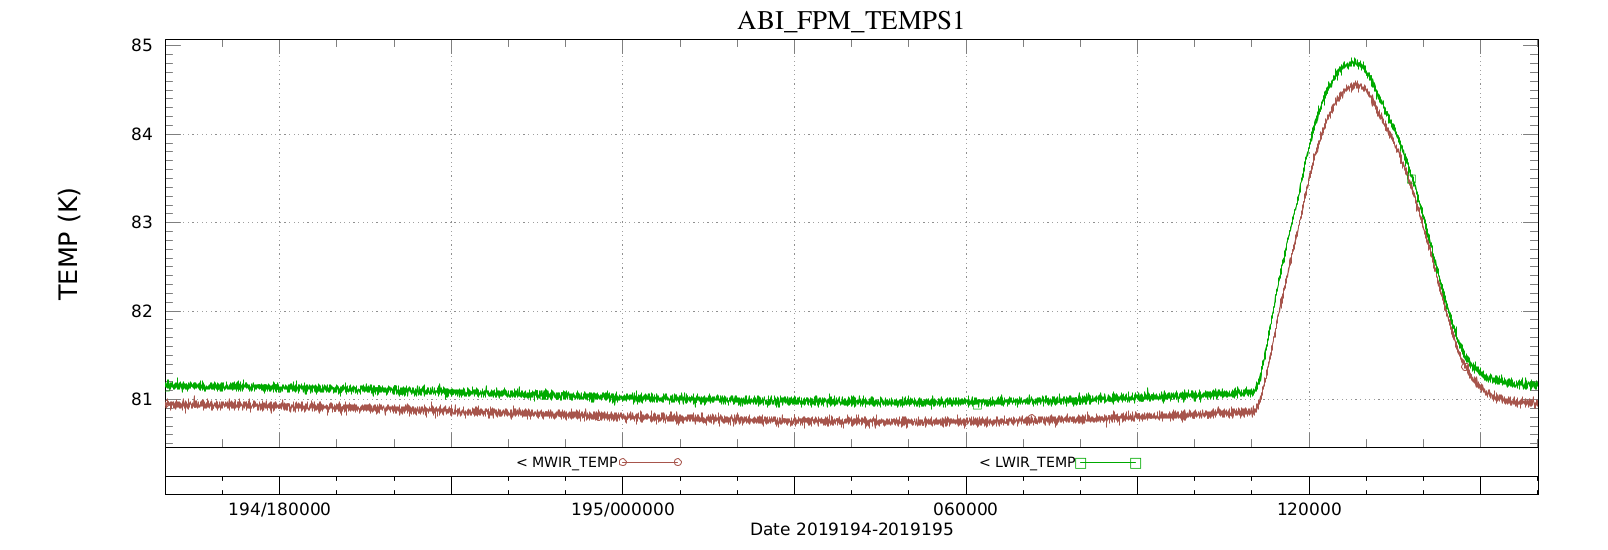
Focal Plane Temperature as measured on the ABI on 13/14 June 2019, times as indicated. Note the baseline value near 81 K for both mid-wave infrared (MWIR, 3.9 µm – 8.4 µm) in red brown and long-wave IR (LWIR 9.6 µm to 13.2 µm) in green that increases to around 84.5 K around 1300 UTC
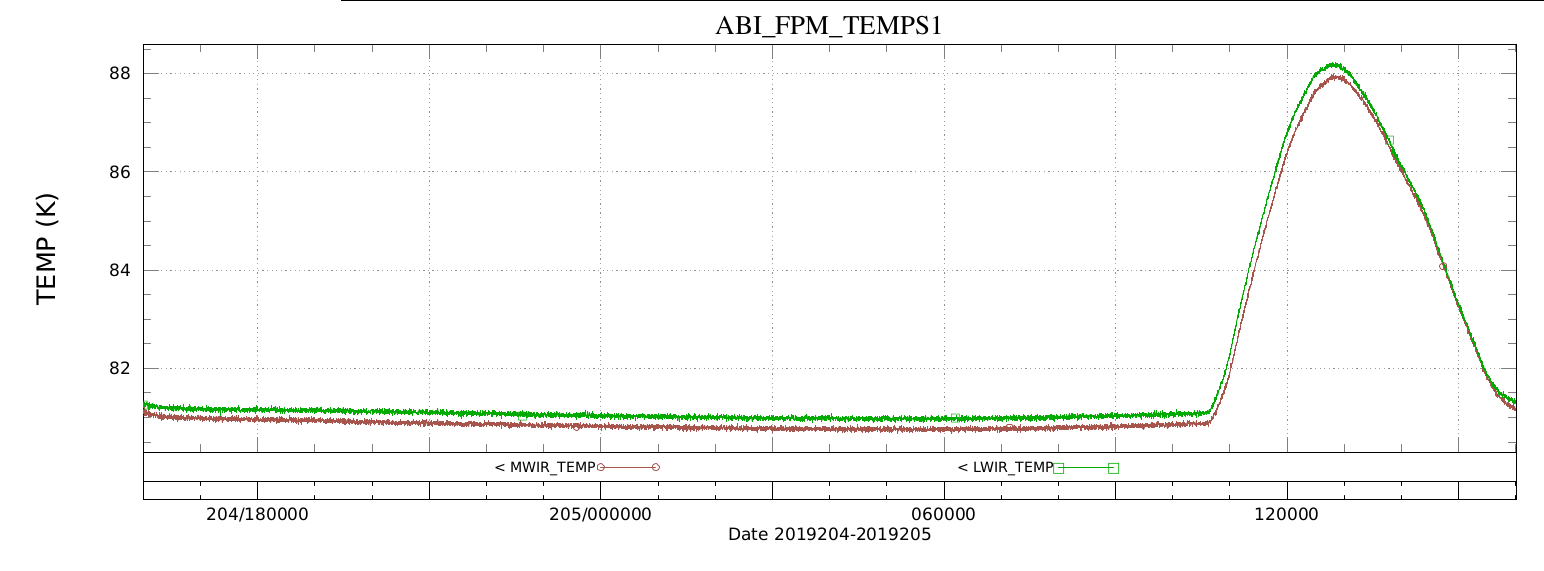
Focal Plane Temperature as measured on the ABI on 24/25 July 2019, times as indicated. Note the baseline value near 81 K for both mid-wave infrared (MWIR, 3.9 µm – 8.4 µm) in red brown and long-wave IR (LWIR 9.6 µm to 13.2 µm) in green that increases to around 88 K around 1300 UTC
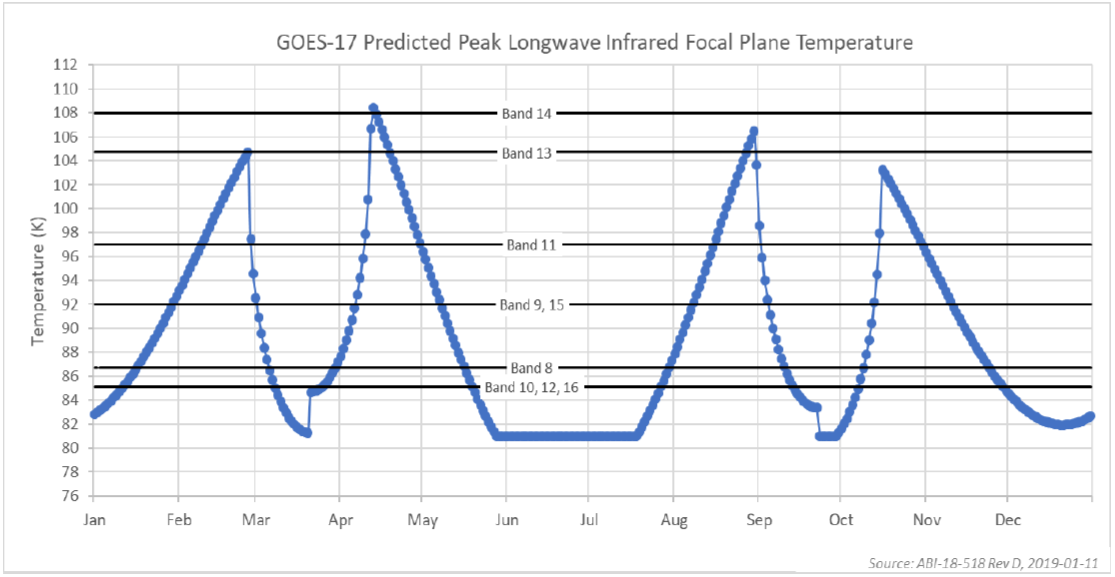
Warmest Predicted Focal Plane Temperature as a function of month. Also included: the threshold temperatures for each ABI band when the ABI output is noticeably affected by the warmer focal plane. The step in values near both Equinoxes occurs when a Yaw Flip is performed on the satellite (Click to enlarge)
The image above, (reproduced from this blog post and originally from here) shows the predicted focal plane maximum each day over the course of the year. It also shows at which temperature each band will marginally saturate, meaning that the effects of the warming ABI start to become noticeable.
The animation below shows the GOES-17 ABI Band 12 ‘Ozone Band’ (at 9.6 µm) that, according to the figure above is one of the first (along with Bands 10 — 7.34 µm — and 16 — 13.3 µm) to show the effects of the warming focal plane. Brightness temperatures warm before 1300 UTC and cool after 1300 UTC, and the amount of noise/stripeyness in the imagery increases (This is most apparent at the northern edge of these 5-minute PACUS images). These are all manifestations of the warming and cooling focal plane temperatures.

GOES-17 ABI Band 12 imagery on 18 July 2019, 0826 to 1501 UTC (Click to animate)
One week later, on 25 July 2019, below, the effects of the heating because the Loop Heat Pipe and radiator are not working at capacity are even more evident. The imagery exhibits a warm bias before 1300 UTC and a cold bias after 1300 UTC and the stripeyness of the image increases. Predictive calibration will mitigate the warm and cold bias.
Comparisons between individual bands from GOES-16 and GOES-17 for Full Disk and CONUS/PACUS views (in both cases in regions between the subsatellite points to minimize the effects of view angle) are available at this link, or also through this link.
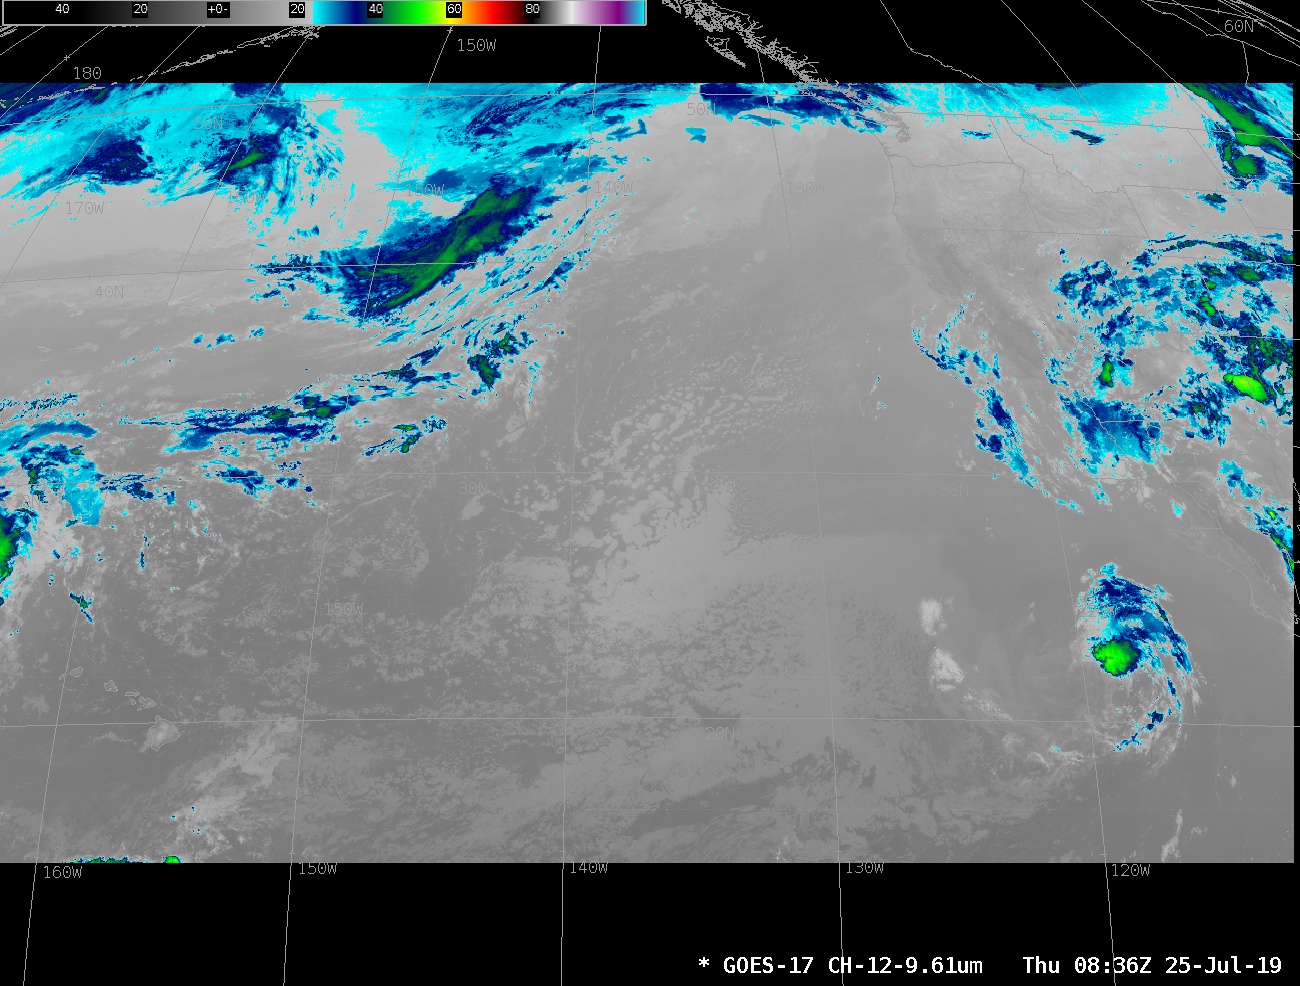
GOES-17 ABI Band 12 imagery on 25 July 2019, 0836 to 1511 UTC (Click to animate)
======== ADDED, After Predictive Calibration was turned on ============The animation below shows GOES-17 ABI Band 12 for the same time period as above, 0836-1511 UTC, but for the day after Predictive Calibration was implemented. You no longer see changes in observed brightness temperature that result from the warming focal plane temperatures. There is still some striping; this is associated with detector saturation and that striping will become more obvious in the next week and will lead to missing data. Predictive Calibration will not mitigate the issue of missing or striped data due to saturated sensors. Predictive Calibration is designed to mitigate warm biases before saturation, and cold biases after saturation.

GOES-17 ABI Band 12 imagery on 26 July 2019, 0836 to 1511 UTC (Click to animate)
The animation below (click to animate) shows both 25 July (left, before Predictive Calibration) and 26 July (right, after Predictive Calibration).
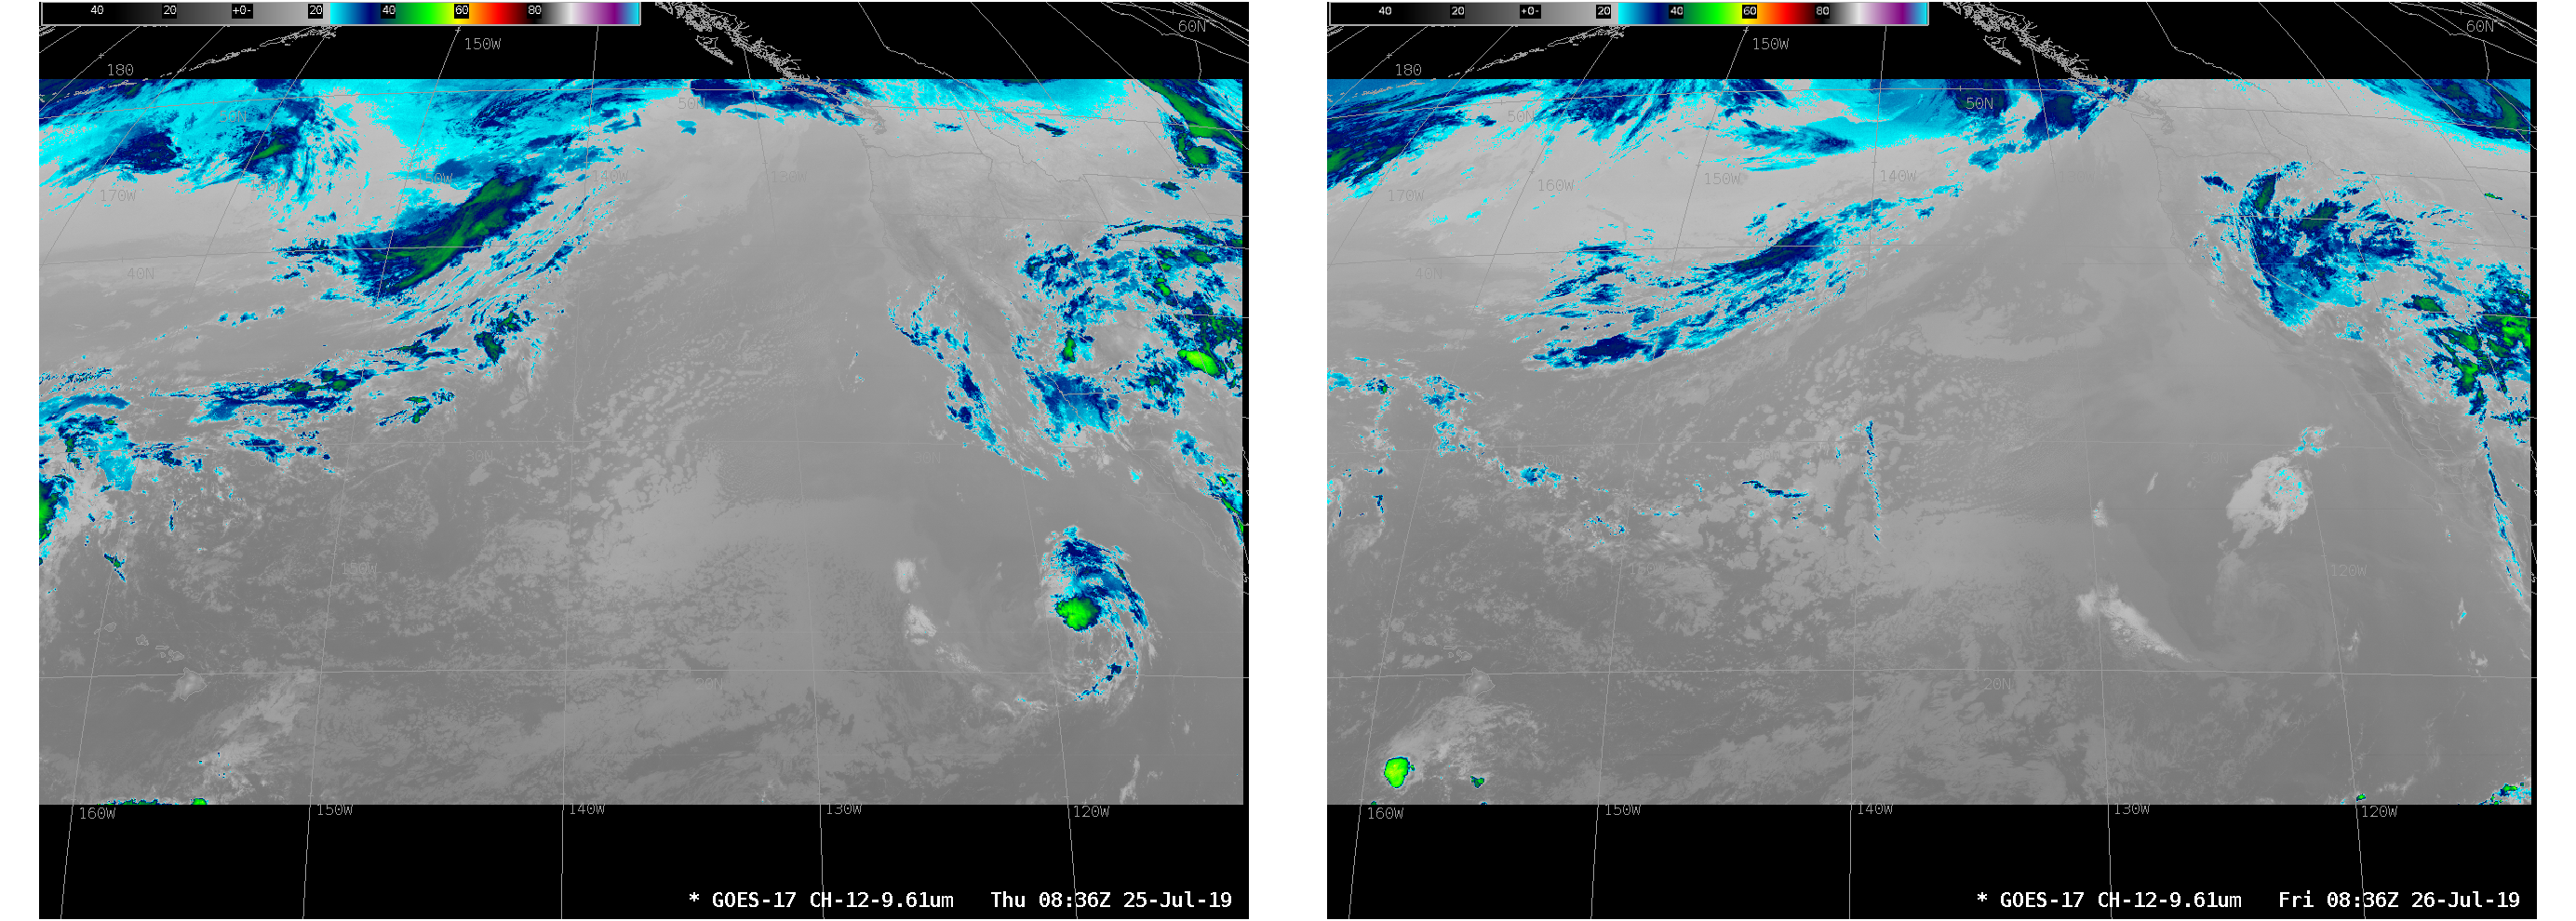
GOES-17 ABI Band 12 imagery from 0836 to 1511 UTC on 25 July 2019 (left, without predictive calibration) and on 26 July 2019 (right, with predictive calibration) (Click to play large animation)
You can view a short video on this topic here.
View only this post
Read Less
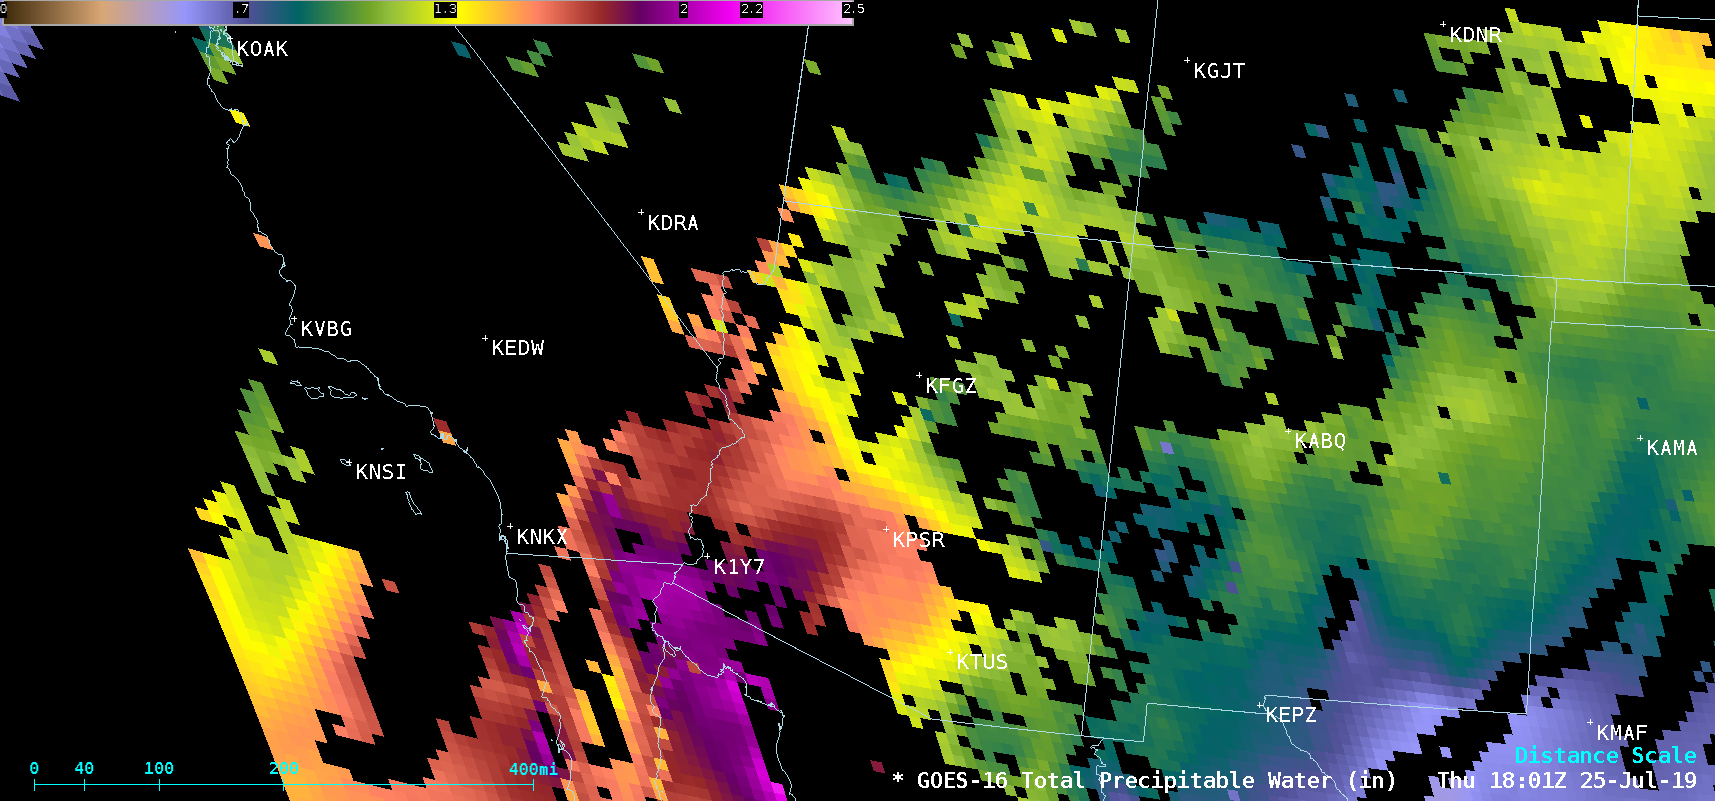
![GOES-16 Total Precipitable Water product [click to play animation | MP4]](https://cimss.ssec.wisc.edu/satellite-blog/wp-content/uploads/sites/5/2019/07/190725_goes16_tpw_Southwest_US_anim.gif)
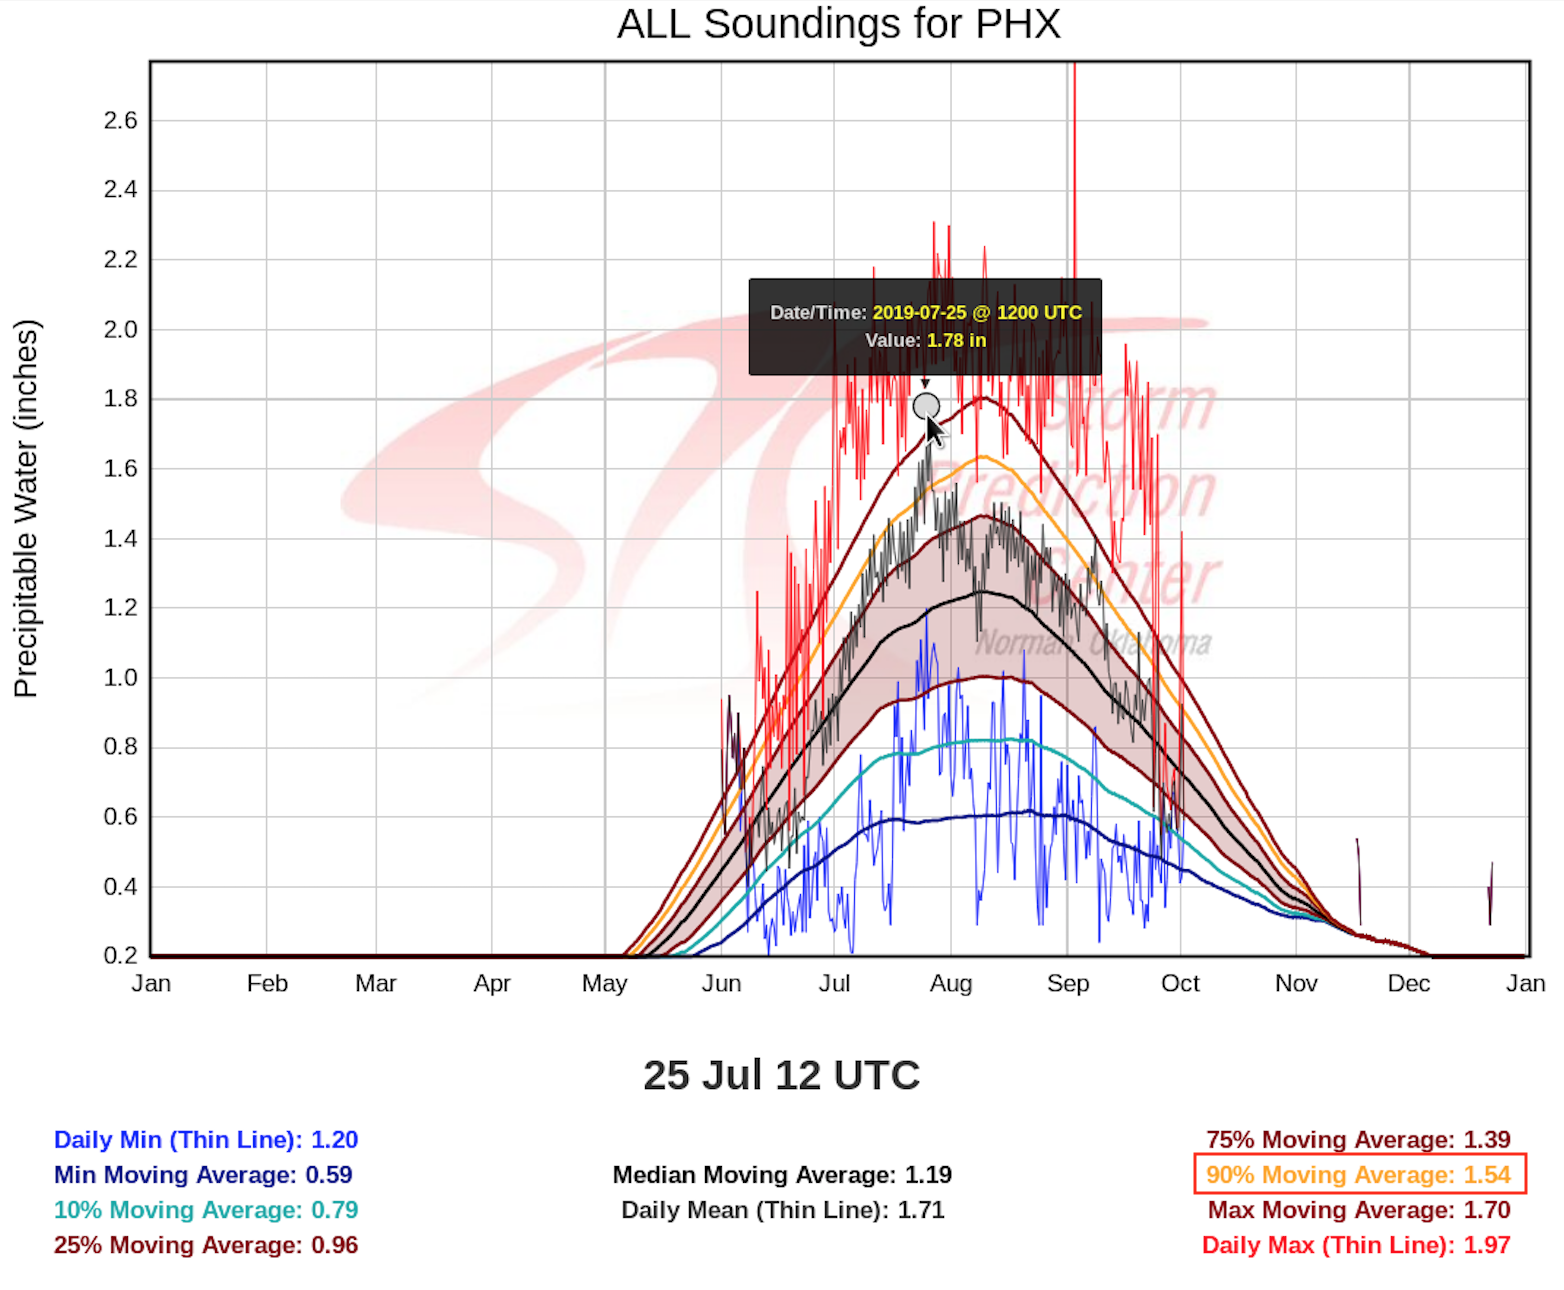
![Plot of Total Precipitable Water climatology for Las Vegas, Nevada [click to enlarge]](https://cimss.ssec.wisc.edu/satellite-blog/wp-content/uploads/sites/5/2019/07/190725_12utc_kvef_tpw_climatology.png)


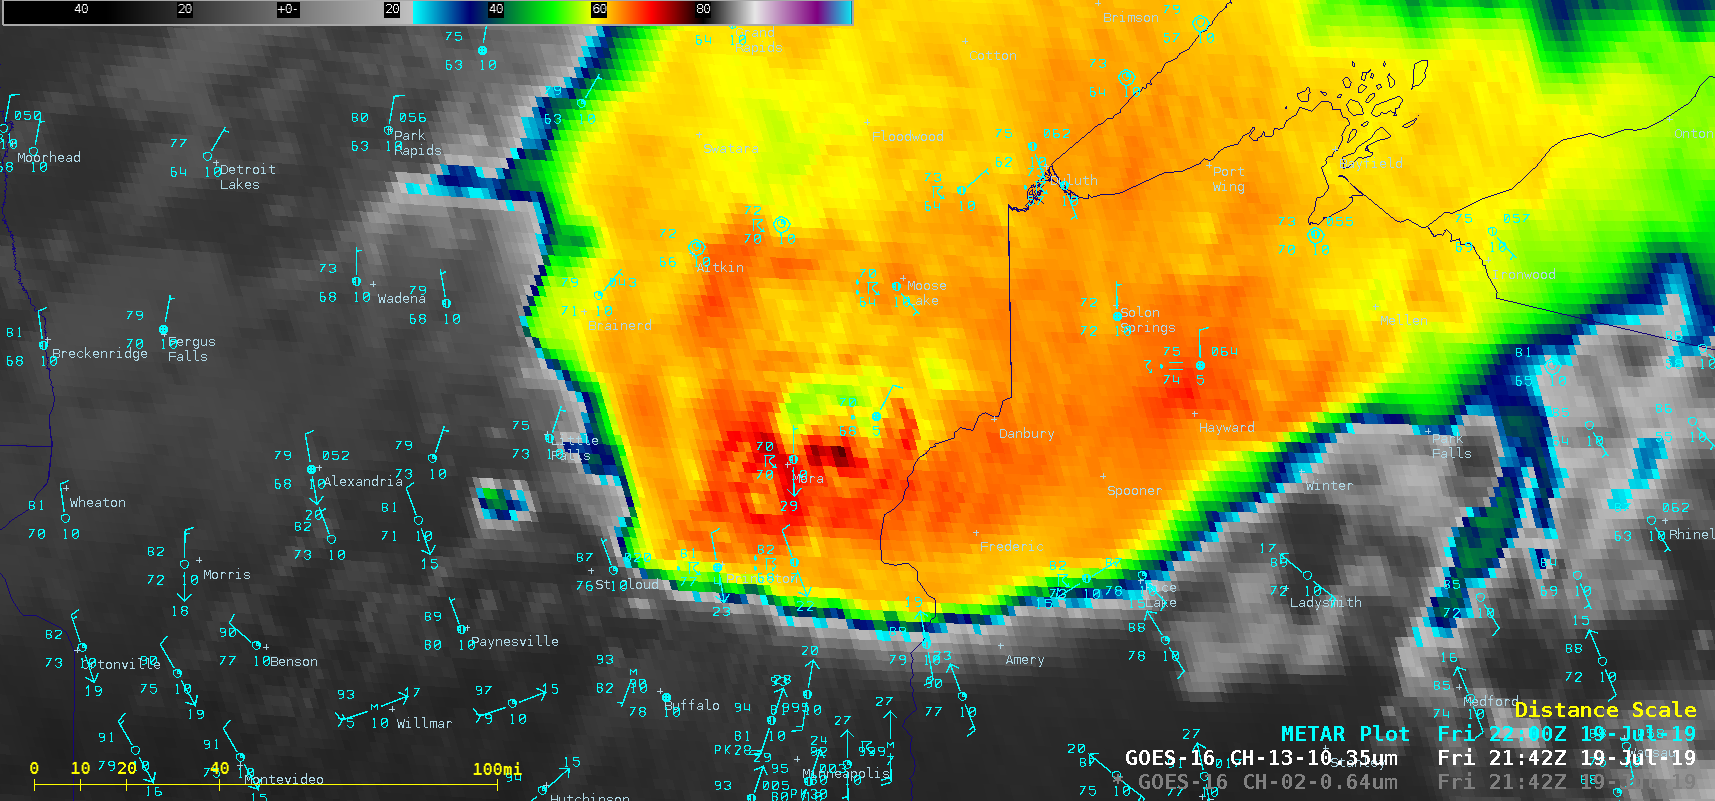
![GOES-16 "Red" Visible (0.64 µm) images, with SPC Storm Reports plotted in red [click to play MP4 animation]](https://cimss.ssec.wisc.edu/satellite-blog/wp-content/uploads/sites/5/2019/07/G16_VIS_MN_WI_19JUL2019_2019200_214215_GOES-16_0001PANEL.GIF)


![Terra MODIS True Color RGB images, 11 July vs 22 July [click to enlarge]](https://cimss.ssec.wisc.edu/satellite-blog/wp-content/uploads/sites/5/2019/07/190711_190722_terra_modis_truecolor_WI_anim.gif)
![14 July and 22 July Terra MODIS True Color RGB images [click to enlarge]](https://cimss.ssec.wisc.edu/satellite-blog/wp-content/uploads/sites/5/2019/07/190714_190722_modis_truecolor_realearth_anim.gif)
![Terra MODIS Visible (0.65 µm), Near-Infrared "Snow/Ice" (1.61 µm), Shortwave Infrared (3.7 µm), Land Surface Temperature and Normalized Difference Vegetation Index images on 22 July [click to enlarge]](https://cimss.ssec.wisc.edu/satellite-blog/wp-content/uploads/sites/5/2019/07/190722_1633utc_terra_modis_visible_snowIce_shortwaveInfrared_landSurfaceTemperature_normalizedDifferenceVegetationIndex_WI_anim.gif)
![GOES-16 Normalized Difference Vegetation Index images [click to play animation]](https://cimss.ssec.wisc.edu/satellite-blog/wp-content/uploads/sites/5/2019/07/190722_goes16_normalizedDifferenceVegetationIndex_WI_anim.gif)
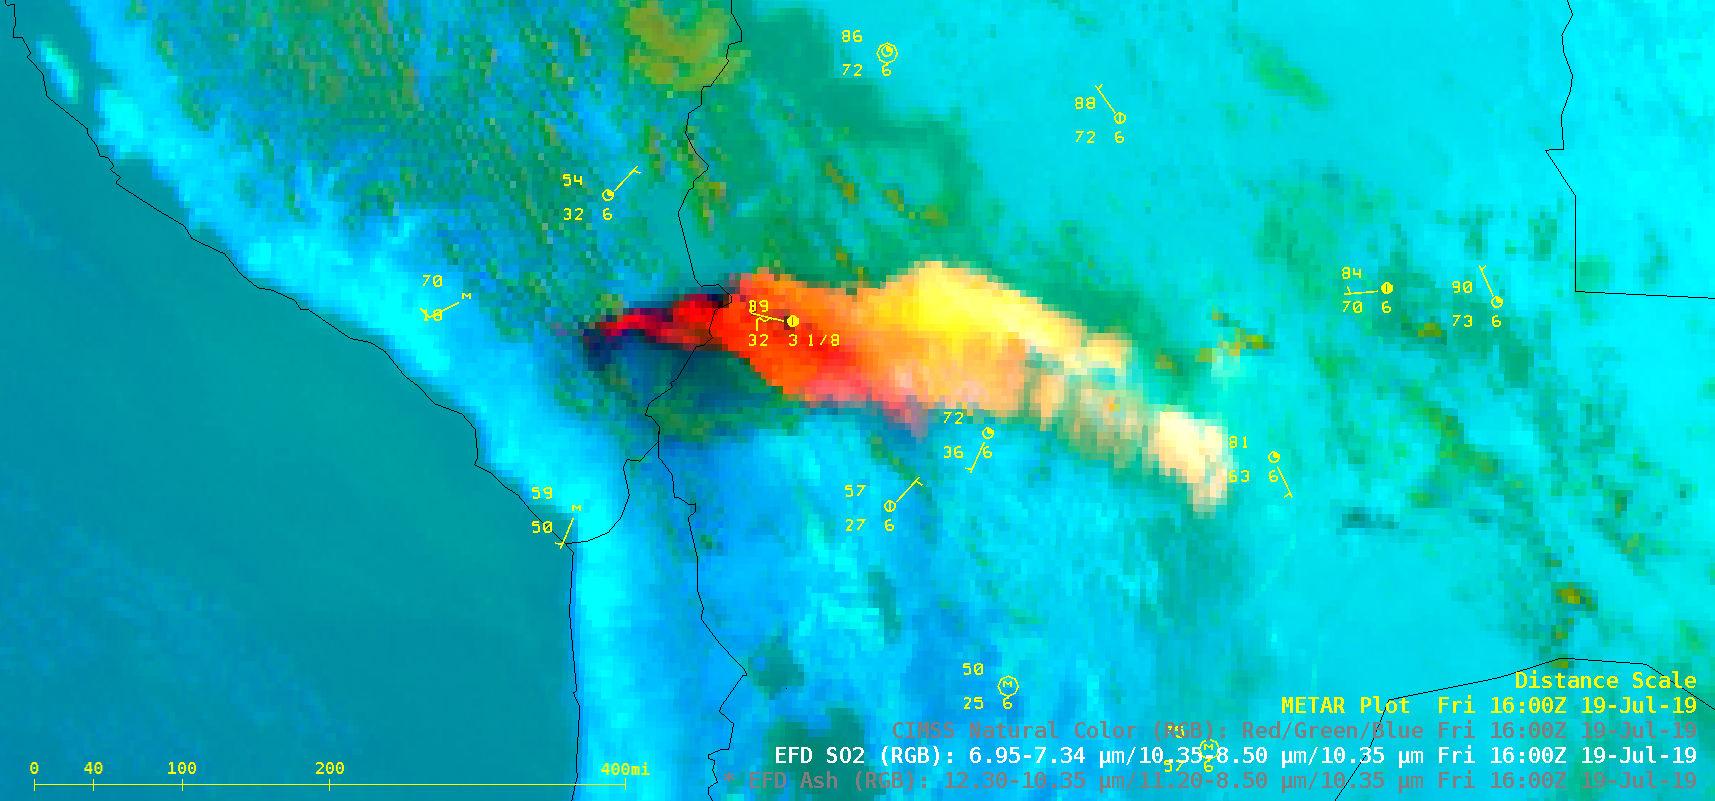
![GOES-16 Ash, SO2 and CIMSS Natural Color RGB images [click to play animation | MP4]](https://cimss.ssec.wisc.edu/satellite-blog/wp-content/uploads/sites/5/2019/07/190719_goes16_ashRGB_so2RGB_naturalColorRGB_Ubinas_volcano_Peru_anim.gif)
![Time series of surface data from La Paz, Bolivia [click to enlarge]](https://cimss.ssec.wisc.edu/satellite-blog/wp-content/uploads/sites/5/2019/07/190719_SLLP_SFCMG.GIF)
![Terra MODIS Ash Probability, Ash Loading, Ash Height and Ash Effective Radius at 1440 UTC [click to enlarge]](https://cimss.ssec.wisc.edu/satellite-blog/wp-content/uploads/sites/5/2019/07/190719_1440utc_terra_modis_ashProbability_ashLoading_ashHeight_ashEffectiveRadius_Ubinas_anim.gif)
![GOES-16 Ash Height images [click to play animation | MP4]](https://cimss.ssec.wisc.edu/satellite-blog/wp-content/uploads/sites/5/2019/07/190719_goes16_Ubinas_volcano_ashHeight_anim.gif)
