NOAA-20 VIIRS Day/Night Band (0.7 µm) and Infrared Window (11.45 µm) images (above) showed cold overshooting tops (darker black infrared enhancement) over the Leeward Islands as well as subtle mesospheric airglow waves propagating southward away from the center of Tropical Storm Dorian at 0606 UTC on 28 August 2019.In a toggle between... Read More
![NOAA-20 Day/Night Band (0.7 µm) and Infrared Window (11.45 µm) images, courtesy of William Straka (CIMSS) [click to enlarge]](https://cimss.ssec.wisc.edu/satellite-blog/wp-content/uploads/sites/5/2019/08/190828_0606utc_noaa20_dayNightBand_infraredWindow_TS_Dorian_anim.gif)
NOAA-20 VIIRS Day/Night Band (0.7 µm) and Infrared Window (11.45 µm) images, courtesy of William Straka (CIMSS) [click to enlarge]
NOAA-20 VIIRS Day/Night Band (0.7 µm) and Infrared Window (11.45 µm) images
(above) showed cold overshooting tops
(darker black infrared enhancement) over the Leeward Islands as well as subtle mesospheric airglow waves propagating southward away from the center of
Tropical Storm Dorian at 0606 UTC on 28 August 2019.
In a toggle between GOES-16 (GOES-East) “Clean” Infrared Window (10.35 µm) and DMSP-18 SSMIS Microwave (85 GHz) images from the CIMSS Tropical Cyclones site (below), the Microwave image revealed a convective band that was wrapping around the northern portion of the center of Dorian at 0930 UTC.
![GOES-16 "Clean" Infrared Window <em>(10.35 µm)</em> and DMSP-18 SSMIS Microwave <em>(85 GHz)</em> images [click to enlarge]](https://cimss.ssec.wisc.edu/satellite-blog/wp-content/uploads/sites/5/2019/08/190828_0930utc_goes16_infrared_dmsp18_microwave_Dorian_anim.gif)
GOES-16 “Clean” Infrared Window (10.35 µm) and DMSP-18 SSMIS Microwave (85 GHz) images [click to enlarge]
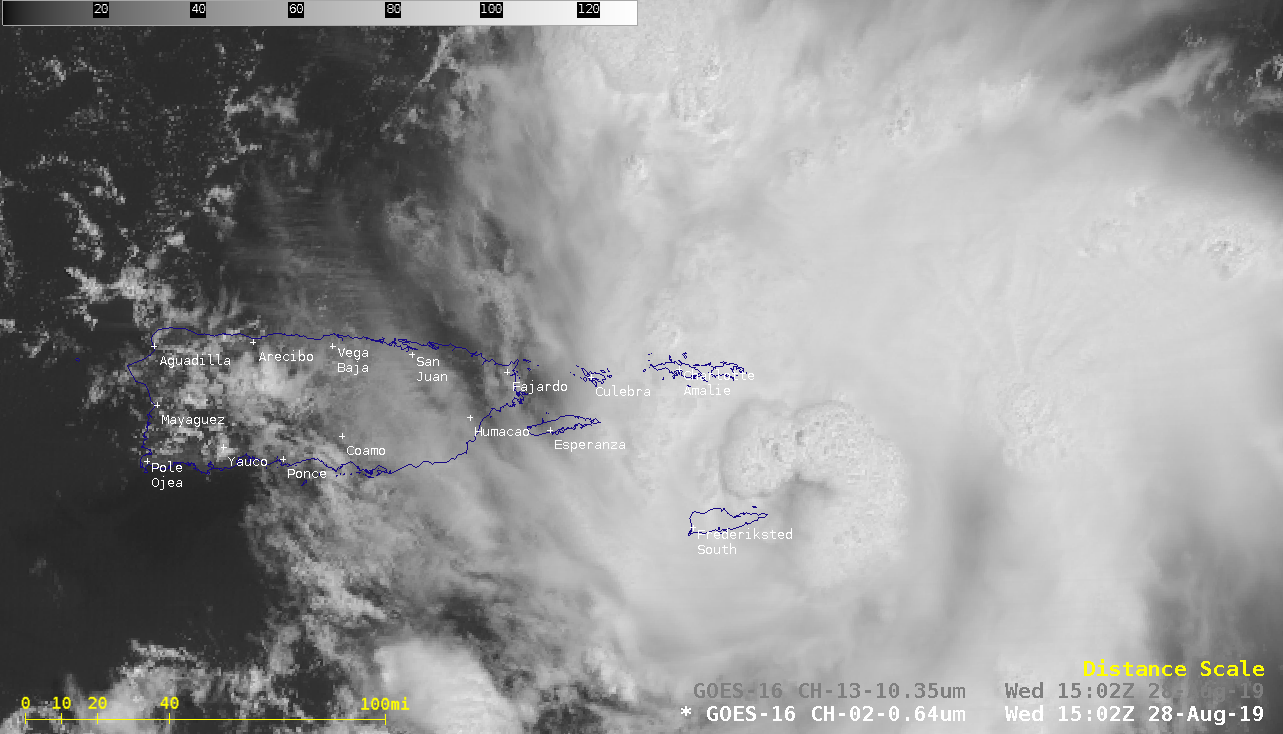
1-minute
Mesoscale Domain Sector GOES-16 “Red” Visible (
0.64 µm) and “Clean” Infrared Window (
10.35 µm) images
(below) also showed a convective burst wrapping around the eastern and northern edges of the center of Dorian after 15 UTC. The coldest cloud-top infrared brightness temperature associated with that early convective burst was -83ºC.
![GOES-16 “Red” Visible (0.64 µm) and “Clean” Infrared Window (10.35 µm) images [click to play animation | MP4]](https://cimss.ssec.wisc.edu/satellite-blog/wp-content/uploads/sites/5/2019/08/pr_vis-20190828_150254.png)
GOES-16 “Red” Visible (0.64 µm) and “Clean” Infrared Window (10.35 µm) images [click to play animation | MP4]
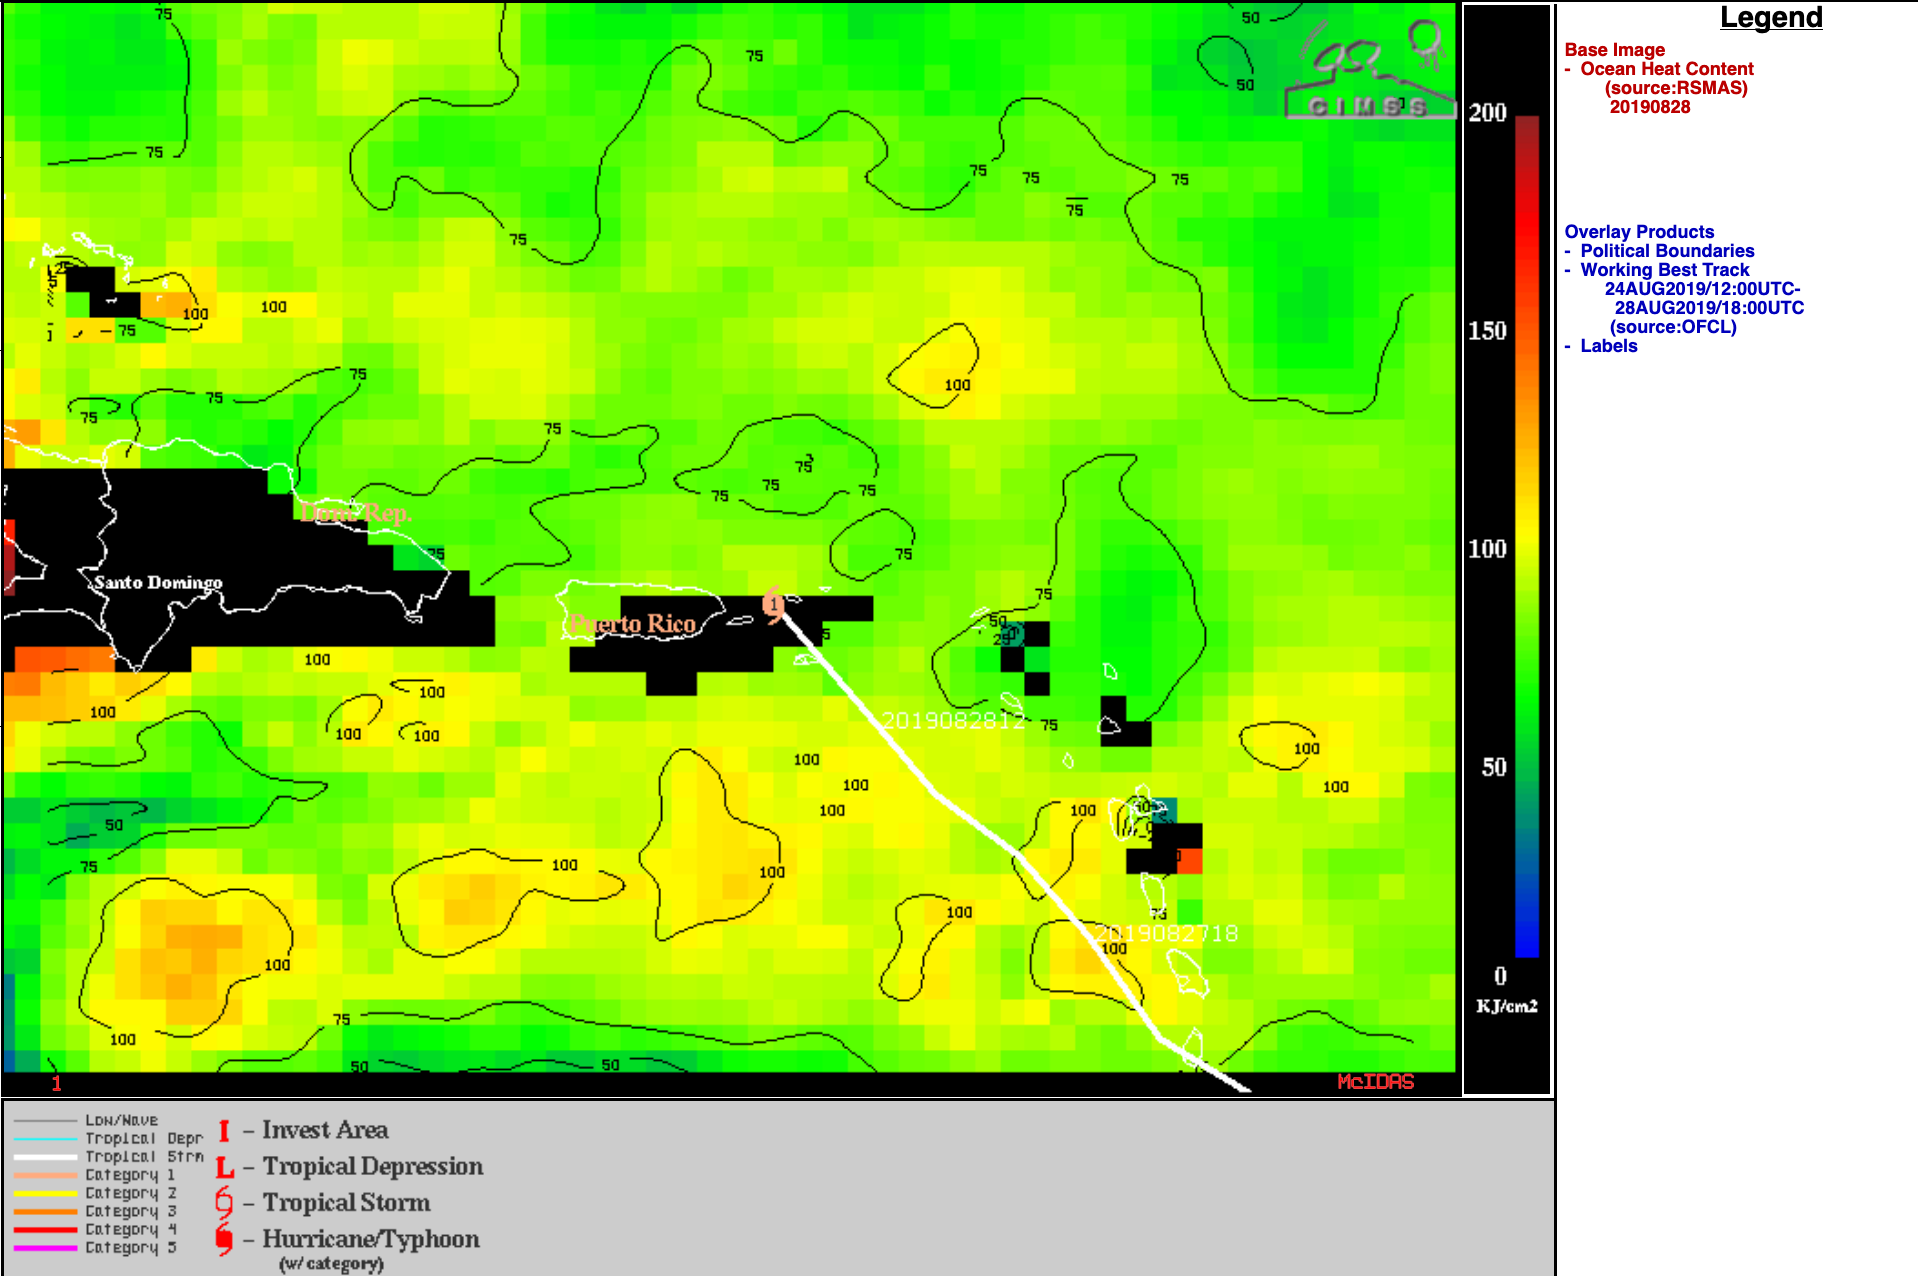
Dorian was upgraded to a
Category 1 Hurricane at
18 UTC. Prior to that time, the tropical cyclone had been moving through an environment of low
deep-layer wind shear (below), one factor that is favorable for intensification. Dorian was also passing over water possessing warm
sea surface temperatures and modest
ocean heat content.
![https://cimss.ssec.wisc.edu/satellite-blog/wp-content/uploads/sites/5/2019/08/.gifGOES-16 Infrared Window (10.35 µm) images, with contours of deep-layer wind shear at 19 UTC [click to enlarge]](https://cimss.ssec.wisc.edu/satellite-blog/wp-content/uploads/sites/5/2019/08/190828_goes16_infrared_19utc_deepLayerWindShear_Dorian_anim.gif)
GOES-16 Infrared Window (10.35 µm) images, with contours of deep-layer wind shear at 19 UTC [click to enlarge]
VIIRS True Color Red-Green-Blue (RGB) and Infrared Window (11.45 µm) images from NOAA-20 and Suomi NPP as viewed using
RealEarth are shown below, from around the time when Dorian was upgraded from a Tropical Storm to a Hurricane.
![VIIRS True Color RGB and Infrared Window (11.45 µm) images [click to enlarge]](https://cimss.ssec.wisc.edu/satellite-blog/wp-content/uploads/sites/5/2019/08/190828_1717utc_noaa20_1807utc_suomiNPP_viirs_trueColor_infraredWindow_Dorian_anim.gif)
VIIRS True Color RGB and Infrared Window (11.45 µm) images from NOAA-20 and Suomi NPP [click to enlarge]
A comparison of GOES-16 Infrared (at 2330 UTC) and GMI Microwave (at 2341 UTC) images
(below) revealed Dorian’s small eye.
![GOES-16 Infrared (10.35 µm) and GMI Microwave (85 GHz) images [click to enlarge]](https://cimss.ssec.wisc.edu/satellite-blog/wp-content/uploads/sites/5/2019/08/190828_2130utc_goe16_infrared_2141utc_gmi_microwave_Dorian_anim.gif)
GOES-16 Infrared (10.35 µm) and GMI Microwave (85 GHz) images [click to enlarge]
===== 29 August Update =====
![GOES-16 “Red” Visible (0.64 µm) and “Clean” Infrared Window (10.35 µm) images [click to play animation | MP4]](https://cimss.ssec.wisc.edu/satellite-blog/wp-content/uploads/sites/5/2019/08/dor_ir-20190829_185354.png)
GOES-16 “Red” Visible (0.64 µm) and “Clean” Infrared Window (10.35 µm) images [click to play animation | MP4]
On 29 August, 1-minute GOES-16 Visible and Infrared images
(above) showed that periodic convective bursts persisted around the center of Category 1 Hurricane Dorian.
During one of those convective bursts from 1800-1900 UTC, an increase in GOES-16 GLM Flash Extent Density was evident (below).
![GOES-16 “Red” Visible (0.64 µm) and “Clean” Infrared Window (10.35 µm) images, with and without overlays of GLM Flash Extent Density [click to play animation | MP4]](https://cimss.ssec.wisc.edu/satellite-blog/wp-content/uploads/sites/5/2019/08/dor_ir_glm-20190829_185354.png)
GOES-16 “Red” Visible (0.64 µm) and “Clean” Infrared Window (10.35 µm) images, with and without overlays of GLM Flash Extent Density [click to play animation | MP4]
GOES-16 Visible and Infrared images at 1852 UTC with and without an overlay of GLM Flash Extent Density are shown below. At that particular time, the overshooting top infrared brightness temperature reached a minimum value of -82.5C.
![GOES-16 “Red” Visible (0.64 µm) image at 1853 UTC, with and without an overlay of GLM Flash Extent Density [click to enlarge]](https://cimss.ssec.wisc.edu/satellite-blog/wp-content/uploads/sites/5/2019/08/190829_1852utc_goes16_visible_glmFED_Dorian_anim.gif)
GOES-16 “Red” Visible (0.64 µm) image at 1852 UTC, with and without an overlay of GLM Flash Extent Density [click to enlarge]
![GOES-16 “Clean” Infrared Window (10.35 µm) image at 1853 UTC, with and without an overlay of GLM Flash Extent Density [click to enlarge]](https://cimss.ssec.wisc.edu/satellite-blog/wp-content/uploads/sites/5/2019/08/190829_1852utc_goes16_infrared_glmFED_Dorian_anim.gif)
GOES-16 “Clean” Infrared Window (10.35 µm) image at 1852 UTC, with and without an overlay of GLM Flash Extent Density [click to enlarge]
===== 30 August Update =====
![GOES-16 “Red” Visible (0.64 µm) and “Clean” Infrared Window (10.35 µm) images [click to play animation | MP4]](https://cimss.ssec.wisc.edu/satellite-blog/wp-content/uploads/sites/5/2019/08/dor_ir-20190830_142753.png)
GOES-16 “Red” Visible (0.64 µm) and “Clean” Infrared Window (10.35 µm) images [click to play animation | MP4]
The eye of Dorian became more well-defined in 1-minute GOES-16 Visible and Infrared images
(above) during the morning hours on 30 August.
A DMSP-17 Microwave (85 GHz) Microwave image at 1141 UTC (below) did not yet show a completely closed eyewall structure at that earlier time.
![DMSP-17 SSMIS Microwave (85 GHz) Microwave image [click to enlarge]](https://cimss.ssec.wisc.edu/satellite-blog/wp-content/uploads/sites/5/2019/08/190830_1415utc_dmsp17_ssmis_mw_Dorian.png)
DMSP-17 SSMIS Microwave (85 GHz) Microwave image [click to enlarge]
Dorian was upgraded to a Category 3 hurricane at
18 UTC — the storm was moving into a narrow corridor of weaker
deep-layer wind shear around that time. During the 3 hours leading up to 18 UTC, animations of 1-minute GOES-16 Visible and Infrared imagery — with and without an overlay of GLM Flash Extent Density — are shown below.
![GOES-16 “Red” Visible (0.64 µm) images, with and without overlays of GLM Flash Extent Density [click to play animation | MP4]](https://cimss.ssec.wisc.edu/satellite-blog/wp-content/uploads/sites/5/2019/08/dor_vis_glm-20190830_150653.png)
GOES-16 “Red” Visible (0.64 µm) images, with and without overlays of GLM Flash Extent Density [click to play animation | MP4]
![GOES-16 “Clean” Infrared Window (10.35 µm) images, with and without overlays of GLM Flash Extent Density [click to play animation | MP4]](https://cimss.ssec.wisc.edu/satellite-blog/wp-content/uploads/sites/5/2019/08/dor_ir_glm-20190830_150653.png)
GOES-16 “Clean” Infrared Window (10.35 µm) images, with and without overlays of GLM Flash Extent Density [click to play animation | MP4]
===== 31 August Update =====
![30-second GOES-16 “Red” Visible (0.64 µm) images [click to play animation | MP4]](https://cimss.ssec.wisc.edu/satellite-blog/wp-content/uploads/sites/5/2019/08/dor2_vis-20190831_190053.png)
30-second GOES-16 “Red” Visible (0.64 µm) images [click to play animation | MP4]
Overlapping 1-minute GOES-16 Mesoscale Domain Sectors provided imagery at 30-second intervals — Visible and Infrared animations of the Category 4 hurricane from 1430-1900 UTC are shown above and below, respectively. A longer Visible animation from 1100-2259 UTC is available
here (courtesy of Pete Pokrandt,
AOS).
![GOES-16 “Red” Visible (0.64 µm) and “Clean” Infrared Window (10.35 µm) images [click to play animation | MP4]](https://cimss.ssec.wisc.edu/satellite-blog/wp-content/uploads/sites/5/2019/08/dor2_ir-20190831_190053.png)
30-second GOES-16 “Clean” Infrared Window (10.35 µm) images [click to play animation | MP4]
View only this post
Read Less
![GOES-16 “Red” Visible (0.64 µm) and “Clean” Infrared Window (10.35 µm) images [click to play animation | MP4]](https://cimss.ssec.wisc.edu/satellite-blog/wp-content/uploads/sites/5/2019/08/190828_goes16_visible_infrared_TS_Dorian_anim.gif)
![GOES-16 “Red” Visible (0.64 µm) and “Clean” Infrared Window (10.35 µm) images [click to play animation | MP4]](https://cimss.ssec.wisc.edu/satellite-blog/wp-content/uploads/sites/5/2019/08/190829_goes16_visible_infrared_Hurricane_Dorian_anim.gif)
![GOES-16 “Red” Visible (0.64 µm) and “Clean” Infrared Window (10.35 µm) images, with and without overlays of GLM Flash Extent Density [click to play animation | MP4]](https://cimss.ssec.wisc.edu/satellite-blog/wp-content/uploads/sites/5/2019/08/190829_1800_1900utc_goes16_visible_infrared_glmFlashExtentDensity_Hurricane_Dorian_anim.gif)
![GOES-16 “Red” Visible (0.64 µm) and “Clean” Infrared Window (10.35 µm) images [click to play animation | MP4]](https://cimss.ssec.wisc.edu/satellite-blog/wp-content/uploads/sites/5/2019/08/190830_goes16_visible_infrared_Dorian_anim.gif)
![GOES-16 “Red” Visible (0.64 µm) images, with and without overlays of GLM Flash Extent Density [click to play animation | MP4]](https://cimss.ssec.wisc.edu/satellite-blog/wp-content/uploads/sites/5/2019/08/190830_15-18utc_goes16_visible_glmFlashExtentDensity_Dorian_anim.gif)
![GOES-16 “Clean” Infrared Window (10.35 µm) images, with and without overlays of GLM Flash Extent Density [click to play animation | MP4]](https://cimss.ssec.wisc.edu/satellite-blog/wp-content/uploads/sites/5/2019/08/190830_15-18utc_goes16_infrared_glmFlashExtentDensity_Dorian_anim.gif)
![30-second GOES-16 “Red” Visible (0.64 µm) images [click to play animation | MP4]](https://cimss.ssec.wisc.edu/satellite-blog/wp-content/uploads/sites/5/2019/08/190831_goes16_visible_30second_Dorian_anim.gif)
![GOES-16 “Red” Visible (0.64 µm) and “Clean” Infrared Window (10.35 µm) images [click to play animation | MP4]](https://cimss.ssec.wisc.edu/satellite-blog/wp-content/uploads/sites/5/2019/08/190831_goes16_infrared_30second_Dorian_anim.gif)
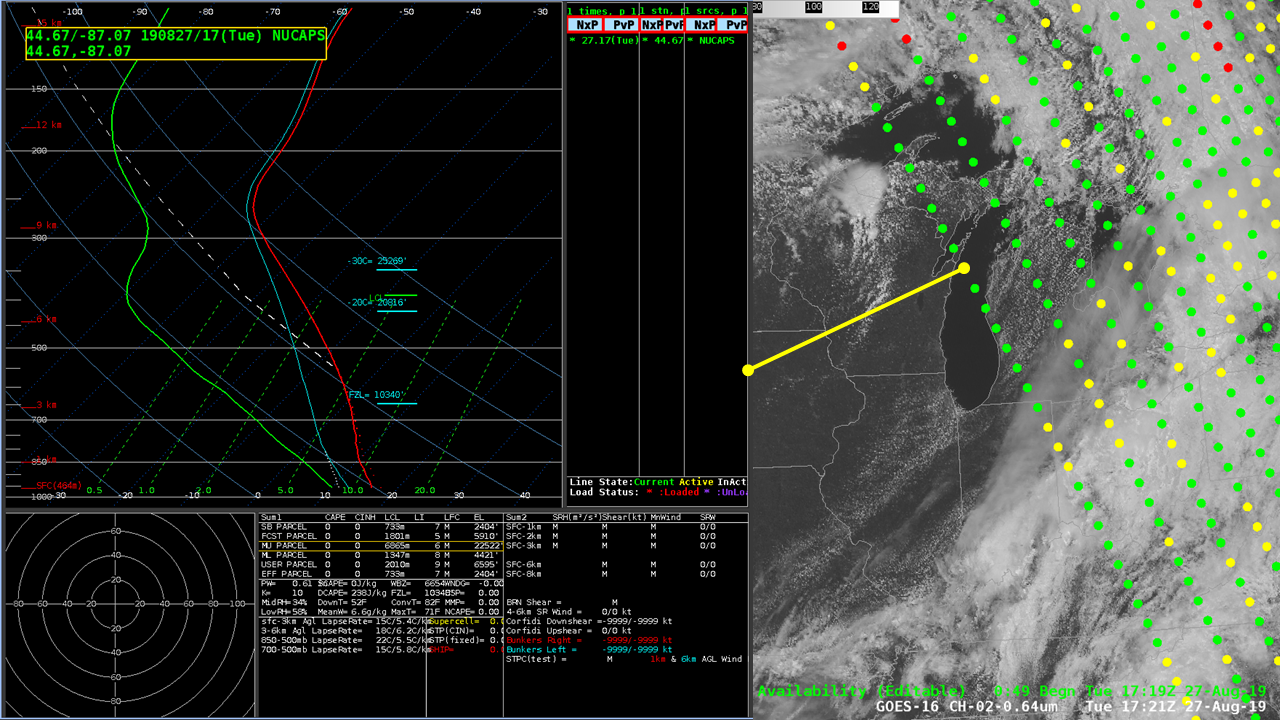


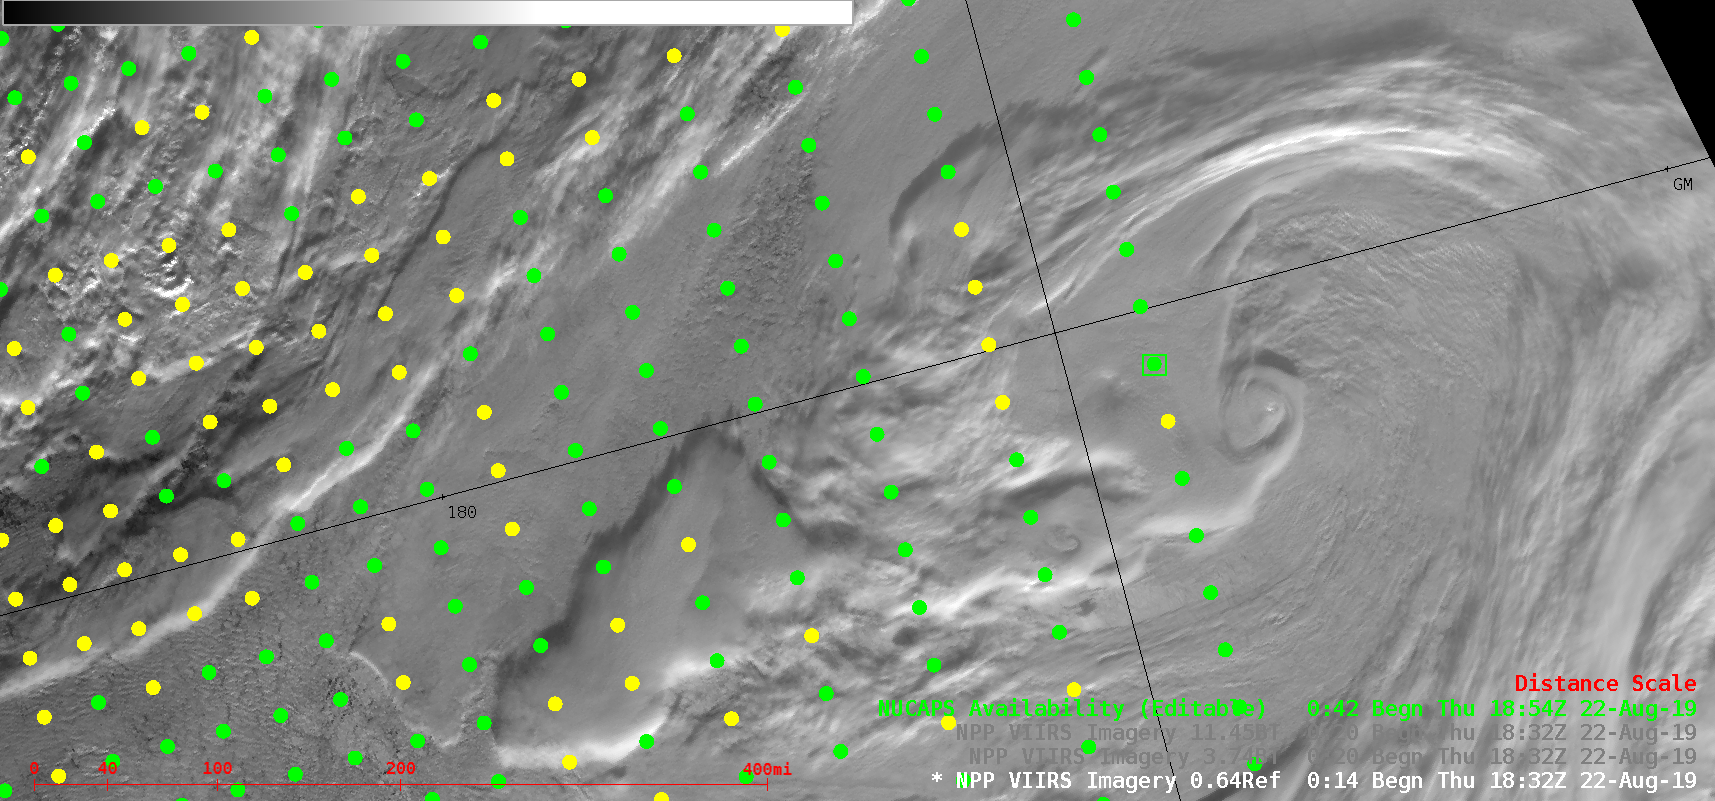
![Suomi NPP VIIRS Visible (0.64 µm), Shortwave Infrared (3.74 µm) and Infrared Window (11.45 µm) images [click to enlarge]](https://cimss.ssec.wisc.edu/satellite-blog/wp-content/uploads/sites/5/2019/08/190822_suomiNPP_viirs_visible_shortwaveInfrared_infraredWindow_North_Pole_anim.gif)
![Suomi NPP VIIRS Visible (0.64 µm) images, with plots of NUCAPS availability [click to enlarge]](https://cimss.ssec.wisc.edu/satellite-blog/wp-content/uploads/sites/5/2019/08/190822_suomiNPP_viirs_visible_noaa20_nucaps_North_Pole_anim.gif)
![NUCAPS temperature (red) and dew point (green) profiles [click to enlarge]](https://cimss.ssec.wisc.edu/satellite-blog/wp-content/uploads/sites/5/2019/08/190822_nucaps_profiles_North_Pole_anim.gif)
![GCOM-W1 AMSR2 sea ice concentration [click to enlarge]](https://cimss.ssec.wisc.edu/satellite-blog/wp-content/uploads/sites/5/2019/08/190822_seaice_NH.png)


