
GOES-17 ABI Split Window Difference (10.3 – 12.3) at 0100 UTC on 20 August 2019 (Click to enlarge)
The Split Window Difference field (10.3 µm – 12.3 µm), shown above in the south Pacific around Samoa and American Samoa (Leone is on the island of Tutuila just west of 170º W Longitude; Fitiuta is on the island of Ta’u just east of 170º W Longitude), can be used to estimate the horizontal distribution of water vapor. The Split Window Difference can give a good estimate of moisture distribution in the atmosphere over the ocean where conventional moisture measurements are limited. The image above shows greater values (3.5 – 4 K, in yellow and orange) over the northern part of the image and smaller values (2-3 K, in yellow and blue) over the southern part of the image, divided by a band of cloudiness that passes through 20º S, 170º W.
NOAA-20 overflew this region at 0056 UTC, and NUCAPS profiles were available, as shown below.

GOES-17 ABI Split Window Difference (10.3 – 12.3) at 0100 UTC on 20 August 2019 along with NUCAPS Sounding locations (Click to enlarge)
The animation below steps through soundings at different locations. Total precipitable water as determined from the sounding is indicated. In the region where the Split Window Difference field was around 4 K, precipitable water values were in the 1.5-1.7″ range; in regions where the Split Window Difference was closer to 2 K, precipitable water values were closer to 0.5-0.75″.
NUCAPS Vertical Profiles at different locations, as noted. (Click to animate)
Microwave-only data, shown below from the MIMIC website, shows a sharp gradient at 20º S, 170º W.
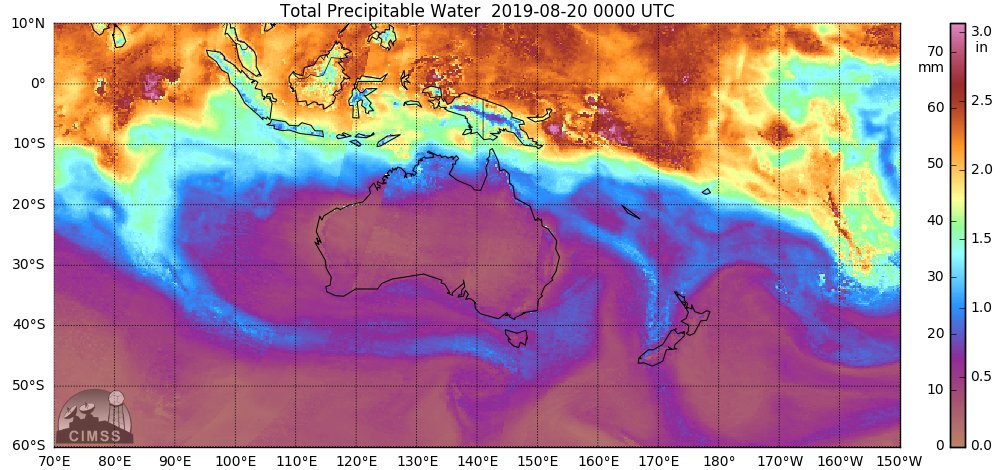
MIMIC Total Precipitable Water, 0000 UTC on 20 August 2019 (Click to enlarge)
At ~1200 UTC, when NUCAPS again passed over this region, profiles could again be used to discern gradients in total precipitable water. At that time, however, the Split Window Difference field was not computed because warming of the Advanced Baseline Imager (ABI) associated with the sub-optimal performance of the Loop Heat Pipe meant that Band 15 data were not available. (Baseline Level 2 Products, such as total precipitable water, are also unavailable from GOES-17 because of the Loop Heat Pipe issue) The Split Window Difference field could be computed from Himawari-8 data however.
View only this post Read Less
![GOES-16 Shortwave Infrared (3.9 µm) images [click to play animation | MP4]](https://cimss.ssec.wisc.edu/satellite-blog/wp-content/uploads/sites/5/2019/08/190817_190818_goes16_shortwaveInfrared_Bolivia_anim.gif)
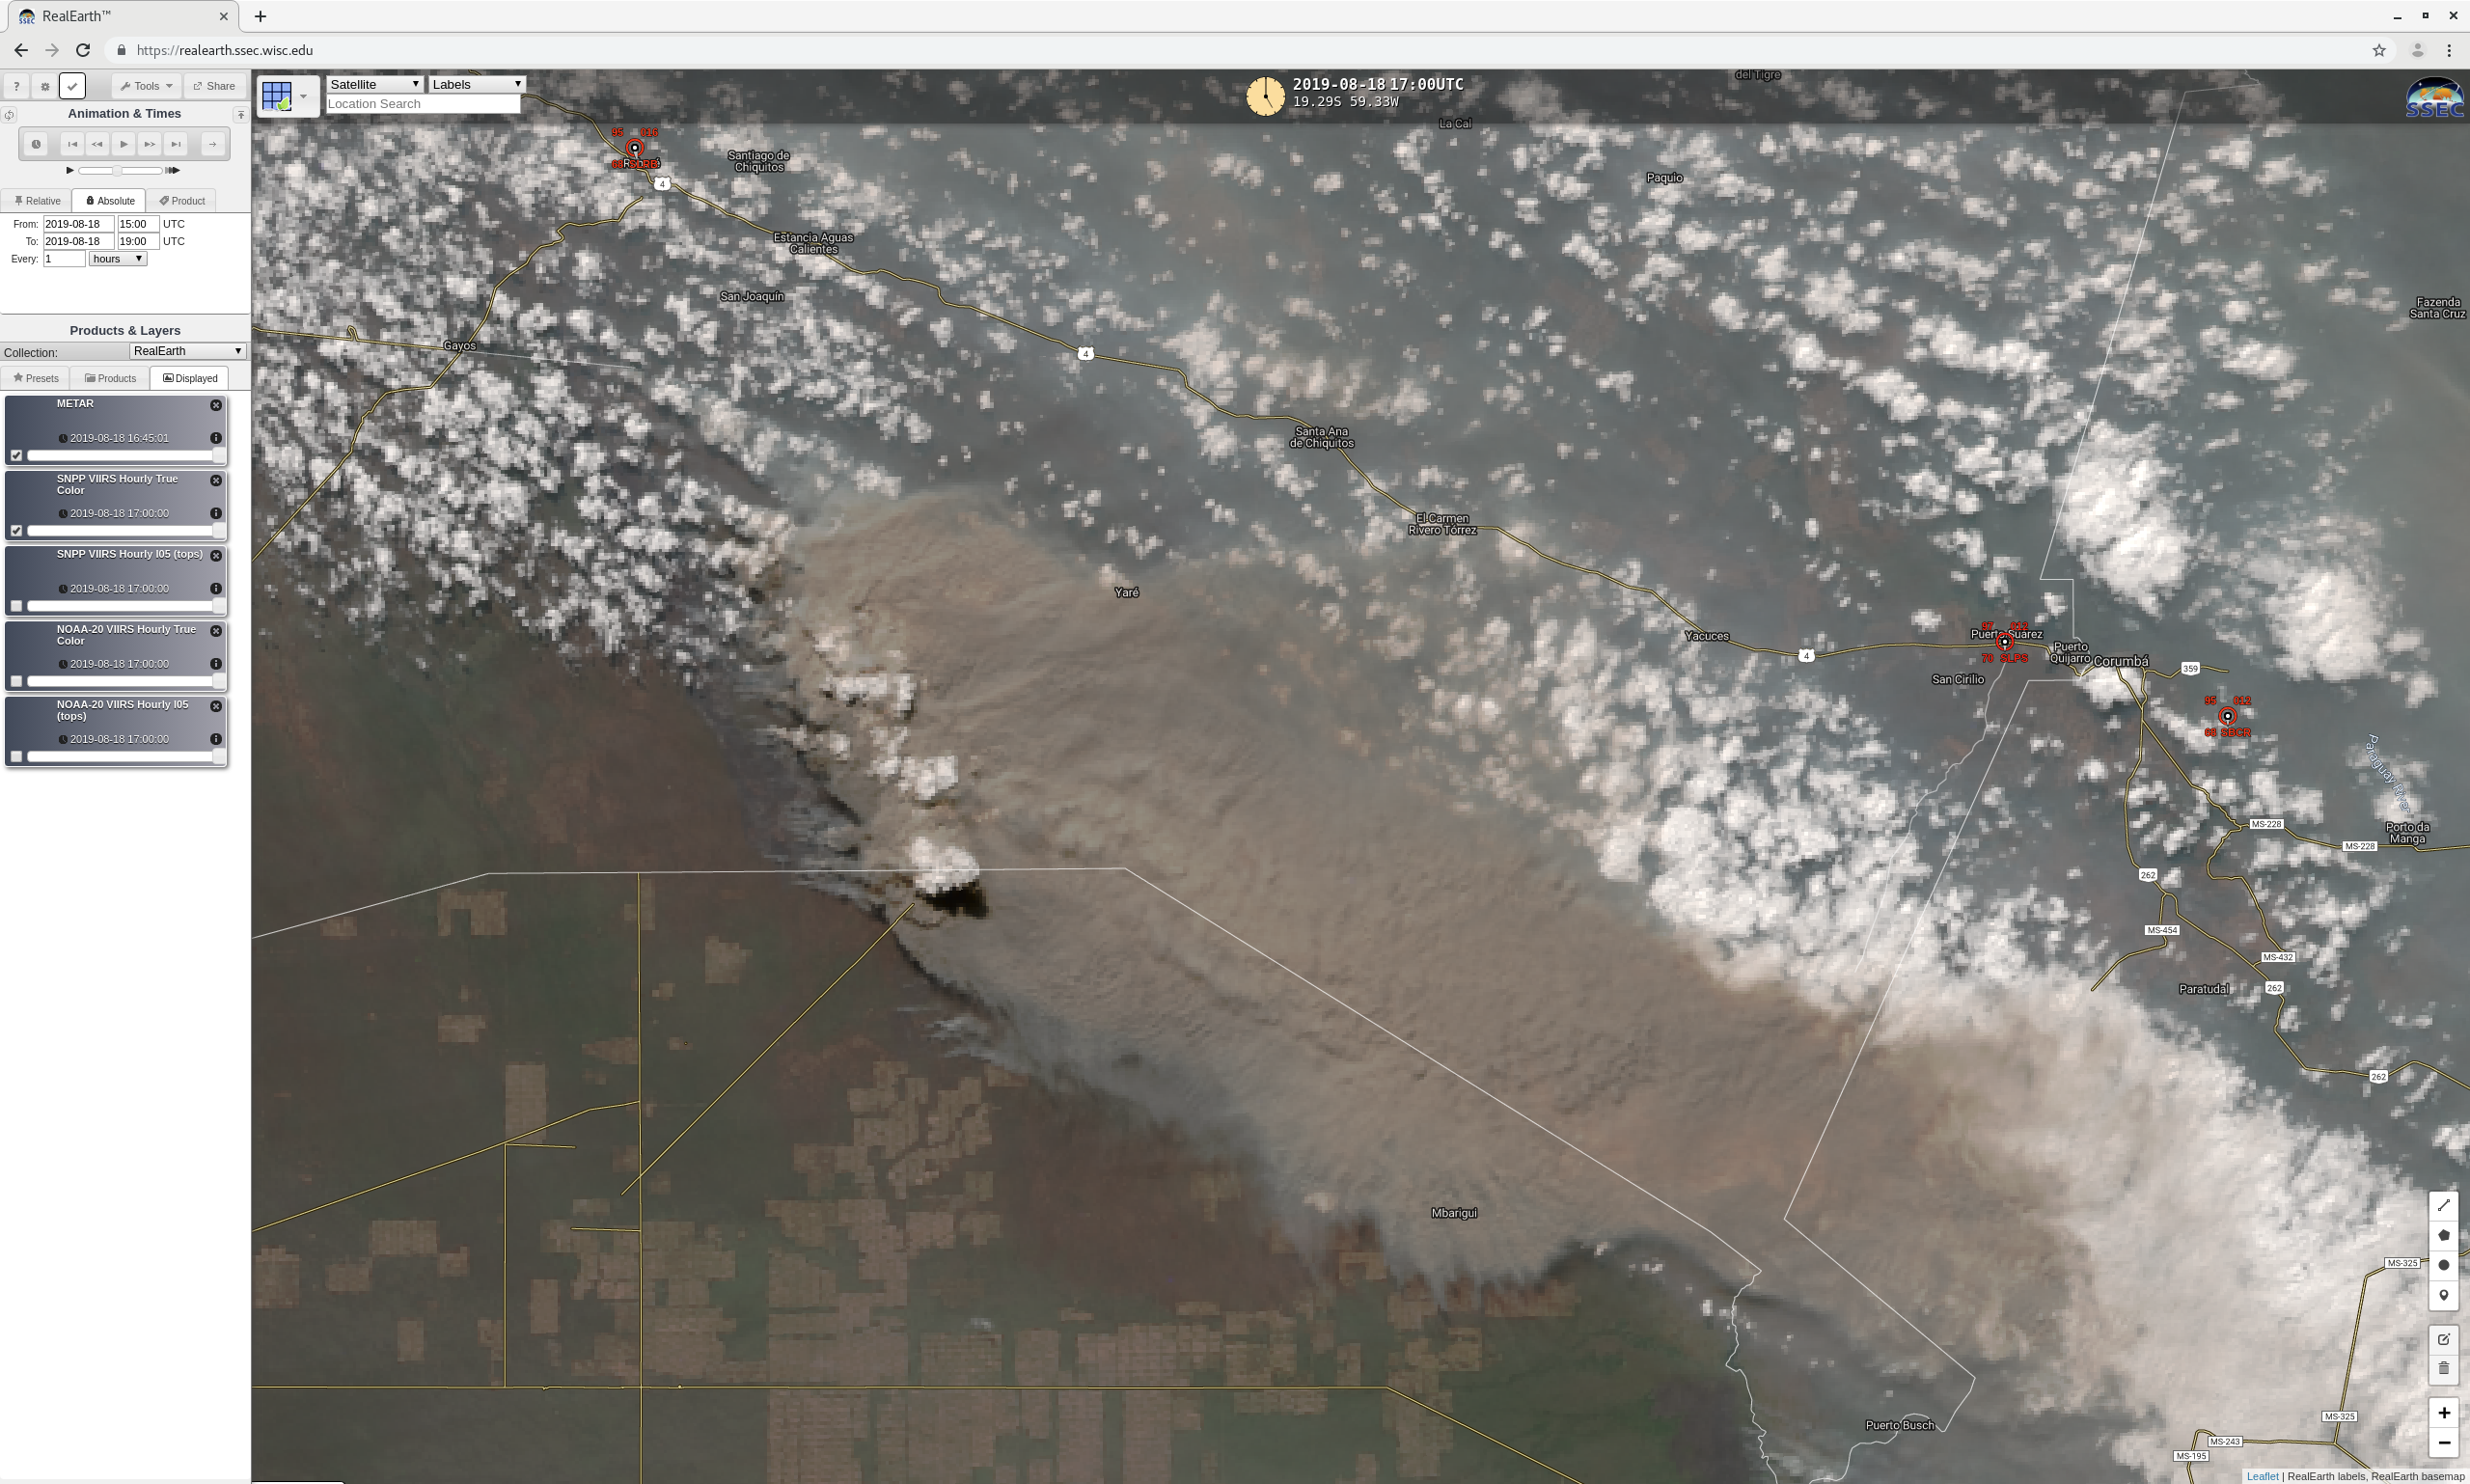
![Suomi NPP VIIRS True Color Red-Green-Blue (RGB) and Infrared Window (11.45 µm) images [click to enlarge]](https://cimss.ssec.wisc.edu/satellite-blog/wp-content/uploads/sites/5/2019/08/190818_17utc_suomiNPP_viirs_trueColor_infraredWindow_Bolivia_pyrocb_anim.gif)
![Time series of surface report data from Robore, Bolivia [click to enlarge]](https://cimss.ssec.wisc.edu/satellite-blog/wp-content/uploads/sites/5/2019/08/190818_SLRB_SFCMG.GIF)
![GOES-16 “Red” Visible (0.64 µm, top), Shortwave Infrared (3.9 µm, middle) and “Clean” Infrared Window (10.35 µm, bottom) images [click to play animation | MP4]](https://cimss.ssec.wisc.edu/satellite-blog/wp-content/uploads/sites/5/2019/08/190825_goes16_visible_shortwaveInfrared_longwaveInfraredWindow_Bolivia_pyrocb_anim.gif)
![Suomi NPP and NOAA-20 VIIRS True Color RGB and Infrared Window (11.45 µm) images [click to enlarge]](https://cimss.ssec.wisc.edu/satellite-blog/wp-content/uploads/sites/5/2019/08/190825_1712utc_suomiNPP_1802utc_noaa20_trueColor_infraredWindow_Bolivia_pyroCb_anim.gif)


![Time series of surface reports from Seward, Alaska [click to enlarge]](https://cimss.ssec.wisc.edu/satellite-blog/wp-content/uploads/sites/5/2019/08/190817_PAWD_SFCMG.GIF)
![Seward Airport webcam image at 2358 UTC [click to enlarge]](https://cimss.ssec.wisc.edu/satellite-blog/wp-content/uploads/sites/5/2019/08/190817_2358utc_Seward_airport_webcam.png)
![Air Quality Index at Copper Landing and Seward [click to enlarge]](https://cimss.ssec.wisc.edu/satellite-blog/wp-content/uploads/sites/5/2019/08/190817_Seward_AK_airQalityIndex.png)
![VIIRS True Color RGB images from NOAA-20 and Suomi NPP [click to enlarge]](https://cimss.ssec.wisc.edu/satellite-blog/wp-content/uploads/sites/5/2019/08/190817_noaa20_suomiNPP_viirs_trueColor_SwanLakeFire_AK_anim.gif)


