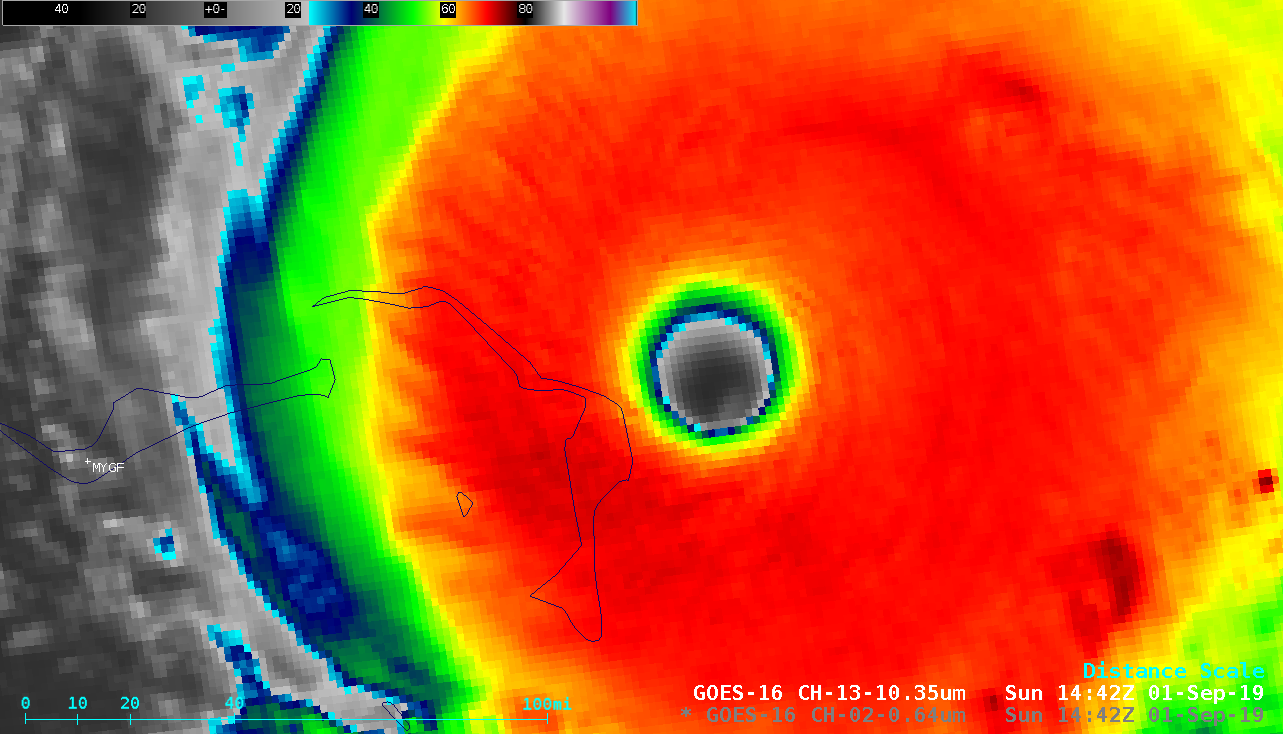
Overlapping 1-minute Mesoscale Domain Sectors provided GOES-16 (GOES-East) “Red” Visible (0.64 µm) and “Clean” Infrared Window (10.35 µm) images at 30-second intervals (above) as Hurricane Dorian reached Category 5 intensity just east of Great Abaco Island in the Bahamas during the morning hours on 01 September 2019. West of Dorian, station Identifier MYGF is Freeport on... Read More
![GOES-16 “Red” Visible (0.64 µm) and “Clean” Infrared Window (10.35 µm) images [click to play animation | MP4]](https://cimss.ssec.wisc.edu/satellite-blog/wp-content/uploads/sites/5/2019/09/dor_ir-20190901_144223.png)
GOES-16 “Red” Visible (0.64 µm) and “Clean” Infrared Window (10.35 µm) images [click to play animation | MP4]
Overlapping 1-minute
Mesoscale Domain Sectors provided GOES-16
(GOES-East) “Red” Visible (
0.64 µm) and “Clean” Infrared Window (
10.35 µm) images at
30-second intervals
(above) as
Hurricane Dorian reached
Category 5 intensity just east of Great Abaco Island in the Bahamas during the morning hours on 01 September 2019. West of Dorian, station Identifier MYGF is Freeport on Grand Bahama Island (which stopped reporting at 00 UTC on 01 September, due to evacuation).
As noted in the 15 UTC NHC discussion, the eye of Dorian was exhibiting a pronounced “stadium effect”, with a smaller-diameter surface eye sloping outward with increasing altitude (below).
![GOES-16 “Red” Visible (0.64 µm) and “Clean” Infrared Window (10.35 µm) images at 1200 UTC [click to enlarge]](https://cimss.ssec.wisc.edu/satellite-blog/wp-content/uploads/sites/5/2019/09/190901_1200utc_goes16_visible_infrared_Dorian_stadiumEffect_anim.gif)
GOES-16 “Red” Visible (0.64 µm) and “Clean” Infrared Window (10.35 µm) images at 1200 UTC [click to enlarge]
GOES-16 Visible images with and without overlays of
GLM Flash Extent Density
(below) revealed that lightning activity began to ramp up within the eyewall region after 12 UTC.
![GOES-16 “Red” Visible (0.64 µm) images, with and without overlays of GLM Flash Extent Density [click to play animation | MP4]](https://cimss.ssec.wisc.edu/satellite-blog/wp-content/uploads/sites/5/2019/09/dor2_vis_glm-20190901_144223.png)
GOES-16 “Red” Visible (0.64 µm) images, with and without overlays of GLM Flash Extent Density [click to play animation | MP4]
A
Mid-Level Wind Shear product
(below) showed that Dorian had been moving through an environment of low shear — generally 10 knots or less — during the 00-15 UTC time period on 01 September.
![Mid-layer Wind Shear product, 00-15 UTC [click to enlarge]](https://cimss.ssec.wisc.edu/satellite-blog/wp-content/uploads/sites/5/2019/09/190901_midLayerWindShear_Dorian_anim.gif)
Mid-layer Wind Shear product, 00-15 UTC [click to enlarge]
As pointed out by NWS Grand Forks
(above), portions of the outer cays just east of Great Abaco Island could be seen in GOES-16 Visible imagery through breaks in the low-level clouds within the eye
(below).
![GOES-16 “Red” Visible (0.64 µm) images [click to play animation | MP4]](https://cimss.ssec.wisc.edu/satellite-blog/wp-content/uploads/sites/5/2019/09/dor_vis_zoom-20190901_160423.png)
GOES-16 “Red” Visible (0.64 µm) images [click to play animation | MP4]
VIIRS True Color Red-Green-Blue (RGB) and Infrared Window (11.45 µm) images from Suomi NPP and NOAA-20 as viewed using
RealEarth are shown below, as the eye was moving over Great Abaco Island.
![VIIRS True Color RGB and Infrared Window (11.45 µm) images from Suomi NPP and NOAA-20 [click to enlarge]](https://cimss.ssec.wisc.edu/satellite-blog/wp-content/uploads/sites/5/2019/09/190901_suomiNPP_noaa20_viirs_trueColor_infraredWindow_Dorian_anim.gif)
VIIRS True Color RGB and Infrared Window (11.45 µm) images from Suomi NPP and NOAA-20 [click to enlarge]
After moving slowly westward across Great Abaco Island, Dorian later became the first Category 5 hurricane on record to make landfall on Grand Bahama Island (below). Station identifier MYGF is Grand Bahama International Airport in Freeport, and MYGW is West End Airport.
![GOES-16 “Clean” Infrared Window (10.35 µm) images [click to play animation | MP4]](https://cimss.ssec.wisc.edu/satellite-blog/wp-content/uploads/sites/5/2019/09/dor2_ir-20190902_020026.png)
GOES-16 “Clean” Infrared Window (10.35 µm) images [click to play animation | MP4]
===== 02 September Update =====
![GOES-16 “Clean” Infrared Window (10.35 µm) images [click to play animation | MP4]](https://cimss.ssec.wisc.edu/satellite-blog/wp-content/uploads/sites/5/2019/09/dor_ir-20190902_050522.png)
GOES-16 “Clean” Infrared Window (10.35 µm) images [click to play animation | MP4]
Prior to sunrise on 02 September, 1-minute GOES-16 Infrared images
(above) showed Dorian moving very slowly — with a forward speed of only 1 mph — across the eastern end of Grand Bahama Island (as it remained at Category 5 intensity).
After sunrise, 1-minute GOES-16 Visible and Infrared images (below) showed that the eye of Dorian was finally beginning to move very slowly northwestward away from Grand Bahama Island. At the end of the animation (15 UTC), Dorian was downgraded slightly to a high-end Category 4 hurricane.
![GOES-16 “Red” Visible (0.64 µm) and “Clean” Infrared Window (10.35 µm) images [click to play animation | MP4]](https://cimss.ssec.wisc.edu/satellite-blog/wp-content/uploads/sites/5/2019/09/dor_vis-20190902_115923.png)
GOES-16 “Red” Visible (0.64 µm) and “Clean” Infrared Window (10.35 µm) images [click to play animation | MP4]
Suomi NPP VIIRS True Color RGB and Infrared images
(below) provided a view of Dorian at 1817 UTC.
![Suomi NPP VIIRS True Color RGB and Infrared Window (11.45 µm) images [click to enlarge]](https://cimss.ssec.wisc.edu/satellite-blog/wp-content/uploads/sites/5/2019/09/190902_1817z_suomiNPP_trueColor_infrared_Dorian_anim.gif)
Suomi NPP VIIRS True Color RGB and Infrared Window (11.45 µm) images [click to enlarge]
At 21 UTC, a comparison of MIMIC Total Precipitable Water and DMSP-16 SSMIS Microwave images (below) suggested that a tongue of drier air from the northwest and west was wrapping into the southern and southeastern portion of Dorian’s circulation.
![MIMIC Total Precipitable Water and DMSP-16 SSMIS Microwave images at 21 UTC [click to enlarge]](https://cimss.ssec.wisc.edu/satellite-blog/wp-content/uploads/sites/5/2019/09/190902_21utc_mimicTPW_dmsp16_ssmis_microwave_anim.gif)
MIMIC Total Precipitable Water and DMSP-16 SSMIS Microwave images at 21 UTC [click to enlarge]
A long animation of GOES-16 Infrared images
(below) covers the 1.5-day period from 1200 UTC on 01 September to 2359 UTC on 02 September — and initially includes 30-second images from 1200-1515 UTC on 01 September. Dorian was rated at Category 5 intensity from
1200 UTC on 01 September until
1400 UTC on 02 September. Station identifier MYGF is Grand Bahama International Airport in Freeport.
![GOES-16 “Clean” Infrared Window (10.35 µm) images [click to play animation | MP4]](https://cimss.ssec.wisc.edu/satellite-blog/wp-content/uploads/sites/5/2019/09/G16_IR_DORIAN_01_02SEP2019_2019245_045424_GOES-16_0001PANEL_FRAME01209.GIF)
GOES-16 “Clean” Infrared Window (10.35 µm) images [click to play animation | MP4]
Additional satellite imagery and products are available from EUMETSAT.
View only this post
Read Less
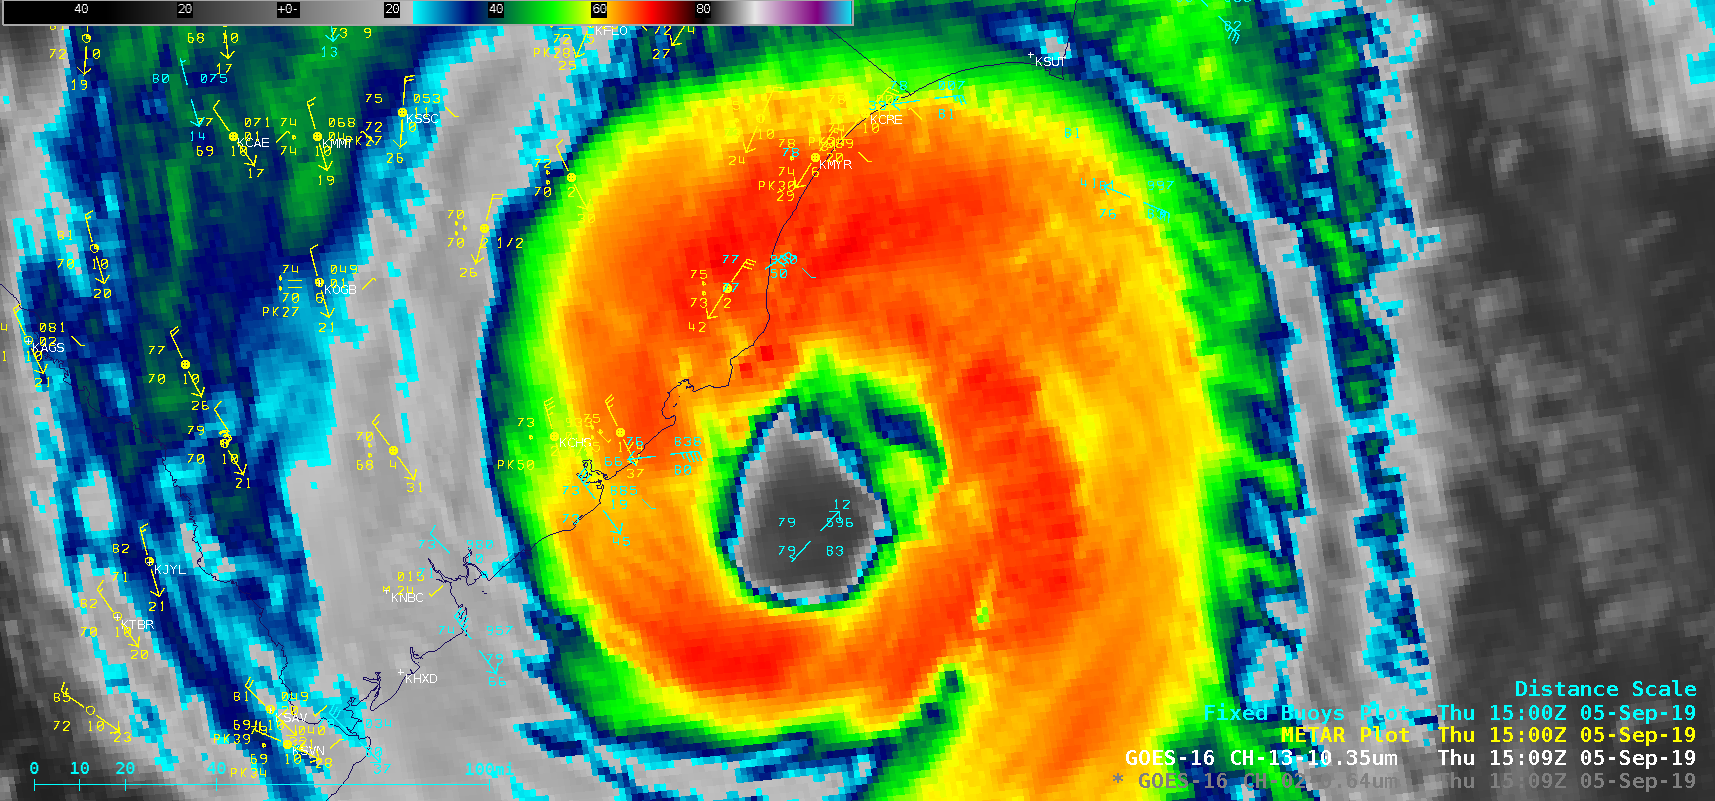
![GOES-16 “Red” Visible (0.64 µm) and “Clean” Infrared Window (10.35 µm) images [click to play animation | MP4]](https://cimss.ssec.wisc.edu/satellite-blog/wp-content/uploads/sites/5/2019/09/190905_goes16_visible_infrared_Dorian_anim.gif)
![GOES-16 “Clean” Infrared Window (10.35 µm) images, with contours of deep-layer wind shear at 19 UTC [click to enlarge]](https://cimss.ssec.wisc.edu/satellite-blog/wp-content/uploads/sites/5/2019/09/190905_goes16_infrared_19utc_deepLayerWindShear_anim.gif)
![VIIRS True Color RGB and Infrared Window (11.45 µm) images from Suomi NPP and NOAA-20 [click to enlarge]](https://cimss.ssec.wisc.edu/satellite-blog/wp-content/uploads/sites/5/2019/09/190905_suomiNPP_noaa20_viirs_trueColor_infraredWindow_Dorian_anim.gif)
![GOES-16 “Clean” Infrared Window (10.35 µm) images [click to play animation | MP4]](https://cimss.ssec.wisc.edu/satellite-blog/wp-content/uploads/sites/5/2019/09/190906_goes16_infrared_Dorian_anim.gif)
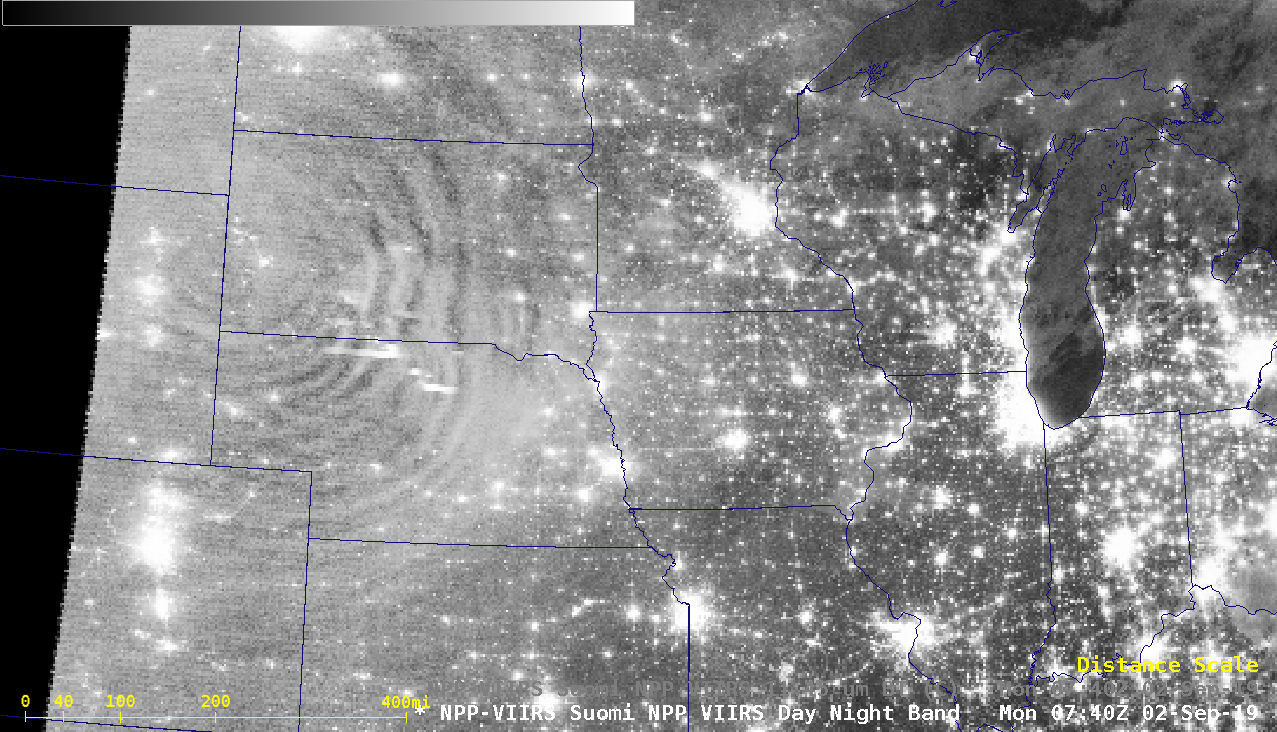
![VIIRS Day/Night Band (0.7 µm) and Infrared Window (11.45 µm) images from NOAA-20 (0740 UTC) and Suomi NPP (0831 UTC) [click to enlarge]](https://cimss.ssec.wisc.edu/satellite-blog/wp-content/uploads/sites/5/2019/09/190902_noaa20_suomiNPP_viirs_dayNightBand_infraredWindow_N_Plains_mesospheric_airglow_waves_anim.gif)
![VIIRS Day/Night Band (0.7 µm) and Infrared Window (11.45 µm) images from NOAA-20 (0740 UTC), Suomi NPP (0831 UTC) and NOAA-20 (0921 UTC) [click to enlarge]](https://cimss.ssec.wisc.edu/satellite-blog/wp-content/uploads/sites/5/2019/09/190902_noaa20_suomiNPP_viirs_dayNightBand_infraredWindow_N_Plains_mesospheric_airglow_waves_zoom_anim.gif)
![GOES-16 “Red” Visible (0.64 µm) and “Clean” Infrared Window (10.35 µm) images [click to play animation | MP4]](https://cimss.ssec.wisc.edu/satellite-blog/wp-content/uploads/sites/5/2019/09/190901_goes16_visible_infrared_30second_Dorian_anim.gif)
![GOES-16 “Red” Visible (0.64 µm) images, with and without overlays of GLM Flash Extent Density [click to play animation | MP4]](https://cimss.ssec.wisc.edu/satellite-blog/wp-content/uploads/sites/5/2019/09/190901_goes16_visible_glmFlashExtentDensity_Dorian_anim.gif)
![GOES-16 “Red” Visible (0.64 µm) images [click to play animation | MP4]](https://cimss.ssec.wisc.edu/satellite-blog/wp-content/uploads/sites/5/2019/09/190901_goes16_visible_Dorian_Bahamas_landfall_anim.gif)
![GOES-16 “Clean” Infrared Window (10.35 µm) images [click to play animation | MP4]](https://cimss.ssec.wisc.edu/satellite-blog/wp-content/uploads/sites/5/2019/09/190901_goes16_infrared_Dorian_Grand_Bahama_Island_anim.gif)
![GOES-16 “Clean” Infrared Window (10.35 µm) images [click to play animation | MP4]](https://cimss.ssec.wisc.edu/satellite-blog/wp-content/uploads/sites/5/2019/09/190902_goes16_infrared_Dorian_anim.gif)
![GOES-16 “Red” Visible (0.64 µm) and “Clean” Infrared Window (10.35 µm) images [click to play animation | MP4]](https://cimss.ssec.wisc.edu/satellite-blog/wp-content/uploads/sites/5/2019/09/190902_goes16_visible_infrared_Dorian_anim.gif)
![GOES-16 “Clean” Infrared Window (10.35 µm) images [click to play animation | MP4]](https://cimss.ssec.wisc.edu/satellite-blog/wp-content/uploads/sites/5/2019/09/190901_190902_goes16_infrared_Dorian_anim.gif)


