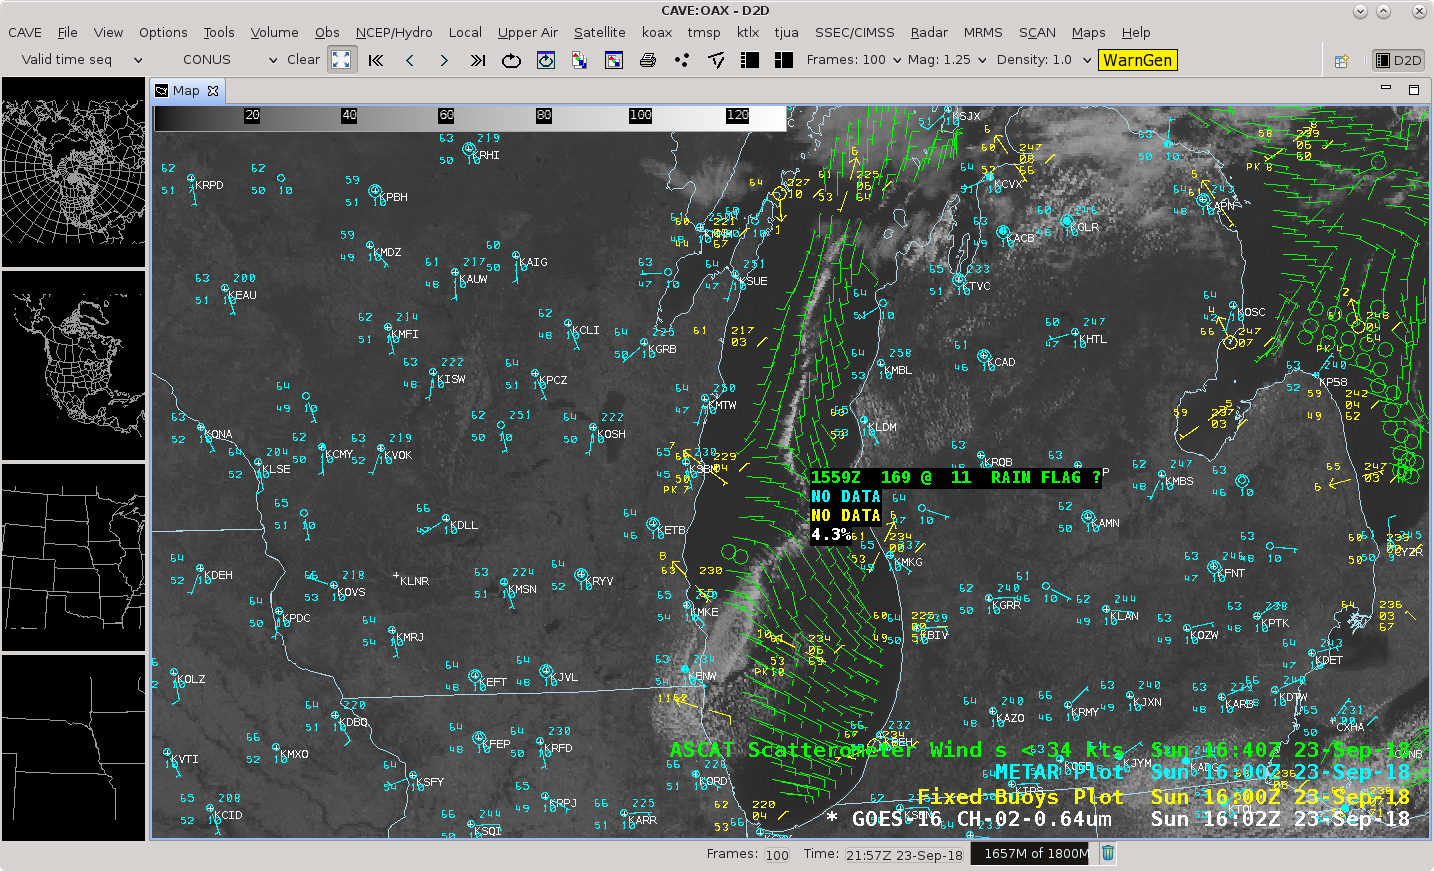
Land breeze convergence cloud band in Lake Michigan

GOES-16 “Red” Visible (0.64 µm) images, with hourly plots of surface and buoy reports [click to play animation | MP4]
Nighttime VIIRS Day/Night Band (0.7 µm) images from Suomi NPP at 0743 UTC and NOAA-20 at 0832 UTC (below) showed that the cloud band had not yet formed at those times.
![VIIRS Day/Night Band (0.7 µm) images from Suomi NPP at 0743 UTC and NOAA-20 at 0832 UTC [click to enlarge]](https://cimss.ssec.wisc.edu/satellite-blog/wp-content/uploads/sites/5/2018/09/180923_suomiNPP_noaa20_viirs_DayNightBand_Lake_Michigan_anim.gif)
VIIRS Day/Night Band (0.7 µm) images from Suomi NPP at 0743 UTC and NOAA-20 at 0832 UTC [click to enlarge]
![Terra/Aqua MODIS Sea Surface Temperature product [click to enlarge]](https://cimss.ssec.wisc.edu/satellite-blog/wp-content/uploads/sites/5/2018/09/180923_modis_SeaSurfaceTemperature_Lake_Michigan_anim.gif)
Terra/Aqua MODIS Sea Surface Temperature product [click to enlarge]
![Terra/Aqua MODIS Sea Surface Temperature product, with RTMA surface winds [click to enlarge]](https://cimss.ssec.wisc.edu/satellite-blog/wp-content/uploads/sites/5/2018/09/180923_modis_SeaSurfaceTemperature_rtma_surface_winds_Lake_Michigan_anim.gif)
Terra/Aqua MODIS Sea Surface Temperature product, with RTMA surface winds [click to enlarge]
![Terra MODIS Sea Surface Temperature product, with RTMA surface winds and Metop ASCAT winds [click to enlarge]](https://cimss.ssec.wisc.edu/satellite-blog/wp-content/uploads/sites/5/2018/09/180923_terra_modis_sst_rtma_ascat_winds_anim.gif)
Terra MODIS Sea Surface Temperature product, with RTMA surface winds and Metop ASCAT winds [click to enlarge]